Immunization Coverage in Selected Communities in the
Niger Delta, Nigeria
Angela Oyo-Ita1, Babatunde Fakunle2, Akinwumi Fajola2, Edet Edet2
1
Community Medicine Department, University of Calabar, Calabar, Nigeria; 2Community Health Department, Shell Petroleum De-velopment Company, Port Harcourt, Nigeria.
Email: [email protected]
Received September 2nd, 2011; revised November 1st, 2011; accepted November 18th, 2011
ABSTRACT
Background:The Expanded Program on Immunization was launched in Nigeria in 1980 but the target for immuniza- tion coverage has been elusive. As part of its social responsibilities the Shell Petroleum Development Company (SPDC) supported immunization activities in the Niger Delta region of the country. In this study a cross sectional study was carried out to estimate the coverage of BCG, OPV, DPT and measles vaccines and, to determine the predictors of full immunization coverage among children aged 12 to 23 months in selected SPDC supported communities in the Niger Delta. Using modified cluster randomization, 2432 children were included in the study. Results:Of 2432 children stud- ied 1585 (65.2%; 95% CI: 61.9% to 68.5%) were fully immunized with the four vaccines; 2323 (95.5%) had received at least one dose of a vaccine (card and history). About one third (36.6%) of the children aged 12 to 23 months with im- munization card were fully immunized by their first birthday. The proportion of children fully immunized with valid doses of vaccines by one year was 19.9% (485 of 2432) based on card only. One hundred and nine (4.5%) had never received immunization. Major reason for failure to be immunized was fear of side reactions. Main predictor for full immunization was availability of a health facility in the community. Discussion: The coverage of immunization was high in the study area; but the proportion of valid doses administered was low. Training of health workers and strategic behavioral communication to dispel fears of side reactions are recommended.
Keywords: Immunization; Childhood; Predictors of Completion; Quality
1. Introduction
Immunization is a life-saving intervention meant to pro- tect an individual from specific infections. It is consid- ered to be second to water in the control of infectious diseases [1]. Diseases have been controlled and in some instances eradicated through vaccination. Small pox has been eradicated globally between 1967 and 1977; mea- sles and poliomyelitis have been eliminated in regions of the world [2]. Similarly tetanus has been eliminated in 12 high risk countries globally [3]. Morbidity and mortality attributed to diphtheria, tetanus, and pertussis are also substantially reduced through vaccination [2].
Control of infectious disease occurs when the herd immunity threshold for the specific diseases is achieved. The herd immunity is the proportion of immune indi- viduals in the community above which a disease may not persist. This ranges from 75% for mumps to 94% for measles [4]. This depends on the virulence of the disease agent, efficacy of the vaccine, and the level of contact in the population [5]. The World Health Organization launched the Expanded Program on Immunization (EPI)
in 1980 targeting children less than 2 years as part of the efforts to increase the herd immunity against six child- hood killer diseases. The aim was to achieve 80% cov- erage among this age group by 1990.
In Nigeria, this target is yet to be achieved three dec- ades after the initiation of the program. In 1999 the gov- ernment substituted the EPI program with the National Program on Immunization (NPI) in the bid to re-energize immunization program in the country. Immunization co- verage in Nigeria increased from 12.9% in 2003 [6] to 16.4% in 2007 [7], a level too low to control the targeted diseases. Strategies adopted to expand immunization co- verage include routine immunization services in static health care facilities, National Immunization Days (NID), and mop-up campaigns for oral polio.
technical and logistic support for clinic based and out- reach immunization programs to the communities through their Community Health services program [8].
The goal of this study was to evaluate the impact such support has made in improving the coverage of four childhood vaccines namely BCG, OPV, DPT, and mea- sles immunization among children aged between 12 to 23 months within SPDC target communities in the Niger Delta region in Nigeria. It also aimed at assessing the determinants of full immunization coverage in the study area.
2. Study Setting
Niger Delta is the Southern part of Nigeria which con- sists of Bayelsa, Delta, Rivers, Akwa Ibom, Cross River, Edo, Ondo, Abia and Imo States. These States are the oil producing States in the country. The population of the area is estimated to be about 30 million [9].Ninety five percent of the economy of Nigeria is from oil and gas exploration in these States [10]. Shell Petroleum Devel- opment Company is a major investor in the oil and gas exploration in the region. The study was carried out in 6 States in the Niger Delta where SPDC business operates. These States were Rivers, Bayelsa, Delta, Abia, Akwa Ibom, and Edo States. All, except Abia state (located in the South East zone), are in the South South geopolitical zone.
The study targeted children aged 12 to 23 months of age in the study population. Based on the estimated im- munization coverage of 20.8% for 12 - 23 months chil- dren estimated by Multiple Indicator Cluster Survey (MICS) 2007 [11] in the south-south geopolitical zone, the sample size is estimated to be 300 per State at 6.5% precision and 5% type 1 error with a design effect of 2.
3. Ethical Clearance
Ethical clearance was obtained from Cross River State Health Research Ethics Committee. Participation in the study was voluntary. Verbal consent was obtained from parents/ guardians of included children. Information ob-tained was kept confidential.
4. Data Collection
Data was collected between April and August, 2010. World Health Organization tools for immunization sur- vey [12] were adapted for the survey. Information ob- tained included immunization status of child for each vaccine, reason for failure to immunize child, place of immunization, place of delivery, birth attendance at de- livery, availability of health facility in the community, and location of the community (land or riverine).
Two local government areas (LGA) with SPDC sup- ported facilities were selected within each of the six
States. Ten villages within each LGA were selected by simple random sampling when the number of wards within an LGA was more than ten; else, all ten wards in the selected LGA were included in the study. A village was randomly selected within each ward through simple balloting from a list of villages in the ward.
Ten health workers were recruited and trained as field assistants on data collection in each LGA. One field as- sistant was assigned to each of the selected village in the ten wards. The questionnaires were pre-tested in one of the villages not selected for the study. The starting point for the interview was either the town hall or the Chief’s compound where there was no town hall in the village. The direction to follow was determined by balloting. Each household was visited once. A minimum of 20 households with children aged 12 to 23 months were visited per village.
5. Analysis
Data was entered into MS Excel for cleaning. STATA statistical software was used to analysis the data which was presented as frequency tables, graphs and charts. Logistic regression was used to assess determinants of full immunization.
6. Results
A total of 13 LGAs were visited in six states; 3 LGAs in Rivers, 2 LGAs each in Abia, Akwa Ibom, Bayelsa, Edo, and Delta. The number of children included in the study was 2432.
6.1. Immunization Access
Coverage of DPT1 and BCG are used to assess immuni- zation access. Based on card and history, the coverage of DPT1 and BCG were 2152 (88.5%; 95% CI: 86.6% to 90.4%) and 2174 (89.4%; 95% CI: 87.6% to 91.2%) re- spectively. Using the BCG scar to assess immunization access 1863 (76.6%) of the 2432 children were found with the scar.
6.2. Vaccine Coverage
Table 1. Factors associated with full immunization (Logistic regression (n = 2111).
OR* p OR** p
Sex of child 1.04 0.66
Availability of facility 2.49 0.000 2.42 0.000
Delivery at health facility 3.13 0.000 1.83 0.003
Trained attendance at delivery 2.88 0.000 1.63 0.016
Landed community 1.93 0.000 0.74 0.075
*Univariate analysis; **Multivariate analysis—(adjusted for all the factors
except sex).
based on card and history, and 68.4% based on card alone for all the States. Measles coverage (card + history) was estimated to be 69.7% across the six States with the highest coverage of 83.4% in Edo.
6.3. Validity of Doses Given
Valid doses of vaccines were doses given at least by the minimum age allowed in the national immunization schedule. The proportion of children fully immunized with valid doses of vaccines by one year was 19.9% (485 of 2432) based on card only.
6.4. Drop-Out Rate
The drop-out rate in immunization coverage ranged from 12.6% between DPT1 and DPT3 to 19.7% between BCG and measles (Table 2).
6.5. Injection Technique
Scar formation from BCG is a proxy measure of injection technique. Eighty five percent of children immunized with BCG (card only) had scar. Scar formation from BCG vaccine varied between the States. Among those immunized with BCG (card + history), 14.3% were without scar. Akwa Ibom State had the highest propor- tion (20.7%) of BCG immunized children without scar while Bayelsa had the least (7.6%) (Figure 1).
6.6. Proportion Immunized on Schedule
About one third (36.6%) of the children aged 12 to 23 months with immunization card were fully immunized by their first birthday. Proportion of children fully immu- nized by one year of age varied between 18.3% in Delta State to 56% in Edo State (Figure 2).
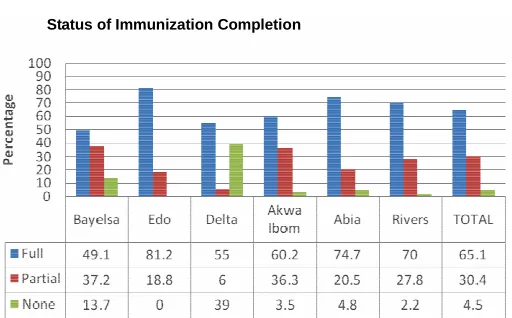
6.7. Completion of Schedule
One hundred and nine (4.5%) of the children had never been immunized while 1585 (65.2%) were fully immu- nized. Highest proportion of children 12 to 23 months that completed their immunization schedule were in Edo State and the least was in Bayelsa (Figure 3). All the children in Edo State were either partially or fully immu- nized. Proportion of children that had not received any antigen was highest in Bayelsa.
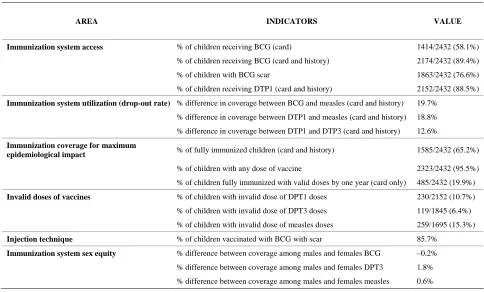
Table 2. Immunization coverage indices.
AREA INDICATORS VALUE
Immunization system access % of children receiving BCG (card) 1414/2432 (58.1%)
% of children receiving BCG (card and history) 2174/2432 (89.4%)
% of children with BCG scar 1863/2432 (76.6%)
% of children receiving DTP1 (card and history) 2152/2432 (88.5%)
Immunization system utilization (drop-out rate) % difference in coverage between BCG and measles (card and history) 19.7%
% difference in coverage between DTP1 and measles (card and history) 18.8%
% difference in coverage between DTP1 and DTP3 (card and history) 12.6%
Immunization coverage for maximum
epidemiological impact % of fully immunized children (card and history) 1585/2432 (65.2%)
% of children with any dose of vaccine 2323/2432 (95.5%)
% of children fully immunized with valid doses by one year (card only) 485/2432 (19.9%)
Invalid doses of vaccines % of children with invalid dose of DPT1 doses 230/2152 (10.7%)
% of children with invalid dose of DPT3 doses 119/1845 (6.4%)
% of children with invalid dose of measles doses 259/1695 (15.3%)
Injection technique % of children vaccinated with BCG with scar 85.7%
Immunization system sex equity % difference between coverage among males and females BCG –0.2%
% difference between coverage among males and females DPT3 1.8%
[image:3.595.55.539.445.737.2]Proportion without scar
[image:4.595.171.417.88.230.2]State
Figure 1. Proportion immunized with BCG but without scar based on card + history.
Infants Fully Immunized
[image:4.595.170.427.262.409.2]State
Figure 2. Proportion of infants fully immunized.
Status of Immunization Completion
Figure 3. Status of immunization among 12 to 23 months old.
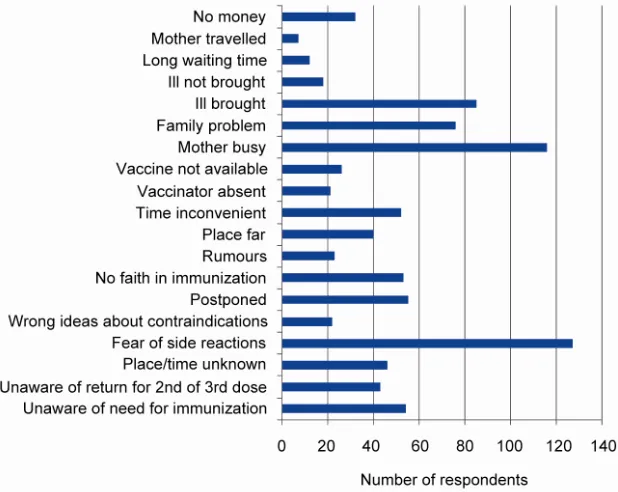
6.8. Reasons for Failure to Immunize
Fear of side reactions of vaccines was the major reason for failing to immunize or completing immunization sched- ule of children. Others were mother too busy, vaccinator refusing to immunize due to ill health of child and family problems (Figure 4).
6.9. Factors Associated with Full Immunization
Factors tested in a logistic regression for association with
[image:4.595.171.427.427.586.2]Figure 4. Reasons for failure to immunize per state.
ery at health facility, trained health personel at delivery, and location of commnity on land (Table 1).
7. Discussion
Immunization is one of the childhood survival strategies adopted by United Nations Children Fund to reduce in- fant and child morbidity and mortality. Progress in the coverage of immunization has been slow in Nigeria. Na- tional reports show that between 2003 and 2007 national immunization coverage decreased from 12.9%, to 10.9% [7]. Current National Demographic Health Survey report has shown an increase to 22.7% in 2008 (based on card + history). In the South South zone where five of the six States studied were located, coverage was 36% (card + history) [11]. In this study, immunization coverage is found to be 65.2% (card + history), almost double the estimate of the zonal coverage. This high coverage may be due to the contribution of Shell Petroleum Develop- ment Company towards immunization in the study area.
Almost all the children received at least a dose of a vaccine. This corroborates the National report which showed that proportion of children not immunized at all was particularly lower in the South South zone than any other zone in the country [11]. More than two thirds of the children with immunization card were fully immu- nized by the age of one year. However, only a fifth of them received valid doses of the vaccines. This may be an indication that the health workers do not screen the children adequately before vaccinating or they may have poor knowledge of immunization schedule.
Access to immunization services as estimated by the
coverage of DPT1 and BCG was high considering that the coverage was close to 90%. Drop-out rates were higher than 10% indicating poor quality of the immuni- zation program.Quality of the program was further de- monstrated in the skillfulness of the health worker in administering the vaccine. BCG scar is reported to be a sensitive indicator of vaccination status in children [13]; none scar formation after BCG vaccination is likely to be from poor injection technique or poor sero-conversion of the child. This implies that health workers’ failure to screen children before vaccination could impinge on the quality of immunization service and reduce the effec- tiveness of the vaccination.
Availability of health facility in the community, deliv- ery in a health facility, and delivery by trained personnel were associated with full immunization. Children in riv- erine communities were not less likely to be fully immu-nized when compared with children whose communities were on land. The main determining factor for full im- munization was availability of facility in the community. Children were 2.4 times more likely to be fully immu- nized if a health facility was available in their community. Provision and utilization of the health facility therefore, will enhance uptake of immunization in the study area.
countered side reactions. It has been known that mothers are particularly apprehensive when their children develop fever because of the fear of convulsion [14]. Creating awareness on the possible development of fever after oral polio vaccination may make mothers better prepared to manage it when the need arises.
Other reasons for failure to be fully immunized were mother busy at other things and family problems which reflect mothers’ lack of information on the importance of immunization. Health workers’ refusal to immunize due to ill health of child contributes significantly to reduced coverage and constitutes a missed opportunity for immu- nization in the area. Also to be noted is the inconvenient timing of immunization mentioned by some mothers. It was obvious that some mothers find the morning immu- nization services inaccessible.
8. Conclusion/Recommendations
The relatively high immunization coverage in the study area is hampered with poor quality of service. This can be addressed through training of the health workers. To sustain the coverage health facilities should be provided in all the communities. Strategic behavioral communica- tion needs to be developed to dispel fears of side reac- tions and provide targeted information that will boost and maintain immunization coverage in the study area. Ex- tending immunization sessions to evenings should be considered a priority in these communities.
9. Acknowledgements
Authors acknowledge the support of Shell Petroleum De- velopment Company for sponsoring the study.
REFERENCES
[1] F. E. Andre, R. Booy, H. L. Bock, J. Clemens, S. K. Datta, T. J. John, et al., “Vaccination Greatly Reduces Disease, Disability, Death and Inequity Worldwide,” Bulletin of the World Health Organization, Vol. 86, No. 2, 2008, pp 140-146. doi:10.2471/BLT.07.040089
[2] WHO, “Vaccine Preventable Deaths and the Global Immu- nization Vision and Strategy, 2006-2015,” World Health Organization, Geneva, 2006.
[3] WHO, “Tetanus Eradication in 12 Regions on the Globe,” 2010.
http://www.who.int/immunization_delivery/en/index.html
[4] WHO, “Smallpox Eradication History,” 2010. http://www.cdc.gov/agent/smallpox/training/overview/pd f/eradicationhistory
[5] P Fine, “Herd Immunity: History, Theory, Practice,” Epi- demiologic Reviews, Vol. 15, No. 2, 1993, pp. 265-302.
[6] National Population Commission (NPC) and ORC Macro, “Nigeria National Demographic Health Survey, 2003,” NPC and ORC Macro, Calverton, 2004.
[7] National Bureau of Statistics (NBS), “Nigeria Multiple Indicator Cluster Survey 2007 Final Report,” Abuja, 2007, p. 12.
[8] Shell Petroleum Development Company, “Shell in Nige-ria; Improving Lives in the Niger Delta,” 2011. http://www.shell.com.ng/home/content/nga/environment_ society/shell_in_the_society/health/immunisation/
[9] Family Health International, “End of Project Report: Ni- ger Delta AIDS Response Project,” Abuja, 2009, p. 1.
[10] H. T. Ejibuno, “Nigeria’s Niger Delta Crisis: Root Causes of Peacelessness,” EPU Research Papers, Vol. 7. No. 7, 2011.
[11] National Population Commission (NPC) and ICF Macro, “National Demographic and Health Survey, 2008,” NPC and ICF Macro, Abuja, 2009, p. 15.
[12] WHO, “Immunization Coverage Cluster Survey Reference Manual,” World Health Organization, Geneva, 2005. [13] E. M. Santiago, E. Lawson, K. Gillenwater, S. Kalangi, A.
G. Lescano, G. Quella, K. Cummings, L Cabrera, C Tor- res and R. H. Gilman, “A Prospective Study of Bacillus Calmette-Guérin Scar Formation and Tuberculin Skin Test Reactivity in Infants in Lima,” Peru PEDIATRICS Vol. 112, No. 4, 2003.
[14] M. G. Betz and A. F. Grunfeld, “Fever Phobia’ in the Emergency Department: A Survey of Children’s Care-givers,” European Journal of Emergency Medicine, Vol. 13, No. 3, 2006, pp. 129-133.