University of Warwick institutional repository: http://go.warwick.ac.uk/wrap
A Thesis Submitted for the Degree of PhD at the University of Warwick
http://go.warwick.ac.uk/wrap/51479
This thesis is made available online and is protected by original copyright. Please scroll down to view the document itself.
Development of Scanning Electrochemical Microscopy
for the Investigation of Photocatalysis at
Semiconductor Surfaces
Sofia Margarida Martins Costa da Fonseca
A thesis submitted for the degree of
Doctor of Philosophy
University of Warwick
Department of Chemistry
To my family,
Contents
Acknowledgements
Declaration ii
Abstract III
List of Abbreviations IV
List of Symbols
v
1. Introduction 1
1.1 Semiconductor Photocatalysis 1
1.1.1 Band Gap Photoexcitation of Semiconductors 2
1.1.2 Efficiency of Photocatalysis 3
1.1.3 Band Edge Positions 4
1.2 Photocatalysis on Ti02 Surfaces 6
1.2.1 Ti02 as a Photocatalyst 6
1.2.2 Mechanism of Ti02-Sensitised Photodegradation of Organic Pollutants 8
1.2.3 The Role of Oxygen in Ti02 Photocatalysis 11
1.2.4 Kinetics of the Photomineralisation Process 13
1.2.5 Controlled Periodic Illumination Effect in Ti02 Photocatalysis 15 1.2.6 Redox Reactions in Heterogeneous Photocatalysis 18
1.3 Scanning Electrochemical Microscopy 20
1.3.1 Basic Principles 21
1.3.2 The Feedback Mode 23
1.3.3 The Generation! Collection Mode 27
1.4 Scanning Electrochemical Microscopy as a Probe of Interfacial 30 Photochemical Processes
1.5 Aims 35
References 37
2. Experimental 49
2.1 Microelectrode Fabrication Procedures 49
2.1.1 Glass Coated Microdisc Electrodes 49
2.2
Apparatus and Instrumentation
51
2.2.1
Electrochemical Measurements
51
2.2.2
Non-electrochemical Techniques
53
2.3
SECM Set-up
53
2.4
Preparation and Characterisation of a Thin Ti02 Film
58
2.5
Solutions and Chemicals
60
References
62
3.
A Microelectrochemical Actinometer for Scanning Electrochemical63
Microscopy Studies of Photochemical Processes3.1
Introduction
63
3.2
Theory
65
3.3
Experimental Results and Discussion
69
3.3.1
Determination of the Molar Extinction Coefficient of the Ferrioxalate
69
Complex
3.3.2
Light Intensity Profile Through the Optical Fibre
70
3.3.3
Electrode-Fibre Alignment Measurements
72
3.3.4
Determination of the Light Flux Intensity
74
3.4
Conclusions
80
References
81
4.
Photoelectrochemical Reduction of Oxygen at Ti02 Films: Kinetics82
and Mechanism4.l
Introduction
82
4.2
Electrochemistry of Oxygen Reduction
83
4.3
Theory
85
4.3.1
Development of Mechanistic Models for the Photoelectrochemical
85
Reduction of Oxygen
4.3.2
Mass Transfer Model for the SECM Simulation
89
4.4
Experimental Results and Discussion
94
4.4.1
Preliminary Studies: Testing the Effect of UV Illumination
94
4.4.2
Mechanistic Study of the Photoelectrochemical Reduction of Oxygen at
97
4.4.2.1 4.4.2.2 4.4.2.3 4.4.3 4.5 4.6
5.
5.1 5.2 5.3 5.3.1 5.3.2 5.3.3 5.3.4 5.3.4.1 5.3.4.2 5.3.5 5.3.5.1 5.3.5.2 5.3.6 5.46.
6.1 6.2 6.3In the Presence of an Aqueous Electrolyte Solution In the Presence of a Hole Scavenger
In the Presence of an Organic Substrate
Development of a New Mechanistic Model for the Photoelectrochemical Reduction of Oxygen
Estimating the Quantum Efficiency Conclusions
References
Photo mineralisation Kinetics of a Model Organic Pollutant Sensitised by Ti02 Films
Introduction Theory
Experimental Results and Discussion
Preliminary Studies: Stability and Sensitivity of the Ag/AgCI UME to Monitor the Photomineralisation of 4-CP
4-CP Electrochemistry Photomineralisation of 4-CP
The Kinetics of 4-CP Photomineralisation: Light Intensity Effect In an Aerated 4-CP Solution
In an Oxygenated 4-CP Solution
Effect of [4-CP] on the Kinetics of 4-CP Photomineralisation In Aerated 4-CP Solutions
In Oxygenated 4-CP Solutions Estimating the Quantum Efficiency Conclusions
References
Photoelectrochemical Kinetics at the TiOv Aqueous Interface: The Methyl Viologen - Acetate System
Introduction Theory
Experimental Results and Discussion
6.3.1
Methyl Viologen Voltammetry159
6.3.2
Chronoamperometry of MV2+ Reduction at an Illuminated Ti02 Film162
6.3.3
Estimating the Quantum Efficiency168
6.3.4
Substrate Generation! Tip Collection Experiments169
6.4
Conclusions173
References
174
Acknowledgements
I would like to thank Prof. Patrick Unwin and Prof. Terence Kemp for their supervision and continuous encouragement during the course of my studies at Warwick. Especially, without the enthusiasm and support of Prof Patrick Unwin this work would not have been possible. I would also like to thank Dr. Anna Barker who has written the computer models, Dr. Julie Macpherson for her help and advice on microelectrodes preparation, Dr. Lou Gonsalves for showing me how to do the interferometry measurements and Dr. Samina Ahmed for her help in some initial actinometry experiments. Thanks must also go to everybody in the Electrochemistry and Interfaces group at Warwick for their friendship throughout my time in the group.
Additional thanks must go to M. Grant, L. Butcher and K. Westwood of mechanical workshops and P. Roskelly and K. Harris of electronic workshops for all their skilled and professional work.
I am eternally grateful to my parents and sister for all their love, support and encouragement during the past years. I am sure I could not have done this without our daily phone calls!
Declaration
I declare that the work contained in this thesis is entirely original and my own work, except where otherwise indicated.
Abstract
This thesis is concerned with the development and application of scanning electrochemical microscopy (SECM) to investigate interfacial photoelectrochemical processes occurring at supported Ti02 surfaces. The new SECM approach, involving both amperometric and potentiometric electrodes, was used to monitor interfacial photoprocesses with high spatial resolution.
A new in situ photoelectrochemical approach to chemical actinometry has been developed and used to determine the light flux through a quartz fibre employed in the SECM system. In this system an ultramicroelectrode (UME) probe is positioned with high precision at a known distance close to a TiOrcoated fibre and used to detect reactants or products of the ongoing photodegradation process. The microelectrochemical actinometry approach was developed using the well-known liquid phase potassium ferrioxalate actinometer. The approach involved recording the steady-state current for Pe(III) reduction at an SECM tip positioned close to the fibre. A step function in the light flux (off-on) was then applied and the resulting chronoamperometric behaviour due to the reduction of Fe(III) at the UME was recorded as a function of tip-fibre separation distance. A theoretical model
has
been developed to simulate experimental current-time profiles, which allowed the light flux through the quartz fibre to be quantified.An experimental approach to investigating the photoelectrochemical reduction of oxygen at UV-illuminated Ti02 surfaces, in aqueous aerated and oxygenated electrolyte solutions, in the absence and presence of hole scavengers, has been developed. In this new approach the chronoamperometric behaviour for oxygen reduction was recorded at an UME tip after stepping the light flux at a back-illuminated Ti02 film on and off The kinetics of the reduction process were interpreted through various theoretical models proposed in the literature. This experimental approach demonstrated a significant depletion of the oxygen concentration at the illuminated Ti02 surface, which provides a new insight into the photomineralisation process, showing the important role of oxygen in controlling the kinetics.
Using an SECM potentiometric approach, the photomineralisation kinetics of a model organic pollutant, 4-chlorophenol (4-CP), in aerated and oxygenated aqueous solutions at supported Ti02 films, were quantitatively investigated. A potentiometric
Agi AgCI
UMB, positioned at a known distance above the Ti02 film, was used to monitor directly thecr
production from the photomineralisation of 4-CP. A theoretical model, employing a Langmuir-Hinshelwood type kinetic equation, has been developed to interpret the kinetics of the photomineralisation process and determine the associated quantum efficiency. A direct correlation between oxygen consumption at the illuminated Ti02 surface andcr
formation in the photomineralisation process has been found.ADIFDM AgQRE CdS CFMED 4-CP G/C GC HPLC ITO L-H MV2+
Ox PEM Red RG SCE SECM SG/TC SPECM TEOA TG/SC
UME
uv
List of Abbreviations
Alternating direction implicit finite-difference method Silver quasi-reference electrode
Cadmium sulfide
Channel flow method with electrochemical detection 4-chlorophenol
Generation! collection Gas chromatography
High performance liquid chromatography Indium-tin oxide
Langmuir-Hinshelwood Methyl Viologen
Methyl Viologen radical cation Oxidised form of a redox couple Photoelectrochemical microscopy Reduced form of a redox couple
Insulator radius to electrode radius ratio Saturated calomel electrode
Scanning Electrochemical Microscopy Substrate generation! tip collection
Scanning photoelectrochemical and electrochemical microscopy Triethanolamine
Tip generation! substrate collection Ultramicroelectrode
[S]j ks
Ks
K0210
Q,2r
d i( 00) FD
• c n L r z A I KFo
List of Symbols
Quantum yield
Charge transfer process rate Electron-hole recombination rate
Concentration of electrons at the semiconductor surface Concentration of holes at the semiconductor surface Electron
Hole
Initial disappearance rate of substrate S Initial concentration of substrate S Proportionality constant
Equilibrium adsorption constant of S on Ti02 Equilibrium adsorption constant of 02 on Ti02 Light intensity
Fraction of adsorbed sites covered by O2 Proportionality constant
Insulator radius Radius of the UME
Tip-substrate separation distance Steady-state limiting current Faraday's constant
Diffusion coefficient of a species Bulk concentration of a species
Number of electrons transferred in a redox reaction Normalised tip-substrate distance (d! a)
Molar extinction coefficient
Radial co-ordinate in the axisymmetric cylindrical SECM geometry Normal co-ordinate in the axisymmetric cylindrical SEeM geometry Absorbance
Path length of the spectrophotometric cell Normalised rate constant
n
kzero
j
NE NG
NZ
N
NA
EF
Eredox
Surface density of adsorbed oxygen
Zero-order rate constant for the reduction of O2 Half-order rate constant for the reduction of 02
Langmuir-Hinshelwood rate constant for the reduction of O2 Normalised time (tDla2)
Rate of oxygen reduction
Number of grid points in the radial direction over the electrode Number of grid points in the radial direction over the glass sheath Number of grid points in the normal direction
Density of sites at the Ti02 surface Avogadro's number
CHAPTER 1
INTRODUCTION
This chapter provides an overview of the properties of semiconductors as photocatatalysts and reviews the current status on the primary processes and kinetics of the Ti02-sensitised photomineralisation of organic pollutants. The basic principles of scanning electrochemical microscopy (SECM) are described and an overview of SECM as a probe of surface photochemical processes is given. The aim of this thesis was to use SECM to obtain a more detailed understanding of the photoelectrochemical reactions occurring at a semiconductor surface.
1.1 Semiconductor Photocatalysis
1.1.1 Band Gap Pbotoexcitation of Semiconductors
The electronic structure of a semiconductor can be described by the band theory model, in which the highest occupied band (the valence band) and the lowest unoccupied energy band (the conduction band) are separated by a band gap Ebg, a region devoid of energy levels in a perfect crystal. 11
The initial process for heterogeneous photocatalysis of organic and inorganic compounds by semiconductors is the generation of electron-hole pairs in the semiconductor particles. The enlarged section of Figure 1. 1 shows the excitation of an electron from the valence band to the conduction band initiated by the absorption of a photon of ultra-band gap energy,
i.e.
light is absorbed with energy equal to or greater than the band gap of the semiconductor. This leads to the generation of a hole, h +, in the valence band and a corresponding electron, e-, in the conduction band. The classical picture of a hole is that of a highly localised electron vacancy in the lattice of the irradiated semiconductor particle.12 The electron, by virtue of its population of the conduction band, is much more delocalised and canbe
trapped at a surface defect site or by an adsorbed chemical trap.13 Upon excitation, the fate of the separated electron and hole can follow several pathways. 11 Figure 1.1 illustrates some of the deexcitation pathways for the electrons and holes.probability and rate of the charge transfer processes for electrons and holes depend upon the respective positions of the band edges for the conduction and valence bands and the redox potential levels of the adsorbate species. This issue will be considered in section 1.1.3.
In competition with charge transfer to adsorbed species is electron and hole recombination. Recombination of the photogenerated electron-hole pair can occur in the bulk of the semiconductor (pathway B) or on the surface (pathway A) with the release of heat.
Figure 1.1 Schematic photoexcitation of a semiconductor followed by deexcitation events. II
1.1.2 Efficiency of Photocatalysis
gIven by a simple relationship where a combination of all the pathway probabilities for the electron and hole has been considered:
(1.1 )
where
¢
is proportional to the rate of the charge transfer process (ker) and inversely proportional to the sum of the charge transfer rate (ker) and the electron-hole recombination rate (kR) in the bulk and at the surface. It is considered that the diffusion of the products into the solution proceeds so rapidly that the reverse reaction of electrons recombining with donors and holes recombining with acceptors does not occur.In the absence of recombination, the quantum yield would take on the ideal value of unity. In this idealised case, the rate of charge transfer would be dependent on the diffusion of charge carriers to the surface in the absence of excess surface charge. However, in a real system recombination does occur and the concentration of electrons (ns) and holes (Ps) at the surface is not equal.15 In order to obtain a more efficient charge transfer process, charge carrier traps are used to promote the trapping of electrons and holes at the surface of the semiconductor. For photooxidation processes on Ti02, ns > ps, because the electron transfer to molecular oxygen trapped at defect sites is relatively slow. A decrease in the electron-hole recombination rate can be achieved by modifications made to the semiconductor surface, such as additions of metals, dopants, or combinations with other semiconductors. II
1.1.3 Band Edge Positions
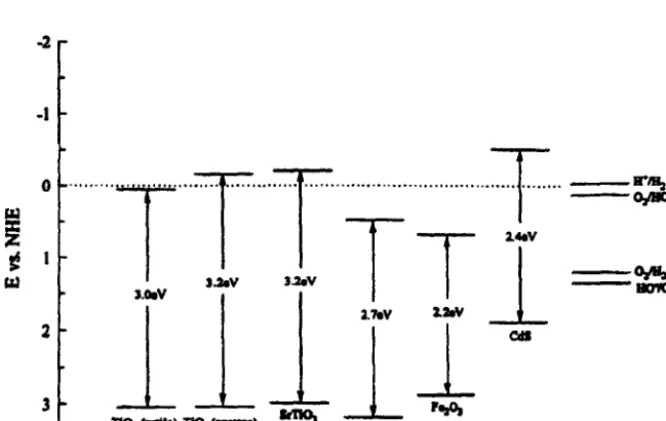
semiconductor and the redox potentials of the adsorbate. 1 I Knowledge of the band positions for semiconductors is useful as it indicates the thermodynamic limitations for photoreactions that can be carried out with the charge carriers. In order to photoreduce a chemical species, the conduction band of the semiconductor must be more negative than the reduction potential of the chemical species; to photooxidise a chemical species, the potential of the valence band of the semiconductor must be more positive than the oxidation potential of the chemical species. Figure
1.2
shows the band gaps and band edges of several semiconductors at pH O. The band edge positions of a semiconductor are influenced by the pH of the contacting solution. The band edge positions of Ti02 are known to shift cathodically with pH (band positions change by ca. -0.059 V x ApH).16.17 [image:18.536.99.432.393.604.2]-I
Figure 1.2 Valence and conduction band positions for various semiconductors, and useful, relevant redox couples at pH O. )
simultaneously, the redox potential of the photogenerated conduction band
electron is negative enough to convert oxygen to superoxide anion (02-- or its
protonated form H02
e).This gives Ti02 the capability to photooxidise a large
variety of organic pollutants, as will be considered in section 1.2.2.
1.2 Photocatalysis on Ti02
Surfaces
Several simple oxide and sulfide semiconductors are available for
photocatalysis. They include Ti02, W03, SrTi03, Fe203, ZnO and ZnS. However,
among these semiconductors Ti02 has proven to be the most suitable for
widespread environmental applications.3,4,7 Ti02 is biologically and chemically
inert, it is stable with respect to photocorrosion, and it is inexpensive.)
It is alsoable to completely oxidise a wide range of organic pollutants. )8
1.2.1 Ti0
2as a Photocatalyst
Ti02 photocatalysis has been applied to a variety of problems of
environmental interest.
Ithas been shown to be useful for the oxidation of
organic4,19,20 and inorganic2,21 pollutants, for the destruction of microorganisms
such as bacteria22 and viruses,23 for the inactivation of cancer cells,24.25 for odour
control,26 for the photosplitting of water to produce hydrogen gas,27,28,29,30 for the
fixation of nitrogen,31.32,33 and for the clean up of oil spills. 34.35,36
Currently Ti02 is considered the most effective semiconductor
photocatalyst due to the following properties:)·37
i) highly photocatalytically active
ii) biologically and chemically inert
iv) insoluble in aqueous solution v) inexpensive
vi) able to oxidise completely a wide range of hazardous and toxic compounds.
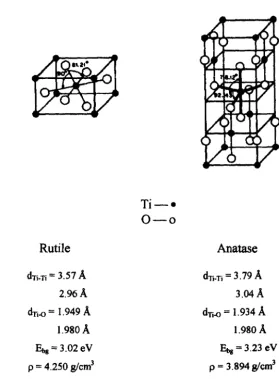
Ti02 is available in two different crystalline structures, rutile and anatase, and due to this difference in the lattice structure, different mass densities and electronic band structures are produced as shown in Figure 1.3.11,38,39
Rutile
dTi-Ti = 3.57
A
2.96A
dTi-O = 1.949
A
1.980A
Ebg = 3.02 eV
p = 4.250 glcm3 ~Gof= -212.6 kca1lmole
Ti-e
0-0
Anatase dTi-Ti = 3.79
A
3.04A
dTi-O = 1. 934
A
1.980 A
[image:20.540.126.406.249.629.2]Ebs=3.23 eV p = 3.894 glcm3 ~Gof= -211.4 kcallmole
Figure
1.3
Unit cell structures of rutile and anatase Ti02. IIband gap (3.23 vs 3.02 eV in rutile).4o,41 Also, a higher degree of surface hydroxylation is present in the anatase form.42 Generally, the Ti02-sensitised photocatalysis process involves the oxidation of surface hydroxide groups, which actively participate in the photodegradation process.43 Thus, the higher degree of surface hydroxylation in anatase makes it more effective in the photodegradation of a wide range of hazardous compounds.
Currently Degussa P25 Ti02 is accepted as the most effective research standard. 1,4 It is a non-porous 70:30 anatase-to-rutile mixture with a surface area of 55 m2 gol and particle size of 30 nm in 0.1 pm diameter aggregates. It has a higher photocatalytic activity than any other readily available form of Ti02. Fujishima's group has reported the development of transparent Ti02 films with higher photocatalytic activity towards the decomposition of thin oil films than Degussa P25. 43,44 These Ti02 films show useful self-cleaning, deodorising and antibacterial functions even under the weak UV light existing in typical indoor environments.45,46,47,48
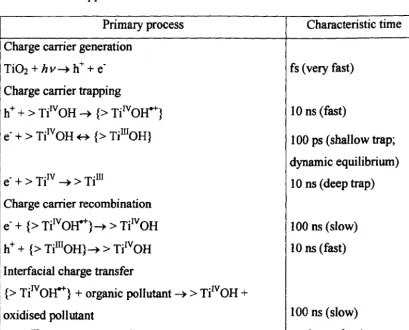
1.2.2 Mechanism of Ti02-Sensitised Photodegradation of Organic Pollutants The Ti02-sensitised photomineralisation of organic substrates by oxygen may be summarised as follows
TI02
Organic pollutant + O2 ~ CO2 + H20 + mineral acids (1.2) hV~ba
Figure 1.4
Energetics and major general processes for the photomineralisation of
organic pollutants in aqueous solution by dissolved oxygen, sensitised by Ti02
. I I partlC
es.
Table
1.1Primary processes and associated characteristic time domains in the
Ti02-sensitised photomineralisation of organic pollutants.
1,4 > TiOH representsthe primary hydrated surface functionality ofTi02,
{>TilVOI1+} is the
surface-trapped valence band hole
(i.e.,surface-bound hydroxyl radical), and
{> TiIIIOH}is the surface-trapped conduction band electron.
Primary process
Characteristic time
Charge carrier generation
Ti02
+
hv-+ h++
e-
fs (very fast)
Charge carrier trapping
h+
+
> Ti1vOH-+
{> TilVO~} 10ns (fast)
e-
+
> TiIV OH ~ {> TiIIIOH} 100ps (shallow trap;
dynamic equilibrium)
e-
+
> TiIV -+ > TiIII 10ns (deep trap)
Charge carrier recombination
e-
+
{>TilVOW}-+ > TilVOH
100ns (slow)
h+
+
{>TiIIIOH}-+ > TiIvOH
10ns (fast)
Interfacial charge transfer
{> TilV 0I1+}
+
organic pollutant
-+
> TiIV OR+
oxidised pollutant
100ns (slow)
In general, for efficient degradation, the organic reactant, RH2, must be adsorbed onto the photocatalyst surface, where oxidation of the adsorbate can occur either directly through interfacial electron transfer (direct hole oxidation, equation 1.3) or indirectly through an ·OH mediated attack (equations 1.4-1.6).
h + + RH2 ~
-ruI
+W
h + + H20 ~ ·OHad +W
h+ + OI1ad ~ ·OHad RH2 + ·ORad ~1U1 + H
20(1.3) (1.4), (1.5) (1.6) Minero el al.51 have shown that the ·OH radical does not migrate far from the photogenerated active site on Ti02, and that the degradation process must occur at the photocatalyst surface or within a few atoms of distance from the surface.
Okamoto el al.52 demonstrated that the formation of hydrogen peroxide (H20 2) from superoxide (02.-) can generate ·OH radicals which will also participate in the photodegradation reactions. Molecular oxygen functions as an electron acceptor which is reduced by the electrons of the conduction band to produce superoxide anions (equation 1. 7~
en. -
is a trapped conduction band electron).(1.7) In acidic media, the superoxide radical aruon protonates to gIve the hydroperoxide radical, H02• (equation 1.8). Reactions 1.9-1.11 provide the pathways for H202 formation:4,53,54
02-+W
~H02·H02• + H02· ~ H202 + 02 H02· + 02 - ~ H02 - + 02
(1.11) Hydroxyl radicals can thus be formed via the following reactions (equations 1.12_1.14):52,53
(1.12) (1.13)
(1.14) There is a significant body of literature showing that oxidation can occur either by mediated ·OH radical oxidation55,56,57,58,59,60 or by direct hole oxidation.61 ,62,63,64,65,66,67 Whether direct or mediated reaction occurs will depend
on the nature of the organic substrate.68 The direct oxidation pathway is shown to be more important for strongly adsorbing substrates68 and at very high substrate concentrations.69,70
1.2.3 The Role of Oxygen in Ti02 Photocatalysis
Oxygen acts as an electron acceptor, scavenging electrons from the conduction band and thus reducing the recombination rate. This process is of particular interest since Gerischer and Heller have suggested that electron transfer
b
hI" .
.
.
d htal·
717273quantum efficiency of the photoassisted oxidation of 10-2 M aqueous 2,2-dichloropropionate 3-fold at 0.01 wt % Pd and 7-fold at 2 wt % Pd.72
Lewis and co-workers 74 have developed a flux-matching model of semiconductor photocatalysis based on their work with single-crystal rutile Ti02 photoelectrodes. In this model, three major carrier decay pathways were identified, namely electron-hole recombination, oxygen reduction by photogenerated electrons and hole transfer to the organic, water or other hole acceptor species in the solution. All this three processes are closely related and none can be stated as being rate-determining. However, they were also able to show that the presence of a
Pt
catalyst on the surface of the Ti02 photocatalyst should lead to an enhancement in the rate of the photodegradation process.It is becoming apparent that molecular oxygen and the superoxide radical amon play an important role in the oxidation of several types of organic reactants.44,64,75,76,77 Studies of 4-chlorophenol (4-CP) degradation in a Ti02 slurry suggested that oxygen plays a specific role during photooxidation in addition to scavenging the trapped electrons.78,79,8o It was found that 4-CP degradation only occurs to a small extent (20%) in the presence of an alternative electron acceptor capable of scavenging the trapped electrons as readily as oxygen, while complete photomineraiisation is achieved in a similar time frame when oxygen is present.
aliphatic (equation 1.15), to produce an organoperoxy radical (ROO·; equation 1.16).
RH + h+ (or ·OH) ~ R· + H+ (or H20)
R·+02~ROO·
(1.15)
(1.16) The organoperoxy radical reacts with the superoxide radical to fonn an unstable tetraoxide (equation 1.17) that decomposes to products. Oxygen plays an essential role in these oxidation reactions.
(1.17) Fujishima and co-workers44 have also shown that oxygen and the superoxide radical are involved in the Ti02 photocatalytic degradation of gas-phase acetaldehyde. In their study of the mechanism of the Ti02 photocatalytic decomposition of ethanol in aqueous solution, using a microelectrode technique, they were able to show that molecular oxygen participates in the photooxidation reactions.76 Thus, oxygen plays a major role in the oxidation of the organic substrate.
1.2.4 Kinetics of the Photomineralisation Process
The rate of photomineralisation of an organic substrate, S, sensitised by Ti02 depends on several factors such as: (i) crystalline fonn and concentration of Ti02 particles; (ii) concentration of dissolved oxygen; (iii) nature and concentration of the organic substrate; (iv) intensity of the i1luminating source; (v) temperature and pH of the polluted medium; (vi) the presence of interfering adsorbing species and (vii) the effect of mass transport.
of the reaction rate on solution pH is usually found. 82,83,84 Changes in rate of photocatalytic activity from one end of the pH range to the other are usually small, often less than one order of magnitude.12 Also, the photodegradation process is not highly sensitive to minor variations in temperature.12 The photoassisted degradation rate of aliphatic alcohols was found to be temperature insensitive, indicating that the potentially temperature dependent steps, such as adsorption, desorption, surface migration or rearrangement do not appear to
be
rate-limiting in this case. 85,86Several kinetic models describing mechanisms of photooxidation reactions have been proposed,57,87,88,89,90,91 but in general, the initial rate of photocatalytic degradation of an organic substrate S matches the Langmuir-Hinshelwood (L-H) kinetic model: 1,4,12
(1.18)
where ri is the initial disappearance rate of substrate S, [S]j is the initial concentration of the organic substrate, Ks is the Langmuir adsorption constant of species S on the Ti02 surface and ks is a proportionality constant which provides a measure of the intrinsic reactivity of the photoactivated surface with S.
The coefficient ks is proportional to lam, where 1a is the intensity of light (photons S-I) and m is a power term which is equal to 0.5 or unity at high or low light intensity respectively. 57 The coefficient ks is also proportional to the fraction of oxygen adsorbed on Ti02, 00 , which can
be
expressed by the following2
equation:
where K 02 is the Langmuir adsorption coefficient for 02, which appears to be
non-competitively adsorbed on Ti02 due to its exclusive adsorption at TiIII sites~ hydroxyl radicals and organic substrates are adsorbed at TiIV -lattice oxygen sites.92 Thus equation (1.18) can be expressed more completely as follows:
( 1.20)
where ris a proportionality constant.
Equation (1.20) is often found to
be
applicable to batch suspension systems,93,94 i.e. those in which the semiconductor is dispersed in an aqueous solution containing the organic substrate for photomineralisation. Many flow systems95 have also been developed in which the semiconductor is immobilised on an inert support and the aqueous solution containing the organic substrate for photomineralisation is passed over it. In these flow systems, equation (1.20) usually still applies, but often with the reaction rate exhibiting a dependence on the flow rate, indicating a mass transfer dependence which is not found with batch systems.96 Ahmed et al.,97,98 using the channel flow method with electrochemical detection (CFMED) to study the photomineralisation of four chlorophenols, have shown that mass transport is a key parameter controlling the photodegradation kinetics at supported semiconductor surfaces.1.2.5 Controlled Periodic Dlumination Effect in Ti02 Photocatalysis
continuous illumination.99.100.101 Sczechowski et 01.99•102 demonstrated a means of increasing the aqueous phase photoefficiency of formate ion oxidation by using a controlled periodic illumination of a Ti02 catalyst suspension. They proposed that intermediate species, such as hydroxyl radical and superoxide anion, that are involved in the photocatalytic oxidation of organics can also participate in reactions that result in the recombination of electron-hole pairs or other redox processes that do not oxidise the organic. The build up of these intermediates due to continuous illumination of the particles will favour these undesirable reactions. Controlled periodic illumination may reduce the build up of intermediates and increase the photoefficiency. By illuminating the particles for short intervals, a limited number of electron-hole pairs will be generated, and when the particles are in the dark, the redox reactions leading to oxidation of the organics can take place. After most of the intermediates are consumed, the particles can be illuminated again for another short period. Using this light-dark cycling, they reported a 5-fold increase in the photoefficiency of formate oxidation. However, there was not enough information to support any specific mechanism for the enhancement seen in their work.
or to allow completion of electron transfer to adsorbed oxygen (and completion of follow-on reactions). The work of Upadhya and Ollis provided reasonable agreement between the photoefficiency trends in experimental and model simulation.
Buechler et al.104 have also investigated the photocatalytic oxidation of formate ion at illuminated Ti02 particles using the controlled periodic illumination effect. The key result from their study was the observation that the formate ion concentration contributed to limiting the photocatalytic rate. At the highest formate ion concentrations, there was little or no controlled periodic illumination effect. However, at lower formate ion concentrations. an apparent controlled periodic illumination effect was observed. The apparent improvement in the efficiency of the photocatalytic process due to the controlled periodic illumination effect was attributed either to mass transport limitations of formate ion and/or oxygen to the catalyst surface or to slow adsorption/reaction steps. They argued that the model proposed by Upadhya and OlliSI03 was only accurate for systems which were limited by the adsorption or reaction of oxygen, and that the formulation of the model failed to account for the enhancement caused by controlled periodic illumination when the photocatalytic rate was limited by adsorption of the formate ion.
illumination reported by other groups were actually based on quantum yields (or efficiencies) determined under widely different average photon fluxes. Based on their results, Hoffmann and co-workers concluded that no advantage arises from the use of periodic illumination over the continuous regime.
1.2.6 Redox Reactions in Heterogeneous Photocatalysis
There is a large body of work on interfacial electron transfer reactions at colloidal semiconductor particles (diameter of 50-500 A), which form transparent aqueous dispersions. 106,J07,J08 These colloidal systems provide an excellent medium in which to investigate electron transfer reactions across a semiconductor/liquid interface, since their dynamic behaviour can
be
monitored directly by time-resolved techniques such as flash photolysis. 109,1 10,1 IIThe elementary steps in the heterogeneous electron transfer induced by light from a semiconductor particle to an appropriate acceptor molecule in solution are: (i) excitation of the semiconductor particle and charge carrier diffusion to the interface~ (ii) charge carrier trapping on the particle surface~ (iii) encounter complex formation of the electron (or hole) acceptor with the semiconductor particle~ (iv) interfacial electron transfer. 106,112
with respect to MV2+ concentration, and it was shown that the electron transfer involved bulk diffusion of the acceptor to the semiconductor particle and did not proceed via My2+ adsorbed to the surface of Ti02. Gr4tzel and co-workers 109 have also shown that as the pH increases, the rate constant for interfacial electron transfer to MV2+ also increases. This results from a cathodic shift in the potential of electrons on the particles (the conduction band potential of Ti02 is known to be shifted by 59 mY upon changing the pH by one unit,16,17 but the redox potential of the MV2+~ couple is pH independent), which increases the thermodynamic driving force for reaction. The interfacial electron transfer step controls the rate at lower pH when the overvoltage available to drive the reaction is small. At higher pH, mass transfer effects become increasingly important and determine the overall reaction rate.
enhancing the anodic photocurrents observed. The role of acetate ion is rapid removal of photogenerated holes in an irreversible fashion. Its presence prevents "short circuiting" of the particle by MV2+ (i.e., by the reaction ~. + h + -+ MV2+), thus allowing the observation of a net photocurrent. A pH effect on the photocurrent was also observed. As the pH of the Ti02 suspension was increased, the rate of MV2+ reduction also increased due to the cathodic shift of the conduction band electrons, which increases the driving force or overpotential for reduction.
Darwent and co-workerslll also reported a similar pH effect for electron transfer from Ti02 colloids to an aromatic azo dye, methyl orange.
1.3 Scanning Electrochemical Microscopy
The scanning electrochemical microscope (SECM) was first introduced in 1989 by Bard and co-workersl14 and is one of a family of scanned probe microscopes. The SEeM employs an ultramicroelectrode (UME)1I5,I16,117 probe immersed in solution near a conductive, semi conductive, or insulating substrate such that the electrochemical response of the UME is governed by mass transfer between the interface and UME, as well as by chemical reactions occurring at the interface. The technique can probe both the topography and the reactivity of a surface with a resolution governed by the dimensions of the UME tip, typically of the order of 1-25 J.1m diameter.
semiconductors,122,123 ionic single crystals I24,125,126.127.128 and polymers. 129 It has also provided a quantitative understanding of processes occurring at liquidiliquid130. 131,132 and liquidlgas133,134 interfaces. In addition SECM has proved to be a powerful probe of biologically important materials,135,136,137,138 and its use in monitoring electroassisted or photoassisted reactions on semiconductor surfaces has also been reported. 139,140,141,142,143
Several reviews have been published covenng the diverse range of applications of the SECM. I44,145,146,147,148,149
1.3.1 Basic Principles
The tip used in SEeM is usually a disc-shaped UME which consists of a small metal wire (such as platinum or gold), sealed in a glass capillary which is then polished back to expose the wire, reSUlting in an electrode of micrometer dimensions (Figure 1.5). The geometry of the tip (electrode plus insulating glass capillary) is characterised by the RG value:
RG = rgl a (1.21)
where rg is the radius of the glass capillary plus the electrode and a is the radius of the electrode. Usually a typical value of
RG =
10 is employed.conventional dynamic electrochemical circuit which includes a reference
electrode and sometimes an auxiliary electrode, if large currents are to be passed.
Because of the low currents associated with UMEs, due to their small size, a
two-electrode set-up usually suffices. The current that flows at the tip electrode upon
electrolysis of the mediator is usually amplified by a current to voltage converter
and recorded via a data acquisition card on a personal computer as a function of
tip-substrate distance and/or time.
a)
Glass capillary:
Micro-wire
b)
Insulator
Electrode
Figure 1.5 Schematic diagram of a glass-coated UME: a) side view, b) end view.
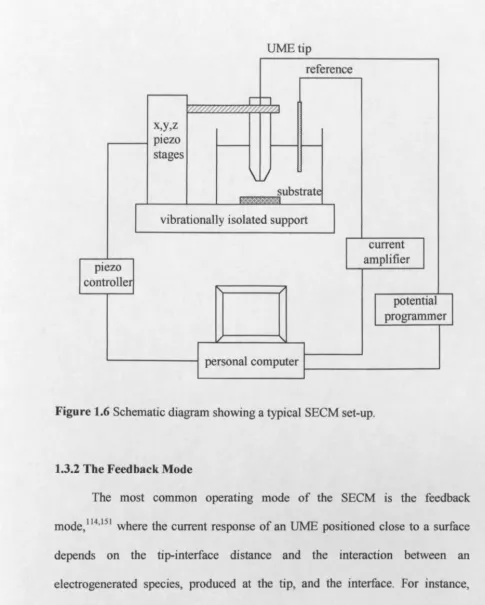
A typical SECM set-up is shown in Figure 1.6. The UME is attached to
piezoelectric elements which allow it to be moved and positioned relative to the
sample surface in all three Cartesian axial directions, with sub-micron level
resolution. If the sample to be studied is a conductor or a semiconductor it can be connected as a second electrode through the use of a bipotentiostat.150 Insulating
samples are not part of the electrochemical cell circuit and are simply positioned
UMEtip
reference
r -h /' /'///////////: r/,F///,
x,y,z
plezo ~
I -stages
\lJ
substrate
~'.:~:".: .\'>:.:~
I
vibrationally isolated supportcurrent
ptezo amplifier
controller
potential programmer
[image:36.531.13.499.16.621.2]personal computer
Figure 1.6 Schematic diagram showing a typical SEeM set-up.
1.3.2 The Feedback Mode
The most common operating mode of the SEeM is the feedback
mode, 1 14,151 where the current response of an UME positioned close to a surface
depends on the tip-interface distance and the interaction between an
electrogenerated species, produced at the tip, and the interface. For instance,
consider a solution containing the reduced fonn of a redox couple, Red, which can
be oxidised at the electrode to produce the oxidised form, Ox. If the potential at
the SEeM tip is sufficient to oxidise species Red to Ox at a diffusion-limited rate,
the current will rapidly assume a steady-state value, which is proportional to the
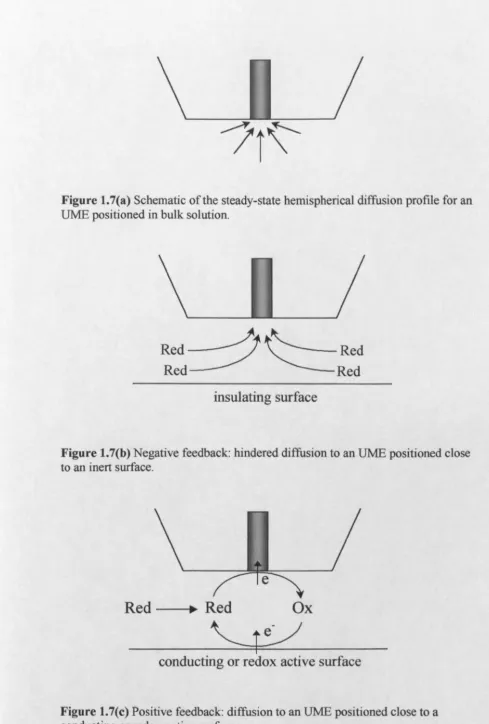
tip-substrate separation ~ 10 a), the diffusion layer near the tip electrode is roughly hemispherical (Figure 1.7(a». The corresponding steady-state current attained at the tip, i(oo), for a disc-shaped UME, is given byl52,153
i(oo) = 4nFDac
..
(1.22)where n is the number of electrons transferred in the redox reaction, F is the
Faraday constant, a is the electrode radius, and D and c" are the diffusion coefficient and bulk concentration of the electroactive mediator, respectively.
When the UME is brought close to an interface, the flux of the mediator towards the electrode is modified by the presence of the interface, compared to the case where the UME is in bulk solution. The effect on the tip current depends on the reactivity of the interface and the tip-interface distance. When the tip is brought near (typically d<
a
for a pronounced effect) an inert, electrically insulating substrate, diffusion of Red to the tip is hindered and the tip current, i, is lower than that observed in the bulk solution, i < i(oo) (Figure 1.7(b». The closerthe tip approaches to the substrate, the smaller i becomes. At the limit when the distance between tip and substrate, d, approaches zero, i also approaches zero. This effect is termed negative feedback. 1 14,154
Figure 1.7(a) Schematic of the steady-state hemispherical diffusion profile for an UME positioned in bulk solution.
Red0~-Red
Red
Red
insulating surface
Figure 1.7(b) Negative feedback: hindered diffusion to an UME positioned close to an inert surface.
Red
•
Red
Ox
~
conducting or redox active surface
[image:38.531.8.498.24.749.2]The magnitude of the negative and positive feedback effects are dependent on the tip-substrate separation, and the positive feedback response also depends on the rate of the interfacial redox reaction.
To measure the kinetics of reactions that occur at an interface, it is possible to construct approach curves, which show the variation of the steady-state current as a function of the tip-interface distance, d. Plots of the theoretical nonnalised current ratio, i / i( 00), against the nonnalised tip-interface separation, d/a, for the limiting cases of negative and positive feedback are shown in Figure 1.8. These limiting cases correspond, respectively, to surface reaction kinetics where the rate is zero, and where the rate of the redox reaction occurring at the substrate is controlled by mass transport. When the redox reaction at the substrate is characterised by finite kinetics, approach curves lie between these two limiting cases and can be fitted to simulated working curves. These are very useful in finding the rate of heterogeneous charge transfer at an interface. 144,150,155
8.0
7.5
S.O
-
8
4.5
'= ~
3.0
1.5
0.0
2.0 2.5
0.0 0.5 1.0 1.5
d/.
Figure 1.8 Plot of theoretical approach curves for positive (upper curve) and negative (lower curve) feedback of the SECM. Data from J. Kwak and A. J. Bard,
Anal. Chern.,
1989,61, 1221.1.3.3 The Generation/Collection Mode
In generation/collection (G/C) experiments, one working electrode is used to generate a species that is collected at the second electrode. There are two significantly different G/C SECM arrangements, namely the substrate generation/tip collection (SGrrC) model60,161,162,163.164 and the tip generation/substrate collection (TG/SC) mode. 165,166.167,168
Ox
r
Ox
~e
Tip electrode
Red
t--.Prods
Red
~
Substrate electrode
Figure 1.9(a) The TG/SC mode.
Tip electrode
Ox Red Ox Red Ox Red
1
r
Prods
I
r
Prods
1
r
Prods
Ox Red Ox Red Ox Red
)-
.
2
'):.
.
/
):>
.
2
e
e
e
Substrate electrode
former mode includes simultaneous measurements of both tip (iT) and substrate (is) currents. The kinetics of coupled chemical reactions in solution are probed by varying the tip-substrate distance while measuring iT and is. For an uncomplicated process (stable Red), the collection efficiency,
is!
iT,
is more than 0.99 if L (= d/a)is not very large (L ~ 2).162 Under these conditions, the tip-generated species predominantly diffuses to the larger substrate electrode rather than escaping from the tip-substrate gap. For a process with a coupled chemical reaction (unstable Red), the collection efficiency may be much less than unity, and important kinetic information can be extracted from the
is!
ir
dependence on the tip-substrate distance. The TG/SC mode is usually used in studies of homogeneous chemical reactions, allowing the determination of very fast homogeneous rate constants (in excess of 1 x 10⁸ M-1 S-I)I66 under steady-state conditions.quantitative model for the transient SGrrC response has been developedl64 and the method has been used to measure the lifetime of substrate-generated species. 163 This mode of operation is often simplest when the tip is a potentiometric sensor. Such a passive sensor does not consume analyte and disturbance to the concentration profile of electroactive species generated (or consumed) at the substrate is minimal. As with the feedback and TG/SC modes discussed above, the tip-substrate separation is a key experimental variable. The SGrrC mode can be used for monitoring many heterogeneous processes such as corrosionl42,169 and enzymatic reactions. 170,171 It is also useful for measurements of concentration profiles and fluxes of either electrochemically inactive species (e.g., alkali metal ions)I72 or species undergoing irreversible oxidation/reduction (e.g., glucose). 173
1.4 Scanning Electrochemical Microscopy as a Probe of Interfacial
Photochemical Processes
(b)
aQueous soIuliOn
conlalnlng 5 m ~F.(CNle IndO.1 M~
M
o. (.)
I
-Sile'" ~.ITOcompo
film or TiOz eIec lrode ~ ~
~MingH •• d
I
Narmcope III
y1
xZ I x CQntroller
I
I z Controller
1
~tenllo6tat
I
IUME PI see
r-
I III~ 1i1t·Stage
XY-Slage
l-S1agI
I
Steppero4TlQlorFigure 1.10 (a) Structure of the Ti02-ITO composite film. (b) Schematic diagram
ofthe experimental set-up. 176
supporting electrolyte. The schematic diagram of the experimental set-up, taken
from their work, is shown in Figure 1.10. They employed 30 J..lm and 3 f..UI1
diameter Pt-Ir UME tips as SEeM probes (located far away and in close vicinity
to the Ti02 film) to investigate the negative and positive feedback effects above
the Ti02 surface in the dark and under UV illumination, respectively. In the dark,
the microelectrode response is consistent with negative feedback behaviour: the
Ti02 surface acts as an insulating substrate. Under illumination, there was a small
decrease in the oxidation current at the UME when it was placed at a relatively
large distance above the Ti02 portion of the surface: ferrocyanide was
photooxidised by photogenerated holes, thereby decreasing the amount that could
be oxidised at the microelectrode. However, when it was placed very close to the
turning on the UV light, and that current increase became even larger when the exposed ITO portion was covered by epoxy resin. This current response behaviour is due to positive feedback: ferricyanide produced electrochemically at the UME is reduced back at the illuminated Ti02 surface by photogenerated electrons. This work demonstrated the utility of the SECM technique for studying the mechanisms of photocatalytic reactions on Ti02 surfaces by showing that both oxidation and reduction reactions can occur simultaneously on an illuminated Ti02 film.
In a recent report, Haram and Bardl77 have also demonstrated that SECM can be used to probe the kinetics of photoelectrochemical transfer reactions at semiconductor/solution interfaces. They employed a polycrystalline cadmium sulfide (CdS) thin film in contact with a solution containing methyl viologen radical cation (MV-+) as the redox mediator and triethanolamine (TEOA) as the hole scavenger. In the absence of illumination, SECM approach curves to CdS films deposited on glass showed negative feedback, as the substrate could not reduce tip generated MV2+, i.e., the film behaved as an insulator. However, upon illumination, MV2+ can be reduced to MV'" at the CdS surface by photogenerated electrons, resulting in an increase in current at the microelectrode, giving positive feedback. The amount of feedback was a measure of the rate of generation of ~. Apparent pseudo-first-order rate constants for the photoelectron transfer
reaction were estimated by fitting experimental approach curves to theory. A schematic of the experimental set-up used by Haram and Bard is shown in Figure 1.11.
Micro-tip
Plexig/oss box
with cell -;.; ... SEeM plaiform
~
~
Light source assembly
Figure 1.11 Schematic diagram of the experimental set-up used for photoelectron
transfer-SECM measurements. 177
photodegradation process~ using a potentiometric AgI AgCl UME positioned at
micrometer distances above a UV-ilIuminated Ti02 film. Experiments were
performed at several tip-substrate distances, and the concentration of chloride was
recorded as a function of time after turning on and turning off the UV irradiation.
A schematic diagram of the experimental set-up employed is given in Figure 1.12.
The measured quantum yield was in close agreement with that deduced for the
same reaction with the Ti02 suspended in solution.179 This suggests that, with the
experimental set-up adopted, light was not significantly shielded from the surface
by the probe. However, to confirm this, the authors proposed the use of a new
type of photoelectrochemical probe, developed by Smyrl et al.,141 in which the
surface was illuminated using an optical fibre surrounded by a ring UMB.
Smyrl and co_workers141.180 developed a new instrumental technique that
combines the characteristics of scanning electrochemical microscopy (SEeM) and
scanning photoelectrochemical microscopy (pEM).181 To combine both
connection to 3 ·axi.
poaltionar
nC\
filmSCE
glut .liclt
lIIumlMtor
eooo
Figure 1.12 Schematic diagram of the experimental arrangement employed to monitor
cr
close to the surface of a Ti02 film during photomineralisation. DVMand SCE denote digital voltmeter and saturated calomel electrode, respectively. 178
A
Polyimide (175 ~)
Gold
(ISS j.UJl)
Opdcal Fiber
B
Figure 1.13 Diagram of the gold-coated optical fibre used to study reactions at the surface of a TilTi02 substrate.180
(SPECM), an optical fibre coated with gold and encased in an outer polymer film
was used. The gold ring served as a microelectrode to carry out the
electrochemical reactions, while the core of the fibre acted as a local illumination
with a 50
A
oxide layer in an acidic KBr solution.180 Figure 1.13 shows a schematic of the gold coated optical fibre tip and the side view of the SPECM experiment. The resolution of the SPECM probe is largely a function of the size of the gold ring, the illumination spot size, and the probe/sample separation distance. By reducing the size of both the optical fibre and the concentric gold ring, it is possible to improve the spatial resolution. Improvements in the imaging capabilities of SPECM have been made by Shi et al., 182 who prepared optical fibre microelectrodes with a total tip diameter less than 5 ).1m.1.5 Aims
The general goal of this thesis is to use the SEeM technique to obtain a more detailed understanding of photoelectrochemical reactions occurring at supported Ti02 surfaces. A new SECM approach, involving both amperometric and potentiometric electrodes, has been developed and used to monitor interfacial photoprocesses with high spatial resolution.
Oxygen plays a key role in photomineralisation processes catalysed by illuminated Ti02. Thus, in chapter 4, a new approach to monitoring the photoelectrochemical reduction of oxygen was developed, in which the chronoamperometric behaviour for oxygen reduction was recorded after stepping the light flux at a Ti02 film on and off. The kinetics of the reduction process are interpreted through various theoretical models proposed in the literature.
It would be interesting to know if there is a link between the rate of oxygen consumption and the rate of product formation in the photomineralisation process sensitised by Ti02. Hence, in chapter 5, the Ti02 mediated photodegradation of a model pollutant, 4-chlorophenol, was studied. The generation of chloride ions during the photomineralisation process was monitored using a potentiometric microelectrode positioned very close to the Ti02 surface. The production of chloride ions was modelled using the Langmuir-Hinshelwood kinetic equation for heterogeneous catalytic processes.
References
1. A. Mills and S. Le Hunte, J. Photochem. Photobiol. A: Chern, 1997, 108, 1. 2. M. Schiavello (Ed.), Photocatalysis and Environment, Kluwer Academic Publishers, Dordrecht, 1988.
3. D. F. Ollis and H. AI-Ekabi (Eds.), Photocatalytic Purification and Treatment o/Water and Air, Elsevier, New York, 1993.
4. M. R. Hoffmann, S. T. Martin, W. Choi and D.W. Bahnemann, Chem. Rev.,
1995, 95, 69.
5. D. F. Ollis,
C.
R Acad Sci. Paris, Serie JIC, Chimie / Chemistry, 2000, 3, 405. 6. A. Fujishima, T. N. Rao and D. A. Tryk, J. Photochem. Photobiol. C:Photochem. Rev., 2000, 1, 1.
7. A. Fujishima, K. Hashimoto and T. Watanabe, TiO] Photocatalysis: Fundamentals and Applications, BKC, Tokyo, 1999.
8. A. Heller, Acc. Chem. Res., 1995,28,503.
9. D. A. Tryk, A. Fujishima and K. Honda, Electrochim. Acta, 2000, 45, 2363. 10. A. Mills and S.-K. Lee, J. Photochem. Photobiol. A: Chern, 2002, 152,233. 11. A. L. Linsebigler, G. Lu and J. T. Yates Jr., Chern. Rev., 1995,95, 735.
12. M. A. Fox and M. T. Dulay, Chern. Rev., 1993,93,341.
13. N. Serpone, D. Lawless, R. Terzian and D. Meisel in Electrochemistry in Colloids and Dispersions, R. A. Mackay and J. Texter (Eds), VCH Publishers, Inc., New York, 1992, p399.
14. R. W. Matthews,J. Catal., 1988, 113,549.
15. H. Gerischer in Photocatalytic Purification and Treatment o/Water and Air,
17. T. Watanabe, A. Fujishima, O. Tatsuoki and K. Honda, Bull. Chem. Soc. Jpn.,
1976,49,8.
18. E. Pelizzetti, C. Minero and V. Maurino, Adv. Colloid Interface Sci., 1990,32, 271.
19. P. V. Kamat, Chem. Rev., 1993,93,267.
20. A. Mills, R. H. Davies and D. Worsley, Chern. Soc. Rev., 1993,22,417. 21. J. M. Herrmann, C. Guillard and P. Piehat, Catal. Today, 1993, 17, 7. 22. J. C. Ireland, P. Klostermann, E. W. Rice and R. M. Clark, Appl. Environ. Microbial., 1993, 59, 1668.
23. J. C. Sjogren and R. A. Sierka, Appl. Environ. Microbiol., 1994, 60, 344. 24. R. X. Cai, Y. Kubota, T. Shuin, H. Sakai, K. Hashimoto and A. Fujishima,
Cancer Res., 1992, 52,2346.
25. R. Cai, K Hashimoto, Y. Kubota and A. Fujishima, Chem Lett., 1992, 427. 26. K. Suzuki in Photocatalytic Purification and Treatment a/Water and Air, D.
F. Ollis and H. Al-Ekabi (Eds.), Elsevier, New York, 1993.
27. K E. Karakitsou and X. E. Verykios, J. Phys. Chem., 1993,97, 1184. 28. M. Gr4tzel, Ace. Chem. Res., 1981, 14,376.
29. D. Duonghong, E. Borgarello and M. Gr4tzel, J. Am. Chem. Soc., 1981, 103, 4685.
30. E. Borgarello, J. Kiwi, E. Pelizzetti, M. Visea and M. Gmtzel, Nature, 1981,
289, 158.
31. M. Khan, D. Chatterjee, M. Krishnaratnam and M. Bala, J. Mol. Calal., 1992,
72,13.
34. H. Gerischer and A. Heller,
J.
Electrochem. Soc., 1992, 139, 113.35. N. B. Jackson, C. M. Wang, Z. Luo, J. Schwitzgebel, J. G. Ekerdt, J. R. Brock and A. Heller, J. Electrochern. Soc., 1991, 138,3660.
36. M. Nair, Z. H. Luo and A. Heller,Ind Eng. Chern. Res., 1993, 32, 2318. 37. A. MiUs and 1. Wang, J. Photochern. Photohio/. A: Chern., 1998, 118,53. 38. J. K. Burdett, T. Hughbands, 1. M. Gordon, J. W. Richardson Jr. and J. V. Smith, J. Arn. Chern. Soc., 1987, 109,3639.
39. A. Fahmi, C. Minot, B. Silvi and M. Causa, Phys. Rev. B, 1993,47, 11717. 40. K. Tanaka, M. F. V. Capule and T. Hisanaga, Chern. Phys. Lett.,
1991, 187,
73.41. K-M. Schindler and M. J. Kunst, J. Phys. Chern., 1990, 94,8222. 42. J. Augustynsky, E/ectrochirn. Acta, 1993, 38, 43.
43. A. Fujishima and T. N. Rao, Proc. Indian Acad Sci. (Chern. Sci.), 1997, 109, 471.
44. I. Sopyan, M. Watanabe, S. Murasawa,
K
Hashimoto and A. Fujishima, J. Photochern. Photohio/. A: Chern, 1996,98, 79.45. N. Negishi, T. Iyoda, K. Hashimoto and A. Fujishima, Chern. Lett., 1995, 841. 46. H. Matsubara, M. Takada, S. Koyama, K. Hashimoto and A. Fujishima,
Chern. Lett., 1995, 767.
47. Y. Kikuchi, K. Sunada, T. Iyoda, K. Hashimoto and A. Fujishima, J.
Photochem. Photohiol. A: Chern, 1997, 106,51.
48. I. Sopyan, S. Murasawa, K. Hashimoto and A. Fujishima, Chern. Lett., 1994,
723.
49. S. T. Martin, H. Herrmann, W. Choi and M. R. Hoffmann, Trans. Faraday
50. S. T. Martin, H. Hemnann and M. R. Hoffmann, Trans. Faraday Soc., 1994,
90,3323.
51. C. Minero, F. Catozzo and E. Pelizzetti, Langmuir, 1992, 8,481.
52. K. Okamoto, Y. Yamamoto,
H.
Tanaka, M. Tanaka, Bull. Chem. Soc. lpn.,1985,58,2015.
53. E. Pelizzetti and C. Minero, E/ectrochim. Acta, 1993, 38, 47.
54. H. Sakai, R. Baba, K. Hashimoto, A. Fujishima and A. Heller, J. Phys. Chem.,
1995,99, 11896.
55. V. Augugliaro,
1.
Palmisano,A.
Sclafani, C. Minero and E. Pelizzetti,Toxico!. Environ. Chem., 1988, 16,89.
56. C. S. TurchiandD. F. Ollis,J. Cala!., 1989,119,480. 57. C. S. Turchi and D. F. Ollis, l. Cala!., 1990, 122, 178.
58. R. Terzian, N. Serpone, R. B. Draper, M. A. Fox and E. Pelizzetti, Langmuir,
1991, 7, 3081.
59. D. Lawless, N. Serpone and D. Meisel, J. Phys. Chem., 1991,95,5166. 60. G. Mills and M. R. Hoffmann, Environ. Sci. Techno/., 1993,27, 1681. 61. R.
B.
Draper and M. A. Fox, Langmuir, 1990,6, 1396.62. Y. Mao, C. Schoneich and K. D. Asmus, J. Phys. Chem., 1991,95,80.
63. E. R. Carraway, A. J. Hoffmann and M. R. Hoffmann, Environ. Sci. Technol.,
1994,28, 786.
64.1.
Cermenati, P. Pichat, C. Guillard and A. Albini, J. Phys. Chem. B, 1997,101,2650.
65. O. d'Hennezel, P. Pichat and D. F. Ollis, J. Photochem. Photohiol. A: Chern,
66. K. Ishibashi, A. Fujishima, T. Watanabe and K. Hashimoto, J. Photochern. Photobiol. A: Chern, 2000, 134, 139.
67. X. Li,
J.
W. Cubbage and W. S. Jenks, J. Photochern. Photobiol. A: Chern, 2001, 143,69.68. J. M. Kesselman, O. Weres, N. S. Lewis and M. R. Hoffmann, J. Phys. Chern.
B, 1997, 101,2637.
69. S. Goldstein, G. Czapski and J. J. Rabani, J. Phys. Chern., 1994,98,6586. 70. L. Sun and
J.
R. Bolton, J. Phys. Chern., 1996, 100,4127.71. H. Gerischer and A. Heller, J. Electrochern. Soc., 1992, 139, 113.
72. C. M. Wang, A. Heller and H. Gerischer, J. Am. Chern. Soc., 1992, 114,5230.
73. H. Gerischer and A. Heller, J. Phys. Chern., 1991,95,5261.
74. J. M. Kesselman, G. A. Shreve, M. R. Hoffmann and N. S. Lewis, J. Phys.
Chem., 1994,98, 13385.
75. J. Schwitzgebel, J. G. Ekerdt, H. Gerischer and A. Heller, J. Phys. Chem., 1995, 99, 5633.
76. K. Ikeda, H. Sakai, R. Baba, K. Hashimoto and A. Fujishima, J. Phys. Chem.
B,1997, 101,2617.
77. K. Vinodgopal, U. Stafford, K. A. Gray and P. V. Kamat,
J.
Phys. Chem.,1994,98,6797.
78. U. Stafford, K. A. Gray, P.
V.
Kamat and A. Varma, Chern. Phys. Lett., 1993, 205,55.79. K. A. Gray, U. Stafford, M. S. Dieckmann and P. V. Kamat in Photocatalytic
Purification and Treatment o/Water and Air, D. F. Ollis and H. AI-Ekabi (Eds.), Elsevier, New York, 1993, p 455.
81. B. SifIert and J. M. Metzger, Colloids Surf, 1991, 53, 79.
82. J. Sabate, M. A. Anderson, M. A. Aguado, J. Guminez, S. Cervera-March and C. G. Hill,1. Mol. Catal., 1992, 71,57.
83. T. L. Rose and C. Nanjundiah,J. Phys. Chem., 1985, 89,3766.
84. G. T. Brown and J. R. Darwent,1. Phys. Chem., 1984, 88,4855.
85. P. Pichat, M.-N. Mozzanega, J. Disdier and J.-M. Herrmann, Nouv. J. Chim.,
1982, 11,559.
86. N. R. Blake and G. L. Griffin,1. Phys. Chern., 1988,92,5697.
87. A. Hong, M. E. Zappi, C. H. Kuo and D. Hill,1. Environ. Eng., 1996, 122,58.
88. J. C. Crittenden,
Y.
Zhang, D. W. Hand and D. L. Perram, Water Environ. Res., 1996,68,270.89. L. Rideh, A. Wehrer, D. Ronze and A. Zoulalian, CataJ. Today, 1999,48,357.
90. C. Minero, Catal. Today, 1999, 54, 205.
91. H. T. Chang, N.-M. Wu and F. Zhu, Water Res., 2000, 34,407.
92. R. Terzian, N. Serpone, C. Minero and E. Pelizzetti,1. Catal., 1991, 128,352.
93. J. Cunningham and P. Sedlak,1. Photochern. Photohiol. A: Chern., 1994, 77,
255.
94. J.-C. D' Oliveira, G. AI-Sayyed and P. Pichat,1. Environ. Sci. Technol., 1990,
24,990.
95. M. Bideau, B. Claudel, C. Dubien, L. Faure and H. Kazouan,1. Photochern. Photo bioi. A: Chem., 1995, 91, 137.
96. C. S. Turchi and D. F. Ollis,1. Phys. Chern., 1988, 92, 6852.
98. S. Ahmed, T. 1. Kemp and P. R. Unwin,1. Photochern. Photobiol. A: Chern.,
2001, 141,69.
99. 1. G. Sczechowski, C. A. Koval and R. D. Noble, J. Photochern. Photobiol. A: Chern., 1993, 74, 273.
100. N. S. Foster, C. A. Koval, J. G. Sczechowski and R. D. Noble, J.
Electroanal. Chern., 1996,406,213.
101. K. J. Buechler, C. H. Nam, T. M. Zawistowski, R. D. Noble and C. A. Koval,
Ind Eng. Chern. Res., 1999,38, 1258.
102. 1. G. Sczechowski, C. A. Koval and R. D. Noble in Photocatalytic
Purification and Treatment o/Water and Air, D. F. Ollis and H. AI-Ekabi (Eds.), Elsevier, New York, 1993.
103. S. Upadhya and D. F. Ollis, J. Phys. Chern. B, 1997, 101,2625.
104. K. J. Buechler, T. M. Zawistowski, R. D. Noble and C. A. Koval,Ind Eng. Chern. Res., 2001,40, 1097.
105. C. 1. G. Cornu, A. J. Colussi and M. R. Hoffmann, J. Phys. Chern. B,2001,
105, 1351.
106. M. GIttzel and A. J. Frank,.!. Phys. Chern., 1982, 86,2964.
107. G. T. Brown, 1. R. Darwent and P. D. I. Fletcher, J. Arn. Chern. Soc., 1985,
107,6446.
108. J. R. Darwent,.!. Chern. Soc., Faraday Trans. 1,1984,80, 183.
109. D. Duonghong, J. Ramsden and M. Gratzel,.!. Arn. Chern. Soc., 1982, 104, 2977.
110. J. Moser and M. Gratzel,.!. Arn. Chern. Soc., 1983, 105,6547.