Laura van ’t Hul
S1233203
Enschede, June 2017
FACULTY OF BEHAVIOURAL, MANAGEMENT AND SOCIAL SCIENCES
MASTER EDUCATIONAL SCIENCE AND TECHNOLOGY
EXAMINATION COMMITTEE Dr. M.D. Endedijk
Dr. M. Groenier University of Twente
Master thesis
WHO AM I AS A TECHNICAL PHYSICIAN?
THE PROFESSIONAL IDENTITY OF
YOUNG PROFESSIONALS IN AN
EMERGING FIELD
Contents
SUMMARY 4
CHAPTER 1 PROBLEM STATEMENT 5
CHAPTER 2 THEORETICAL FRAMEWORK 7
2.1 Professional identity 7
2.2 Professional identity in an emerging professional field 8
2.2.1. Content of professional identity 9
2.2.2. Strength of professional identity 10
2.3 Importance of professional identity for career choices and development 10
2.3.1. Career clarity 11
2.3.2. Career exploration 12
2.3.3. Professional role confidence 12
2.4 Research questions 13
CHAPTER 3 METHOD 14
3.1 Research design 14
3.2 Sample 14
3.3 Instrumentation 15
3.4 Procedure 17
3.5 Instrument validation 17
3.5.1. Exploratory factor analyses 18
3.5.2. Confirmatory factor analysis 20
3.5.3. Inspecting strength of professional identity and professional role confidence 21
3.6 Data analysis 22
CHAPTER 4 RESULTS 24
4.1 Descriptive statistics 24
4.2 RQ1 – What are variations in TM students’ PI and how are these related to study
phase? 26
4.2.1 RQ1a – What profiles can be deduced to describe variations in the PI content of
TM students? 26
4.2.2 RQ1b – What is the relationship between TM students’ PI content and strength? 28 4.2.3 RQ1c – What are differences in TM students’ PI content across different study
phases? 29
4.2.4 RQ1d – What is the relationship between TM students’ study phase and their PI
strength? 30
4.3 RQ2 – What is the relationship between TM students’ study phase and their intended
career choice and career development? 32
4.4 RQ3 – How is the relationship between TM students’ PI and their intended career
choice and career development? 35
4.4.1 RQ3a – To what extent can differences in TM students’ intended career choice and
career development be explained by their PI content? 35
4.4.2 RQ3b – How is the relationship between TM students’ PI strength and their
intended career choice and career development? 37
CHAPTER 5 CONCLUSION 41
CHAPTER 6 DISCUSSION 42
6.1 Goal 1 – understanding variations in PI content and strength of TM students in relation
6.2 Goal 2 – relating TM students’ study phase to their intended career choice and career
development 44
6.3 Goal 3 – relating TM student’s content and strength of PI to their intended career
choice and career development 45
6.4 Methodological strengths and weaknesses 46
6.5 Practical implications 47
6.6 Final conclusion 48
References 49
Appendix A – Added items for Technical Medicine students 53
Appendix B – Factors within the domain of interests 54
Appendix C – Factors within the domain of competences 55
Appendix D – Factors within the domain of values & goals 57
Appendix E – Factors within the domain of personality 58
Appendix F – Factors within the construct of strength of PI, career clarity and exploration,
and perceived role confidence 59
Appendix G – New factors for the constructs of PI strength and professional role
confidence 60
SUMMARY
In response to today’s more complex and non-traditional problems, new professions emerge. One of such emerging professions is the Technical Physician (TP). In the study program Technical Medicine (TM), students are educated to become a TP who is the intermediary between physicians and engineers. For TM students it is potentially more difficult to develop a professional identity (PI) as there is no clear group information or stereotype to identify with. PI is the view individuals hold of who they are as professional which likely predicts persistence. Currently it is poorly understood how students learning for an emerging profession develop their PI and how this affects their perception on their career. Therefore, this study filled the literature gap by investigating what the PI of TM students in an emerging profession entails, how this varied across study phase and how PI affected students’ intended career choice, career clarity, exploration and confidence.
In total 397 TM students (64% response) participated in the online survey, which consisted of validated scales on five domains of PI (interests, professional goals, values, competences and personality), strength of identification with the role of TP, intended career choice, career clarity, exploration and confidence in a successful career as a TP. Five profiles of PI were identified by means of cluster analysis: the individualist, engineer, all-rounder, security seeker and status driven TM student. The distribution of the profiles differed per study phase as there were more status driven students in the bachelor, and more engineers in the master. Furthermore, the profiles differed in their strength of identification with the role of TP, intended career choice, and career development. The all-rounder, who scored high on medical and technical competences, identified strongest with the profession, had the highest career clarity and was most confident. All profiles were most likely to work as medical specialist, however master students showed the lowest intention. Furthermore, identification and confidence was lower in the end of the bachelor and master, when they had to choose a master or experienced their first internships.
This study showed that TM students have different views of who they are as a TP. Furthermore, the more stereotypical students are most confident in their career and most likely to opt for a career as medical specialist or researcher. Acknowledging diversity amongst TM students and providing personalised support in development of self-clarity and –confidence will be beneficial. Especially during internships, students are less confident in their ability to become a successful professional which might be a result of the absence of TP in role models in clinical practice to identify with. Supporting students in these critical moments and providing students with role models, and also less-stereotypical ones, will facilitate the development of a fitting PI.
CHAPTER 1
PROBLEM STATEMENT
As today’s problems are of a more complex and non-traditional nature, new areas of expertise arise which are placed on the intersection of traditional fields of expertise (Palonen, Boshuizen, & Lehtinen, 2014). Especially within health care, bridging boundaries between professions can directly impact patient outcomes and decrease medical mistakes made due to a lack of interdisciplinary collaboration (Fewster-Thuente & Velsor-Friedrich, 2008). In response to this need, new specialised professions emerge from the integration of related fields that result into an entirely new research area and knowledge production (Palonen et al., 2014).
One of such new fields of expertise is Technical Medicine (TM). In 2003, the University of Twente (UT) started the study of TM in response to the growing need for interdisciplinary professionals who have the expertise to bridge the field of classic medicine and complex technology (University of Twente, 2016). Students are educated to become a Technical Physician (TP) who is the intermediary between the practice of physicians and the scientific world of the engineers (Miedema, 2015). The practice of TPs should be embedded in direct patient care (Miedema, 2015). According to Janssen, Wallenburg, and de Bont (2016) the emergence of new professions causes boundaries between professions to be fading and results in the need for redistribution of tasks and responsibilities. Carving out a position takes effort for new professionals in a healthcare setting where vested professionals with pre-existing identities will likely protect the boundary of their profession. Just like the physician-scientist, TM students must generate a professional niche in which values and skills from medicine and TM complement each other rather than compete with each other (Rosenblum, Kluijtmans, & ten Cate, 2016). From the beginning of their study program TM students are challenged with this highly demanding task of creating a niche, which is first experienced during internships. In the ideal situation, TM students persist their career as a TP and are confident to gain their position next to physicians and biomedical engineers.
Developing a realistic idea of the role expectations of an emerging profession is more difficult when there is no clear group information or stereotype to identify with (Van Veelen, Otten, & Hansen, 2013). The process of identification is important because it is the process through which individuals come to define themselves, also as professional (Ashforth, Harrison, & Corley, 2008). Professional identity (PI) is the view individuals hold of who they are as professional (Slay & Smith, 2011). Students who are confident in their ability to fulfil the expected identity features of a TP will likely be more successful in crafting a job (Cech, Rubineau, Silbey, & Seron, 2011). PI is commonly described a key predictor of career sustainability (Rosenblum et al., 2016) and workers’ decision to leave the profession (e.g. Hong, 2010). Yet, PI development of emerging professional roles in healthcare is poorly understood (Rosenblum et al., 2016). Only few studies have attempted to broaden understanding of PI development amongst students being educated for new occupation that bridges two professions (e.g. Rosenblum et al., 2016). Current research has focused either on medical students (e.g. Adams et al., 2006) or technical students (e.g. Pierrakos et al., 2009) learning for long-established professions. Therefore, this study aims to understand PI development of TM students. By doing so, this study will provide new theoretical implications and key points for improving education and student counselling in emerging professions.
professional. The study program of TM outlines doing a PhD or fellowship as ideal career path for a graduated TM student to become a successful member of the profession (Miedema, 2015). However, we know that students who do not identify with stereotypical features of the profession are more likely to leave the profession (Cheryan, Siy, Vichayapai, Drury, & Kim, 2011). It is unclear how identification with the profession predicts the chosen career path in the context of an emerging field where stereotypical features of the profession are unclear.
CHAPTER 2
THEORETICAL FRAMEWORK
In this chapter, the understanding of professional identity (PI) of TM students will be broadened. First, the concept of PI will be discussed and how it can be approached from different theoretical perspectives. Second, the current understanding PI in an emerging professional field is outlined. Third, the importance of PI for the career choices and career development of students is discussed. Lastly, research questions and model are presented.
2.1 Professional identity
Individuals engage in developing a firm identity and finding their own place in society across their entire lifespan (Crocetti, Avanzi, Hawk, Franco, & Meeus, 2014). An individual’s identity is a self-perception that provides answers to questions such as ‘Who am I?’ or ‘Who are we?’(Ashforth et al., 2008). The answer to this question is complex, since an individual holds multiple self-definitions that are related to several domains of life (Crocetti et al., 2014). One way individuals can define themselves is in their professional role, which is used to understand their meaning and purpose in life (Caza & Creary, 2016). As a core domain of identity, professional identity (PI) is the view individuals hold of who they are as a professional (Slay & Smith, 2011). There are various disciplines studying identity that disagree if PI is a social or personal construct, or an integration both.
According to theorists from the social perspective, people categorise themselves and others to order their social environment and place themselves and others within it (Ashforth, 2001). Individuals develop a sense of who they are by assuming prototypical or exemplar characteristics of the group as their own (Ashforth, 2001). As such, theorists focusing on the social aspects of PI define it as “the degree to which employees identify themselves with the profession that they practice and its typical characteristics” (Bartels, Peters, Jong, Pruyn, & Molen, 2010; p. 211). From this perspective, PI is a rather unstable and complex unity that is developed over time and is determined by the context of the individual (Clarke, Hyde, & Drennan, 2013). Taken together, from a social perspective, people develop their PI through interactions with their social environment and integrate prototypical values and behaviours of the profession as their own, which differentiates them from other professions.
have been incorporated into the former PI (Ibarra et al., 1999). Overall, from a personal perspective PI is one’s relatively stable self-characterisation of who he or she is as professional.
Both theoretical approaches can be criticised for being incomplete since identities are inevitably both personal and social (Luyckx, 2011), which calls for the need to integrate both. Crocetti et al. (2014) clarify that from the social perspective, identity consists of the strength of identification with the profession, whereas the personal perspective refers to one’s awareness and self-characterisation as professional. Overall, theorists from both perspectives agree that individuals are continuously defining themselves as professional as a result of social interaction and new experiences. In this study PI is defined as the “continuous process of incorporating distinctive professional attitudes and values into the self-identity, according to which individuals will behave in their professional role”(adapted from, Caza and Creary, 2016).
2.2 Professional identity in an emerging professional field
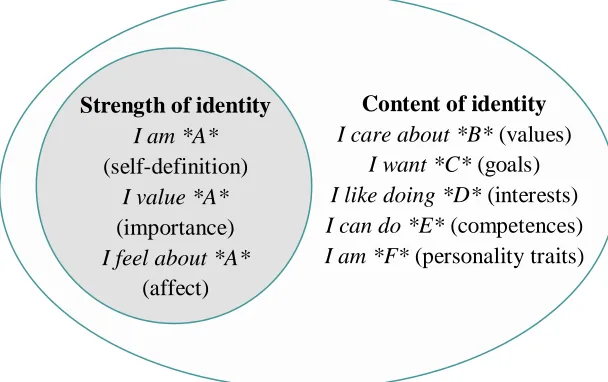
in this case TP. Strength of identity is the degree to which one has committed to these components of PI content and has accepted these as one’s own. The following paragraphs are an elaboration of these concepts and a discussion of the PI of TM students.
Figure 1. Model of professional identity (adapted from Ashforth et al., 2008).
2.2.1. Content of professional identity
The content of identity is composed of values, goals, beliefs, competences and stereotypical traits (Ashforth et al., 2008). In terms of PI content, TM strongly focuses on the development of competencies that need to be acquired in order to become a TP. Miedema (2015) describes expected competences ranging from research and design related competences to clinical competences such as patient contact, working in multidisciplinary teams and performing technical medical procedures. Students are taught to become aware of their own behaviour in relation to him- or herself, patients, colleagues and tasks. Through reflection students are expected to signal shortcomings in their knowledge and skills and as such become life-long learners (Miedema, 2015). This study provides insight into the variations in TM students’ PI by examining the various components (values, goals, interests, competences and personality traits) of PI content.
The majority of current research has taken a qualitative approach to study PI content in the context of higher education (Trede, Macklin, & Bridges, 2011). Therefore,Möwes (2016) developed a quantitative instrument to measure the PI content of Science, Technology, Engineering and Mathematics (STEM) students. Five domains of PI (personality, values, goals, competencies, and interests) were measured which resulted into five profiles of STEM students (Möwes, Van Veelen, & Endedijk, 2017). First, the nerd STEM student is conscientious, rational, honest and values intellectual challenge. The nerd student is a is a highly skilled researcher and is very analytical. The einzelgänger is introvert, compliant, does not value status in life and shows low self-assessment of skills. The security seeker is conscientious, conservative, emotional and values structure and routine in life. The all-rounder is open-minded, passionate and has good design, team and management skills. They value contributing to a greater goal and value physical health and autonomy. Lastly, the status seeker is an extravert and rational STEM student who values money and power but not family life. They have strong management and communication skills, but are not a team player or researcher.
`
Strength of identity
I am *A*
(self-definition)
I value *A*
(importance)
I feel about *A*
(affect)
Content of identity
I care about *B* (values)
I want *C* (goals)
I like doing *D* (interests)
I can do *E* (competences)
These results show that great variety exists in the PI content of young STEM professionals. In this study, the PI content of TM students will be examined which will also result into a classification of profiles. It is expected that among TM students there will be a nerd profile, representing the TM student that has more affinity with technology than medicine. Moreover, an all-rounder is expected that encompasses both technical and medical identity features and a medical type is expected that has more affinity with medicine than technology.
2.2.2. Strength of professional identity
The strength of identification is the extent to which an individual feels committed to the profession (Ellemers, Kortekaas, & Ouwerkerk, 1999). On the one hand, PI strength is a sense of emotional involvement with and attachment to the profession (Bergami & Bagozzi, 2000). On the other hand, PI strength also involves awareness of one’s membership of a profession and viewing the professional role as self-defining (Ashforth et al., 2008, as cited in Bergami & Bagozzi, 2000). Based on previous research, it is expected that the further the student is in acquiring the knowledge and skills of the profession, the more likely one will identify with the future profession. For instance, students that are at the beginning of their study will identify less strongly as a result of limited meaningful exposure and experiences with their profession (Pierrakos et al., 2009). In the long-established professions, students find an appropriate identity as professional through interaction with role models at the actual working environment (Adams et al., 2006). In case of TM, only a few graduated students have achieved a prototypical position as clinician within a hospital who might serve as role models for students to identify with.
Content and strength are related, such that the more someone embodies the attributes of a profession as one’s own, the more prototypical one is. Strongly identifying thus makes one become a prototype of the profession (Ashforth et al., 2008). Cheryan et al. (2011) explain that students who identify less with the profession will believe themselves to be less likely to possess traits that more stereotypical fellow students do have. Students may feel dissimilar and as a result get discouraged and feel less confident about succeeding in their professional field (Cheryan et al., 2011). Research of Möwes (2016) supported of this theoretical assumption. She found out that the more stereotypical STEM students (male and engineering study program) identified stronger with a profession in the technical sector and were more likely to pursue a technical career. To sum up, profiles high on strength are regarded as more prototypical. To conclude, this study investigates PI strength of TM students, and its relation with PI content to understand which PI profiles of TM students are more prototypical. In addition, this study will examine how the PI of TM students varies across study phase to understand how students learning for an emerging profession develop their PI.
2.3 Importance of professional identity for career choices and development
Chetkovich (2003) showed that public policy students who have the desire to have impact will opt for a career in the public sector, whereas students that seek financial security and professional development will be attracted to the private sector. For example, TM students who value status and want to be a leader presumably will opt for a career as TP in a company instead of a hospital. Also with regard to PI strength, students that feel less committed to the profession of TP might opt for an alternative career context or job type but not necessarily leave the profession. This was confirmed by research of Möwes (2016) which showed that STEM students with high PI strength were more inclined to aim for a career in a technical context. Currently, little is known about how PI affects students intended career choices. Moreover, the importance of PI for career success and persistence has been researched for students learning for long-establishedprofessions, such as engineering (e.g. Cech et al., 2011) or teaching (e.g. Hong, 2010) but not yet for emerging professions as TM. Therefore, this study aims to increase understanding of how PI affects intended career choices, this is done by examining this relationship in an explorative manner.
PI can be used to predict concrete career choices, but is also likely related to students’ degree of career development. Career development is the “ongoing process of planning and directed action toward personal work and life goals” (Simonsen, 1997, as cited in Mcdonald & Hite, 2005, p. 422). Significant career development takes place during adolescence which is characterised by developing awareness of vocational interests and engaging in career-related tasks, such as planning and reflecting on one’s future career (Rogers & Creed, 2011). Students’ engagement in career development processes will naturally increase as they progress through their study program. As students move closer to finishing their study, they will be more interested in and feel the necessity of exploring career options (Rogers, Creed, & Ian Glendon, 2008). In this study the multifaceted concept of career development is defined as an individuals’ consideration of career options (exploration), self-knowledge about occupational goals and interests (clarity) and self-confidence in one’s ability to become successful in the profession (professional role confidence). In the following paragraphs the importance of PI for career development is outlined, also the interrelatedness between concepts is discussed.
2.3.1. Career clarity
2.3.2. Career exploration
To start with, the relation between PI and career clarity is likely intertwined with career exploration. Dehing et al. (2013) argue that having a clear picture of one’s career is the result of gathering information about a profession. It is especially important that students develop a clear image of their goals, values, interests and competences in order to make fitting career choices. Also exploring career options helps individuals to learn what different career paths imply or require (Werbel, 2000). Aschbacher, Li and Roth (2010) argue that part of career exploration is concerned with talking to others about different career options and an individuals’ career interests. The interaction of students with people in their environment, such as family, peers, and teachers, plays a considerable role in boosting students’ interests in the profession and eagerness to pursue a career in the field. In case of TM, students learn through such interactions what being a TP entails and if they are capable to, and want to, persist as a TP. So, students weigh their own identity as professional against the reaction of peers (Aschbacher et al., 2010). To sum up, it is expected that exploration of career options and discussing with others will increase clarity in students’ career goals. As such, it is expected that exploration can explain the relation between students’ PI and their career clarity. For example, students with a weak PI as TP might still develop career clarity through exploring alternative career options.
2.3.3. Professional role confidence
Lastly, the concept of professional role confidence is discussed as important element of career development. This concept was introduced by Cech et al. (2011; p. 642) referring to “individuals’ confidence in their ability to fulfil the expected roles, competencies, and identity features of a successful member of their profession”. Becoming a successful professional is not just about mastering a professions’ intellectual skills, but also about developing confidence and commitment to the profession. A lack of this confidence contributes to students leaving their work field (Cech et al., 2011). Therefore, it is especially important that TM students develop the confidence that they can become successful in creating their position between the vested professionals. A strong and clear PI is necessary to become successful as professional because it will determine one’s behaviour in the work place (Caza & Creary, 2016). Cech et al. (2011) argue that students with a strong PI have internalised self-defining attributes that correspond to the professional role of TP which will likely increase their confidence that the profession fits them. For this reason, it is expected that students with a strong PI are more confident that they possess the knowledge and master the competences required of a TP. Also students with a strong PI will be more confident that they can be successful in their career and actually get a satisfying job as TP. In turn, it is expected that students with more confidence will show higher levels of career clarity.
2.4 Research questions
This study aims to answer the following main question:
• What is the relationship between TM students’ PI and their intended career choice and career development, and how is this influenced by study phase?
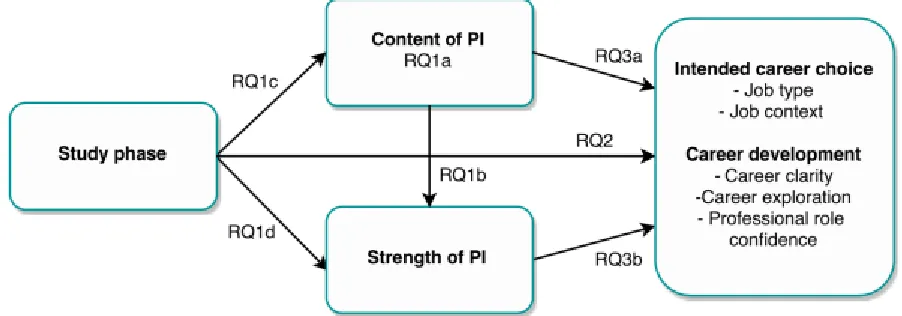
In order to answer the main question, the following sub questions were drawn (see Figure 2):
• RQ1 – What are variations in TM students’ PI and how are these related to study phase? • RQ1a – What profiles can be deduced to describe variations in the PI content of
TM students?
• RQ1b –What is the relationship between TM students’ PI content and strength? • RQ1c – What are differences in TM students’ PI content across different study
phases?
• RQ1d – What is the relation between TM students’ study phase and their PI strength?
• RQ2 – What is the relationship between TM students’ study phase and their intended career choice and career development?
• RQ3 – How is the relationship between TM students’ PI and their intended career choice and career development?
• RQ3a – To what extent can differences in TM students’ intended career choice and career development be explained by their PI content?
[image:13.595.71.522.486.644.2]• RQ3b – How is the relationship between TM students’ PI strength and their intended career choice and career development?
CHAPTER 3
METHOD
3.1 Research design
The nature of this study is explorative as the aim is to gain new insights into the underexposed topic of PI development of students in emerging professions. A cross-sectional design was used in the form of an online survey. This design fits the explorative nature of this study because cross-sectional research usually aims to describe a population with respect to a certain subject without necessarily having hypotheses beforehand (Levin, 2006). Also a major advantage of a cross-sectional approach is that data can be collected from a large population in a relatively short period of time (Babbie, 2013).
3.2 Sample
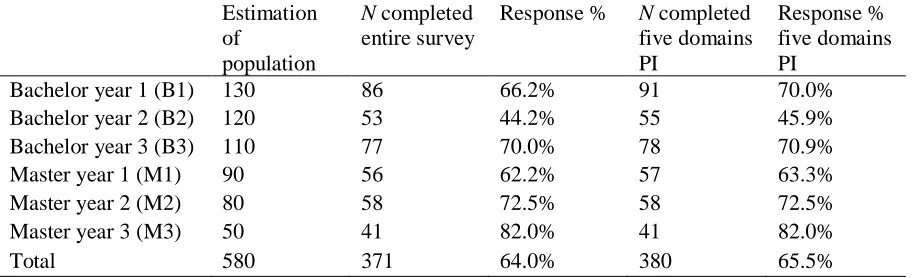
[image:14.595.73.531.586.725.2]The population of this study were TM students enrolled in the year bachelor and three-year master program at the UT. The study of TM is currently only offered at the UT and Delft University of Technology (TU Delft). However, TM students of the TU Delft were excluded from participation as Delft only offers a bachelor and is still developing its master program. The respondents were thus purposively selected as this study is specifically interested in the PI of TM students studying at the UT (Babbie, 2013). The total sample size consisted of 580 students that were all invited to participate in this study. A total of 407 students started the survey of which 371 respondents completed the entire survey, with a total response rate of 64.0%. Nine respondents did not complete the entire survey, but did complete the first section of the survey measuring the five domains of PI content. These respondents were included in the Explanatory Factor Analysis (EFA) for the five domains. A total of 27 students did start the survey, however did not finish of which the majority was female (N = 17) and bachelor student (N = 20). These participants did not the finish all five domains of PI needed for EFA and were therefore deleted case wise. In Table 1, response rate per study phase can be found. The mean age of the respondents was 21.0 (SD = 2.39), ranging from 17 to 29. Of the respondents, 32.6% was male and 67.4% was female which is only a small deviation from the male/female distribution of the population which is estimated at 40/60%.
Table 1
Number of respondents and response percentage per study phase
Estimation of
population
N completed entire survey
Response % N completed five domains PI
Response % five domains PI
Bachelor year 1 (B1) 130 86 66.2% 91 70.0%
Bachelor year 2 (B2) 120 53 44.2% 55 45.9%
Bachelor year 3 (B3) 110 77 70.0% 78 70.9%
Master year 1 (M1) 90 56 62.2% 57 63.3%
Master year 2 (M2) 80 58 72.5% 58 72.5%
Master year 3 (M3) 50 41 82.0% 41 82.0%
3.3 Instrumentation
An instrument developed by Möwes (2016) was used for this study. This instrument, the Career Compass (CC), was developed to measure content and strength of STEM students PI.
Study phase. Participants were asked of in what phase of their bachelor (options: B1,
B2, B3) or master (M1, M2, M3) they were. Students with study delay were asked to click the phase of which they attended the most study units.
Content of professional identity. The CC measures five domains of PI; interests,
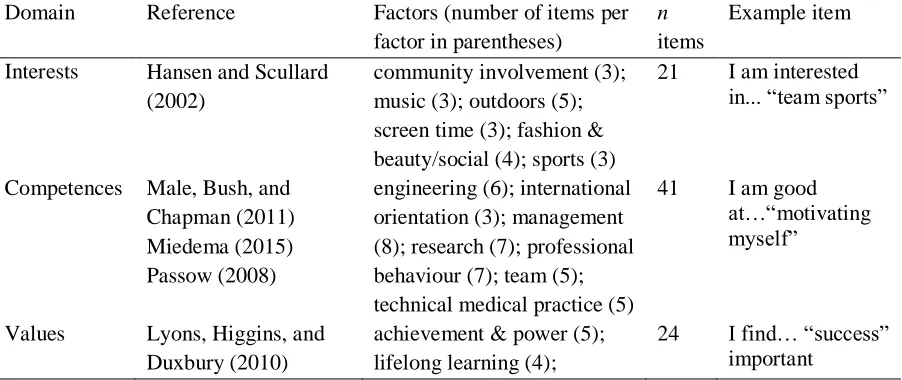
[image:15.595.74.525.568.758.2]competences, values, personality and goals. These domains are literature based and have been validated amongst both STEM-students (Möwes, 2016) and employees in engineering (ten Berg, 2016). Since the CC was originally developed to measure PI of engineers, four steps were taken to adapt the domain of competences for the current study amongst TM students. First, specific TM competences were derived from the competence profile of the TM professional published by Miedema (2015). In the second step, all items of the original scale of Möwes (2016) measuring engineering competences were judged on their relevance for TM students. Third, items of the scale of Möwes (2016) were rewritten to fit the competences expected of TM students. Furthermore, based on Miedema (2015), items to measure specific TM competences were added to the scale. These items measured competences related to technical medical practice and professional behaviour. Having both aspects, engineering and medicine, was especially necessary to investigate the dualism students could experience between these two fields of expertise. As such, the scale had items both measuring engineering competences (e.g. “designing or adapting treatments or diagnostic methods”) and technical medical competences (e.g. “assessing complaints of the patient”). In the fourth phase, this scale was thoroughly discussed with a teacher, researcher and a master TM student and items were rewritten where needed. Further validation of this scale was done by means of this study. Overall, 13 items were added and 3 items were adapted (see appendix A). The version of the CC that was used in this study had a total of 129 items. An overview of the items and underlying factors can be found in Table 2.
Table 2
Overview of scales, factors, n of items and example items used in the Career Compass to measure content of professional identity
Domain Reference Factors (number of items per factor in parentheses)
n
items
Example item
Interests Hansen and Scullard (2002)
community involvement (3); music (3); outdoors (5); screen time (3); fashion & beauty/social (4); sports (3)
21 I am interested in... “team sports”
Competences Male, Bush, and Chapman (2011) Miedema (2015) Passow (2008)
engineering (6); international orientation (3); management (8); research (7); professional behaviour (7); team (5); technical medical practice (5)
41 I am good at…“motivating myself”
Values Lyons, Higgins, and Duxbury (2010)
achievement & power (5); lifelong learning (4);
Ros, Schwartz, and Surkiss (1999)
hedonism (4); tradition (4); security (3); universalism (3); family (1)
Personality Ashton et al. (2004) Ashton and Lee (2009)
honesty (4); emotionality (4); extraversion (5);
agreeableness (4);
conscientiousness (4); open-mindedness (4)
25 I am… “honest”
Goals Roberts and Robins (2000)
Sheldon, Elliot, Kim, and Kasser (2001)
comfort (3); economy & status (4); family (3); physical well-being (3); purpose (3); security (2)
18 In the future I want to… “know my purpose in life”
Strength of professional identity. To measure the degree of identification with the
future profession of TP six items from Ellemers et al. (1999) were used (e.g. “I feel good about being technical physician”). Respondents could answer on a 7-point Likert scale (1 = strongly disagree; 7 = strongly agree). The initial scale consisted of 10 items of which six were selected that covered both affective and cognitive commitment. This was done to make sure participants would not need more than 20 minutes to finish the survey.
Career clarity and exploration. Items to measure career clarity and exploration were
adapted from two articles (Gupta et al., 2015; Meeus, Iedema, Helsen, Vollebergh, & Meeus, 1999). These items had been used in research of Möwes (2016), however were not used in further analysis. Though, her research showed that both scales of career clarity and exploration were of sufficient reliability, respectively a Cronbach’s Alpha of .853 and .801.
Professional role confidence. Professional role confidence was measured with seven
items adjusted from Cech et al. (2011) on a 7-point Likert scale (1 = strongly disagree; 7 = strongly agree).
Table 3
Overview of scales, factors, n of items and example items used in the Career Compass to measure professional role confidence and career clarity and exploration
Intended career choice. Finally, participants answered questions on concrete career
choices on a 7-point Likert scale (1 = strongly disagree; 7 = strongly agree). First, students were asked for the context (hospital, company and university) they would prefer to work in five years after graduation (e.g. “5 years after graduation, I would prefer to work in a hospital”). Second, five similar questions were asked about the job type students would prefer: researcher, designer, manager, consultant and medical specialist. These job types were adjusted from the roles of a TP described by Miedema (2015).
Construct Reference n items Example item Professional role
confidence
Cech et al. (2011) 7 At the moment I am confident... “in my ability to be successful in my career as technical physician”
Career clarity and exploration
Gupta et al. (2015) Meeus et al. (1999)
3.4 Procedure
Participants participated in an online survey in December 2016 and January 2017. Before the actual data collection took place, a pilot study was performed to detect possible problems of the survey. The survey was tested with four students before it was sent to the participants. All current bachelor and master students of TM received an invitation via e-mail to participate. In this e-mail participants were provided with information about the study, the importance of their participation for the study program of TM, and the possibility of receiving the results. In line with the ethical guidelines of the UT, participants were informed that the data will be treated anonymously. Also at the beginning of the survey students were informed that their participation is voluntary and that they can quit if they do not feel comfortable while participating. Lastly, students were asked to find a quiet space and take enough time to complete the survey. At the end of the survey, participants could enter their e-mail to receive a personal report and the general results of the research. To ensure anonymity, the personal e-mail addresses were encoded and stored separately from the data. In addition to the invitation via e-mail, the researcher promoted this study via lectures and via posters. For B1 and B3 students, participation for this study was scheduled directly after a lecture to guarantee response. This gave the students the opportunity to directly fill out the survey in the presence of the researcher who was available for questions. One week before the deadline of data collection, specific years with insufficient response rates were once more reminded via e-mail or talks in lectures to participate. All data was collected within a period of six weeks. Participants answered a total of 165 questions, which took them 16minutes on average to complete.
3.5 Instrument validation
The CC has already been validated among STEM students and engineering employees, but has not yet been validated for TM students. For this reason, the factor structure of the content of PI was tested for its validity and reliability by means of Explanatory Factor Analysis (EFA) and Confirmatory Factor Analysis (CFA). Researchers typically first asses an instrument by means of EFA, followed by CFA to asses if the factor structure produced by the EFA fits the data (Worthington & Whittaker, 2006). As such, EFA was first performed for each domain of PI content to examine the underlying dimensionality of the data. This was also done for strength of PI and the career development variables. Secondly, CFA was performed for all domains of PI content, PI strength and career development to confirm the validity of the scales. Once reliable factor structures had been established, mean scores were calculated for all factors. Based on these scores, clusters of TM students were made to understand their PI.
IBM’s statistics program SPSS (24th version) was used to conduct exploratory factor analyses (EFA). To arrive at an EFA that would fit the research goal and data, decisions were made about the 1) type of analysis; 2) sample size; 3) number of factors and; 4) criteria for item removal.
direct oblimin as oblique rotation method was chosen (Field, 2009).
2) Guidelines regarding the minimum sample size for valid EFA outcomes have received considerable discussion in literature. In general, larger sample sizes are better for EFA but two rules of thumb were followed. Following these rules, a minimum of 300 responses was necessary or approximately 390 responses when adopting the model participant-to-item ratio of 3:1 (Worthington & Whittaker, 2006). Therefore, the sample of 380 students who completed the survey is sufficient for conducting EFA. Moreover, Kaiser-Meyer-Olkin measures (KMO) were also performed for the EFA’s of the domains of PI content to analyse whether the sample size is adequate. KMO values between .5 and .7 are considered to be mediocre, values between .7 and .8 as good, values higher than .8 as great (Hutcheson & Sofroniou, 1999, as cited in Field, 2009). 3) Eigenvalues (>1) were analysed to arrive at a definitive number of factors for each
construct. Besides, scree plots were also taken into account when checking the number of factors. To arrive at internal factor structures, items were also judged on their content and how items theoretically connected as an overarching factor. When the final factors were extracted, Cronbach’s alphas were calculated for all factors. According to DeVellis (2012) alphas lower than .60 are considered as poor, between .60 and .70 as mediocre, and greater than. 70 as acceptable. Spearman Brown was calculated for factors containing only two items, as this measure is more reliable for assessing the reliability of two-item factors (Eisinga, Te Grotenhuis, & Pelzer, 2012).
4) Item reduction took place based on the recommendations of Worthington and Whittaker (2006). An item was deleted from the pattern matrix when; the highest factor loading of an item was lower than .3, when an item loaded on several factors with both or more factor loadings higher than .3, and when the difference between the two highest factor loadings of an item was smaller than .15.
3.5.1. Exploratory factor analyses
[image:18.595.75.289.657.761.2]EFA’s were conducted for the domains of PI content separately. The domains of 'values’ and goals’ were taken together in the EFA because of the overlap between the items. KMO test was run to test if the sample size was large enough for performing EFA. Sample sizes showed to be large enough (KMO > .60) for all domains of PI content, PI strength and the career development variables (see Table 4). As such, EFA could be conducted to explore factor structures for all constructs separately which is discussed in the next sections.
Table 4
Kaiser-Meyer-Olkin values for the domains of professional identity content, professional identity strength and career development variables
Construct KMO
Interests .64
Competences .84
Values & goals .81
Personality .77
Strength of PI .84
Interests. EFA was executed to build an adequate factor structure for the interests of TM students. Initially, a six-factor structure was assumed (community involvement, music, outdoors, screen time, fashion & beauty/social, and sports) within a total of 21 items. After five rounds of step-wise item deletion, 16 items remained resulting in the six factors that were assumed. EFA was also performed setting the number of expected factors, which resulted in 17 remaining items (see appendix B). Two factors were renamed into fashion & beauty and societal involvement to cover the content after item deletion. Three of the factors of the interests’ domain showed poor reliability (α = .47 – .56), whereas the other factors were mediocre (α = .60) and acceptable (α = .76 – 79). The factors music, societal involvement and screen time were of poor reliability and were checked for their correlation. The three items of music were mutually correlated ranging from r = .23 to r = .47 (p > .01). The two items of societal involvement were also significantly correlated (r = .43, p > .01), as well as the two items of screen time (r = .31, p < .01). Therefore, both factors were still included in further analysis. Together all factors explained 63.22% of the total variance.
Competences. Based on theory, seven factors were expected within the domain of
competences (engineering, international orientation, management, research, professional behaviour, team, and technical medical practice). EFA was performed on the 41 items to build a factor structure for the competences of TM students. Eleven items were deleted because they did not meet the criteria, which resulted in an eight-factors structure after four rounds of item deletion (see appendix C). Only the factor of management remained as was initially assumed, all other new factors are combinations of factors or were newly formed in the EFA. The eight established factors are: technical practice, self-management, cognitive skills, collaboration, international orientation, medical practice and research. Firstly, the factor technical practice is a combination of former engineering items and items of technical medical practice that specifically focussed on working with technology within a medical context. The remaining items which were concerned with treating patients and medical practice together formed the factor medical practice. Likewise, the items that originally measured research competences fell apart into two new factors: cognitive and research skills. Furthermore, the factor of professional behaviour was renamed into self-management which better reflected the content of the factor. This was done because several items were deleted which had specifically been added to measure professional behaviour being a TM specific competence. Lastly, one item on international orientation loaded onto the factor of collaboration which could be theoretically substantiated. All factors had mediocre (α = .63 – 68) to acceptable (α = .73 – .82) reliability. The factors explained 61.66% of the total variance.
Values & goals. The domains of values and goals were taken together to build a factor
Personality. For the personality of TM students, a six-factor structure was assumed consisting of the following factors: honesty, emotionality, extraversion, agreeableness, conscientiousness, and open-mindedness. After two rounds of step-wise item deletion according to the criteria for item removal a six-factor structure remained. The initial factor structure remained with a total of 23 items (see appendix E). The factors had a reliability ranging from mediocre (α = .62 – .68) to acceptable (α = .77 – .83). Together the factors explained 61.43% of the total variance.
Strength of professional identity. A one-factor structure was expected for strength of
PI which was also confirmed by EFA (see appendix F). The factor was of acceptable reliability (α = .85) and explained 59.41% of the variance.
Career clarity and exploration. EFA was performed and resulted in the assumed
two-factor structure of career clarity and career exploration (see appendix F). The two-factors had acceptable Cronbach’s Alphas of respectively .81 and .79 and together explained 72.19% of the total variance.
Professional role confidence. Professional role confidence was measured with seven
items which were assumed to result into a one-factor structure (see appendix F). After EFA, all items remained and together formed one factor with a Cronbach’s Alpha of .84 explaining 52.81% of the total variance.
3.5.2. Confirmatory factor analysis
Separate first order CFAs were conducted for all domains of PI and the career development scales to test their quality. The statistics program R and the package lavaan was used to perform the CFA. The Weighted Least Square Means and Variance adjusted (WLSMV) estimator was used, which is an estimator that is appropriate in the context of small samples and simple structure models (Beauducel & Herzberg, 2006). Fit indices were calculated to evaluate the fit and simplicity of the model. Following Kyndt and Onghena (2014), five model fit indicators were calculated and inspected; 1) ratio of the chi-square test statistic to the degrees of freedom; 2) Comparative Fit Index (CFI); 3) Tucker-Lewis Index (TLI); 4) Standardized Root Mean Square Residual (SRMR); and 5) Root Mean Square Error of Approximation (RMSEA). Critical values indicating sufficient model fit for each fit indicator can be found in Table 5.
concepts of strength of PI and professional role confidence were further inspected to better understand the outcomes of the CFA, and possibly improve these values.
Table 5
Output from the CFA for all domains of professional identity, strength of PI, career, clarity, exploration and professional role confidence
Fit indices Critical values indicating sufficient model fit
Interests Compet ences Values & goals Personal ity Strength of PI Career clarity & explorat ion Professi onal role confiden ce
Ratio X2/df <3 1.989 1.838 1.347 2.721 7.002 2.522 6.389
CFI .90 0.875 0.838 0.857 0.745 0.889 0.977 0.874
TLI .90 0.837 0.813 0.836 0.700 0.815 0.957 0.810
RMSEA <.08 0.051 0.047 0.030 0.067 0.126 0.064 0.120 SRMR <.08 0.053 0.062 0.056 0.074 0.046 0.028 0.055
Note. Bold indicates insufficient model fit. CFI = comparative fit index; TLI = Tucker-Lewis index; RMSEA = root mean square error of approximation; SRMR = standardized root mean residual.
3.5.3. Inspecting strength of professional identity and professional role confidence It was decided to further inspect the insufficient model fit for the constructs strength of PI and professional role confidence. EFA was performed with all items of the two constructs together because theoretical overlap was supposed. KMO test was run before performing EFA resulting in a value of .90, indicating the sample size was large enough to perform EFA. After one round of stepwise item deletion, a two-factor structure remained with a total of 12 items. The first factor, strength of PI consisted of all former items and two items from professional role confidence. The two added items showed a theoretical fit with the construct of PI strength, being concerned with the degree of commitment one has to his profession (At this moment I am confident that.. “technical physician is the right profession for me” and “I am very committed to technical medicine”). With regard to the remaining items of professional role confidence, it was decided to delete one item (At this moment I am confident that.. I am capable of developing useful skills”) because of a poor theoretical fit with the other remaining items and a negative impact on the reliability of the scale. As a result, the second factor was named career confidence being the confidence that one can be successful in becoming a member of the profession. Overall, a two-factor structure remained with a total of 11 items (see appendix G) of acceptable reliability (α = .78 – .90). Together the factors explained 63.20% of the total variance.
Table 6
Output from the CFA for the new two-factor structure of professional identity strength and career confidence
Fit indices Critical Values indicating sufficient model fit
New values for the two-factor structure: PI strength & career confidence
Ratio X2/df <3 3.897
CFI .90 0.889
TLI .90 0.858
RMSEA <.08 0.088
SRMR <.08 0.052
Note. Bold indicates insufficient model fit. CFI = comparative fit index; TLI = Tucker-Lewis index; RMSEA = root mean square error of approximation; SRMR = standardized root mean residual.
3.6 Data analysis
Assumptions were checked before the data analysis of which one was not met. Two univariate outliers (z = 3.44, x = 1) on the variable ‘medical specialist’ were found. The score that would be acceptable when assuming z = 3.29 was calculated to see how big of an outlier these two cases were. Calculation resulted in a score of x = 1.20, indicating that the score is not extremely unrepresentative and will likely not bias our statistical tests. For this reason, it was decided not to remove or change the outliers. In the following paragraphs used methods of analysis per question will be discussed.
RQ1a. The aim of the first research question is to determine if there are different profiles in the PI of TM students. Through k-means cluster analysis, participants who have the similar answer patterns were grouped together forming a cluster. A fixed number of clusters must be entered when performing the analysis. Therefore, the options of having three to seven clusters were examined. The cluster solution that fitted the data best was selected by inspecting the iteration history and ANOVA’s. Lastly, the clusters were analysed with the help of theory to arrive at clusters that were both statistically and theoretically appropriate.
RQ1b. Moreover, the relationship between PI content and strength was examined. One-way ANOVA with Bonferroni post-hoc testing was run because Bonferroni guarantees control over Type I errors and it does not necessarily need equal sample sizes (Field, 2009).
RQ1c. Research question 1c investigated the differences in PI content between students differing in their study phase. To answer this research question, chi-square analysis was performed.
RQ2. Fifth, the relationship between study phase and intended career choice and career development was examined. MANOVA was conducted to answer this research question. Checking of assumptions revealed that the assumption of homogeneity of variance was not met for two variables. Levene’s test showed significant results for career confidence (F (364) = 3.33, p = .006) and medical specialist (career choice) (F (364) = 8.40, p < .001). Post-hoc testing for these variables was done with Games-Howell instead of Bonferroni.
RQ3a. Another MANOVA was run to examine to what extent differences in the intended career choice and career development of TM students is depend upon their PI content.
CHAPTER 4
RESULTS
4.1 Descriptive statistics
In Table 7 means, standard deviations and correlations between all continuous variables are depicted. Of the career developmentvariables, TM students scored highest on career confidence (M = 4.67, SD = 1.14) and lowest on career clarity (M = 3.93, SD = 1.25). With regard to job context, students were most likely to work in a hospital (M = 5.50, SD = 1.41) five years after graduating and least likely to work at a university (M = 3.38, SD = 1.43). Students scored highest on working as medical specialist (M = 5.54, SD = 1.32) and lowest on working as a designer (M = 3.58, SD = 1.34).
In this section the most important significant correlations will be discussed (see Table 7 for significance values). First, study phase was significantly positively correlated with working at a company (r = .21) and career exploration (r = .21). Study phase was negatively correlated with PI strength (r = .23), working as medical specialist (r = .33), working at a hospital (r = -.16), and career confidence (r = -.22). PI strength was positively correlated with working as researcher (r = .28), medical specialist (r = .27), working at a hospital (r = .35), university (r = .14), career clarity (r = .25), and career confidence (r = .56). Second, strength was negatively correlated with working at a company (r = -.13) and career exploration (r = -.12). With regard to career development, career exploration was positively correlated with working as a consultant (r = .12), career clarity (r = .44), and negatively correlated with working as designer (r = -.11). Career clarity was positively correlated with working as medical specialist (r = .23), working at a hospital (r = .23), and career confidence (r = .40). It was negatively correlated with working at a company (r = -.13). Lastly, career confidence was positively correlated with working as a researcher (r = .19), medical specialist (r = .16), with working in a hospital (r = .16), and a company (r = .15). Overall, students with a high PI strength also have high confidence in their career as TP, high career clarity but low exploration. Students with low PI strength will likewise have higher career exploration However, correlations show that students high on exploration also have high career clarity. This can be explained by the fact that PI strength and career confidence are TM specific variables, whereas career clarity and exploration were not measured with regard to a profession.
Table 7
N, Means, SD and correlations for all continuous variables
Note. ** Correlation is significant at the 0.01 level (2-tailed). * Correlation is significant at the 0.05 level (2-tailed) Correlations
N Mean SD 1 2 3 4 5 6 7 8 9 10 11 12 13
1. Study phase 379 3.16 1.68 1
2. PI strength 377 4.92 0.99 -.23** 1
Job type
3. Researcher 370 3.86 1.57 .08 .28** 1
4. Designer 370 3.58 1.34 .03 .02 .21** 1
5. Manager 370 3.89 1.47 -.06 -.04 -.12* .04 1
6. Consultant 370 4.03 1.50 .04 .05 -.10* -.02 .53** 1 7. Medical
specialist
370 5.54 1.32 -.33** .27** -.14** -.13* .03 -.01 1
Job context
8. Hospital 370 5.50 1.41 -.16** .35** .01 -.17** -.23** -.17** .51** 1
9. University 370 3.38 1.43 -.02 .14** .38** .10* .03 -.06 -.03 .07 1
10. Company 370 4.00 1.60 .21** -.13* -.03 .20** .38** .35** -.24** -.48** -.10* 1
Career development
12. Career clarity 375 3.93 1.25 -.09 .25** -.02 -.07 -.05 -.07 .23** .23** -.03 -.13* 1 11. Career
exploration
375 4.52 1.27 .21** -.12* -.05 -.11* .09 .12* -.02 -.09 .02 .10 .44** 1
13. Career confidence
4.2 RQ1 – What are variations in TM students’ PI and how are these
related to study phase?
To answer this question, first analysis of PI content of TM students resulted in several profiles of TM students. Secondly, the relationship between PI content and strength was examined. Third, differences in PI content across study phase were analysed. Lastly, the relation between study phase and PI strength was inspected.
4.2.1 RQ1a – What profiles can be deduced to describe variations in the PI content of TM students?
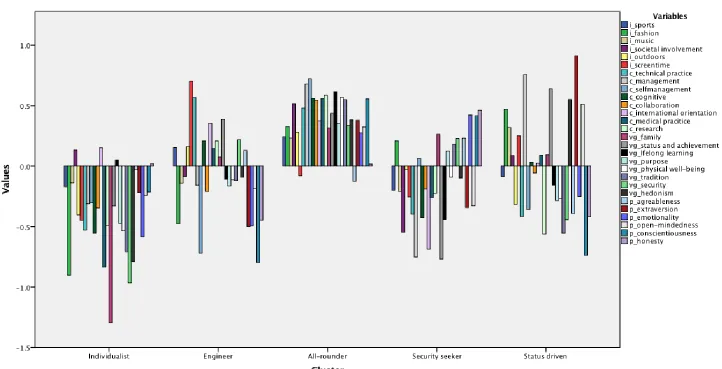
The goal was to establish profiles to describe variations in the PI content of TM students. The 28 factors on the four domains of PI were used to determine profiles of the various types of TM students by means of k-means clustering analysis. Based on theoretical considerations, solutions of three to seven clusters were examined. One participant was excluded from the data analysis because he formed a cluster on his own. This was due to his extremely negative answer pattern indicating he did not take participation seriously. Firstly, iteration history was inspected. When the algorithm converged, this means there is no further change in the assignment of instances to clusters indicating cluster stability (Wagstaff, Cardie, Rogers, & Schroedl, 2001). Secondly, ANOVA’s were inspected from which was determined if all factors significantly contributed to the cluster formation. As a result, both the five- and six-cluster solution showed good fit. A five-cluster solution was chosen as this was the theoretically most logical solution.
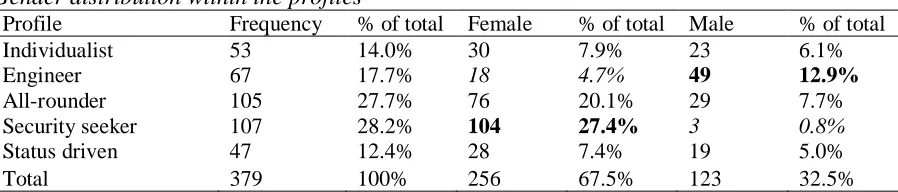
Distribution of profiles. Chi-square analysis showed that gender was not equally distributed across the profiles, X2 (4) = 98.87, p < .001. Post-hoc analysis was performed by looking at the adjusted residuals and showed a significant unequal gender distribution within two profiles (see Table 8). Men were significantly overrepresented in the engineer profile (z = 7.8, p < .001), while women were overrepresented in the profile of the security seeker (z = 7.7, p < .001).
Table 8
Gender distribution within the profiles
Profile Frequency % of total Female % of total Male % of total
Individualist 53 14.0% 30 7.9% 23 6.1%
Engineer 67 17.7% 18 4.7% 49 12.9%
All-rounder 105 27.7% 76 20.1% 29 7.7%
Security seeker 107 28.2% 104 27.4% 3 0.8%
Status driven 47 12.4% 28 7.4% 19 5.0%
Total 379 100% 256 67.5% 123 32.5%
Note. Bold indicates significantly more than expected, italic indicates significantly less than expected.
4.2.2 RQ1b – What is the relationship between TM students’ PI content and strength? Inspection of Figure 4 shows the all-rounder had the highest strength of PI (M = 5.26, SD = 0.96) followed by the status driven (M = 4.96, SD = 0.99) and engineer (M = 4.90, SD = 1.04). The security seeker (M = 4.76, SD = 0.92) and individualist showed the lowest PI strength (M = 4.57, SD = 0.93).
Figure 4. Means of strength of professional identity for the different profiles.
[image:28.595.76.390.403.606.2]4.2.3 RQ1c – What are differences in TM students’ PI content across different study phases?
The goal was to investigate how students in different study phases differ in their PI content. Figures 5 shows the distribution of the profiles within each study phase. What is noticeable is that the engineer seems to become more present towards the last years of the study. Remarkably, the security seeker seems equally distributed across study phases. Lastly, it shows that the status driven profile is mostly represented in the bachelor and is underrepresented in the master. Chi-square analysis was performed and showed that the profiles were indeed unequally distributed across the different study phases, X2 (20) = 40.95, p = .004.
Figure 5. Stacked bar chart showing the percentages of the profiles within each study phase.
[image:29.595.79.501.232.475.2]Table 9
Distribution of profiles within study phase
Profile B1 B2 B3 M1 M2 M3 Total
Individualist Observed count 22 5 8 3 10 5 53 Expected count 12.6 7.7 10.9 8.0 8.1 5.7 53.0
% 24.4% 9.1% 10.3% 5.3% 17.2% 12.2% 14.0%
Engineer Observed count 12 7 12 12 12 12 67
Expected count 15.9 9.7 13.8 10.1 10.3 7.2 67.0 % 13.3% 12.7% 15.4% 21.1% 20.7% 29.3% 17.7%
All-rounder Observed count 15 15 27 18 18 12 105 Expected count 24.9 15.2 21.6 15.8 16.1 11.4 105.0 % 16.7% 27.3% 34.6% 31.6% 31.0% 29.3% 27.7%
Security seeker Observed count 24 17 22 15 17 12 107 Expected count 25.4 15.5 22.0 16.1 16.4 11.6 107.0 % 26.7% 30.9% 28.2% 26.3% 29.3% 29.3% 28.2%
Status driven Observed count 17 11 9 9 1 0 47 Expected count 11.2 6.8 9.7 7.1 7.2 5.1 47.0
% 18.9% 20.0% 11.5% 15.8% 1.7% 0% 12.4%
Total Observed count 90 55 78 57 58 41 379
Expected count 90 55 78 57 58 41 379
% 23.7% 14.5% 20.6% 15.0% 15.3% 10.8% 100%
Note. Bold indicates significantly more than expected, italic indicates significantly less than expected.
4.2.4 RQ1d – What is the relationship between TM students’ study phase and their PI strength?
Strength of PI was highest amongst B1 students (M = 5.30, SD = 0.74) followed by M1 students
(MD = 5.14, SD = 0.91), and B2 students (M = 5.02, SD = 0.91). M2 students scored lowest on
PI strength (M = 4.44, SD = 1.04), followed by B3 students (M = 4.70, SD = 1.07), and M3
students (M = 4.70, SD = 1.07). The scores per study phase were plotted (see Figure 6).
[image:30.595.76.398.520.750.2]Spearman’s rank-order correlation was run to determine the relationship between students’ study phase and their strength of PI. There was a weak negative correlation between study phase and strength of PI, which was statistically significant rs = -.226, p < .001. In
addition, one-way ANOVA with Games-Howell post-hoc was performed to examine
4.3 RQ2 – What is the relationship between TM students’ study phase and
their intended career choice and career development?
Descriptive statistics of career choices were already inspected in section 4.1. MANOVA’s were run to inspect the relationship between study phase and intended career choice and career development of TM students.
The first MANOVA was run to examine the relationship between study phase and intended career choice. Pillai’s Trace test showed there was a significant effect of study phase on intended career choice, V = .250, F(30, 1815) = 3.19, p = < .001. The career choices of designer and medical specialist showed to be significantly different depending upon study phase. A second MANOVA was run to examine the relationship between study phase and the career development variables: career clarity, exploration and confidence. Pillai’s Trace test showed there was a significant effect of study phase on these three variables, V = .189, F(15, 1207) = 4.96, p < .001. Career exploration and career confidence showed to be significantly different depending on study phase. Results of the MANOVA are shown in Table 10.
[image:32.595.71.530.458.698.2]Scores on intended career choice and the career development variables were plotted for all study phases (Figure 7 and 8). To further explore the data for between-group differences, post-hoc analyses were run. Concerning intended career choice, Bonferroni post-hoc testing indicated students from B2 scored lower than B1 (p < .05), M1 (p < .01) and M3 (p < .05) students on the likelihood to work as a designer five years after graduation. Lastly, students from M2 were significantly less inclined to work as medical specialist than B1, B2 (p < .001), B3 (p < .01) and M1 (p < .05) students. This was also the case for M3 students (p < .001). No significant differences between study phase were found with regard to working as researcher, manager and consultant.
Table 10
Means, SD, and results of MANOVA for intended career choice and career development per study phase
Study phase
B1 B2 B3 M1 M2 M3
MANOVA
Variable Mean (SD)
Mean
square F df p
Intended career choice
Researcher 3.66 (1.40) 3.68 (1.61) 3.96 (1.65) 4.04 (1.65) 3.83 (1.58) 4.12 (1.55) 2.11 0.86 5 .51
Designer 3.74 (1.35)
B2
3.00 (1.13) B1, M1, M3
3.60 (1.23) 3.89 (1.36) B2
3.33 (1.39) 3.85 (1.46) B2
6.46 3.73 5 .00
Manager 3.93 (1.36) 3.79 (1.47) 4.01 (1.43) 4.13 (1.38) 3.98 (1.57) 3.29 (1.62) 4.00 1.89 5 .10
Consultant 3.91 (1.46) 3.89 (1.41) 4.09 (1.57) 4.16 (1.41) 4.43 (1.48) 3.63 (1.61) 3.88 1.75 5 .12
Medical specialist 5.89 (.89) M2, M3 5.92 (1.03) M2, M3 5.78 (1.22) M2, M3 5.68 (1.21) M2, M3 4.91 (1.44) B1, B2, B3, M1
4.51 (1.70) B1, B2, B3, M1
18.01 11.92 5 .00
Career development
Career clarity 4.16 (1.12) 3.90 (1.33) 3.96 (1.20) 3.78 (1.23) 3.64 (1.34) 4.00 (1.38) 2.21 1.42 5 .22
Career exploration 4.15 (1.13) B3, M2, M3
4.13 (1.30) B3, M2, M3
4.90 (1.19) B1, B2
4.28 (1.22) 4.89 (1.42) B1, B2
4.92 (1.11) B1, B2
9.91 6.57 5 .00
Career confidence 5.13 (.93) B3, M2, M3
4.92 (1.29) 4.30 (1.07) B1
4.68 (1.06) 4.25 (1.27) B1
4.58 (.91) B1 7.18 8.56 5 .00
With regard to career exploration, Bonferroni post-hoc testing showed that students in B3 scored significantly higher on career exploration than B1 (p < .01) and B2 (p < .01). Also M2 students scored significantly higher than B1 (p < .01) and B2 (p < .05). Lastly, M3 students showed significantly higher scores than B1 (p < .05) and B2 (p < .05).Games-Howell post-hoc testing showed that B1 students had significantly more career confidence than students from B3 (p < .001), M2 (p < .001) and M3 (p < .05). No significant differences were found between study phases with regard to career clarity.
Figure 8. Mean scores per study phase on career clarity, exploration, and confidence.