Student Academic Performance Prediction using
Artificial Neural Networks: A Case Study
Mubarak Albarka Umar
School of Computer Science and Technology
Changchun University of Science and Technology, Jilin, China
ABSTRACT
Students dropout and delay in graduation are significant problems at Katsina State Institute of Technology and Management (KSITM). There are various reasons for that, students’ performances during first year is one of the major contributing factors. This study aims at predicting poor students’ performances that might lead to dropout or delay in graduation so as to allow the institution to develop strategic programs that will help improve student performance and enable the student to graduate in time without any problem. This study presents a neural network model capable of predicting student’s GPA using students’ personal information, academic information, and place of residence. A sample of 61 Computer Networking students’ dataset was used to train and test the model in WEKA software tool. The accuracy of the model was measured using well-known evaluation criteria. The model correctly predicts 73.68% of students’ performance and, specifically, 66.67% of students that are likely to dropout or experience delay before graduating.
Keywords
Educational Data Mining, Student Performance Prediction, Classification, Neural Network.
1.
INTRODUCTION
At a time when higher education is ever more critical to economic success, academic failure is an important issue [1], and for higher education institutions whose goal is contributing towards improving higher education quality, the success of human capital creation is an issue of continuous analysis [2]. One way of improving such quality is through predicting student performance. Hence, taking early interventions to improve teaching quality and subsequently student’s performance. The vast growing and availability of data in educational environment has enabled many institutions to exploit various Data Mining algorithms to extract hidden knowledge and useful insight. This knowledge and insight can benefits not only students but also teachers, course developers, educational researchers, organizations, administrators, and academic institutions as explained by Romero and Ventura [3]. The application of Data Mining in educational framework is commonly referred to as Educational Data Mining (EDM) [4]. In recent years, EDM has attracted significant research interest and has emerged as a research area for researchers from various fields due to its potentials to education [5].
One of the educational problems that are solved with data mining is the prediction of students' academic performances. Many researchers have developed models for predicting students’ performances at various levels based on various data using different Data Mining (DM), Machine Learning (ML) and Statistical methods. Hamsa et al., [6] used Decision tree and Fuzzy Genetic Algorithm to develop performance
prediction model which can be used to identify student’s performance for each subject. Cortez and Silva [7] attempts to predict secondary school student failure by applying and comparing four data mining algorithms: Decision Tree, Random Forest, Neural Network and Support Vector Machine. Huang and Fang [8] worked on developing models to make early scores predictions, even before the semester starts, for the final comprehensive exam of the engineering dynamics course. They used and compared four techniques including neural networks and support vector machines. Flitman [9] used neural networks, logistic regression and Discriminant analysis for analyzing student failures. Furthermore, [10], [11], [2], [12] developed various models on predicting student performance. In most of these studies, Neural Network outperformed other methods and none of the methods have the power to discover potential data patterns as neural networks. The good results of applying neural networks in prediction and classification problems makes it appropriate for this study.
A significant problem in KSITM is the poor results of students after admission. Due to the poor results during the first year of study, it took one or two additional years for some students to graduate and some ended up dropping-out. Although the delay in graduation and dropping-out could be cause by various factor, student performance plays a significant role. This study particularly focuses on contribution of poor performance towards delay in graduation and dropout. The main aim is to develop a Neural Network model capable of identifying students that may end up with poor results during first year and also to access the accuracy and reliability of the Neural Network model in predicting the student performance. Subsequently, the feasibility of adopting the model in dealing with the issue at hand will be explored. The paper is organized as follows: The next section (section 2) reviews related student performance prediction work in EDM field using neural network and the success/failure of neural network for prediction and classification problems in education. Then in section 3, describe how data was obtained, preprocessed and divided into training and testing dataset, as well as how the model was designed and built. Next, result of using the network model with testing data are presented in section 4 along with discussion and evaluation of the model using certain criteria. Section 5 presents conclusion on accuracy and reliability of the network model as well as limitation of the model and finally, presents ideas for further work and suggestions on integrating a similar model into the admission process of KSITM.
2.
LITERATURE REVIEW
International Journal of Computer Applications (0975 – 8887) Volume 178 – No. 48, September 2019
using K-Means. Their result demonstrated a high level of accuracy and efficiency in identifying slow, moderate and fast learners. Zacharis [14] used student data stored in Moodle server and predicted student success in course based on four learning activities in server. He trained a Multilayer Perceptron neural network to predict student performance on a blended learning course environment. The model predicted performance of students with correct classification rate (CCR) of 98.3%. Oancea et al., [15] also used the classification power of a neural network to predict potential students with problems in continuing their education after first year. They achieved an accuracy of over 86%. Wongkhamdi and Seresangtakul [16] study the effectiveness of artificial neural networks in forecasting graduate student outcomes. They proved that artificial neural networks are able to significantly improve student graduation outcome prediction with 93.3% accuracy compared to discriminant analysis having 81.5%. A review on student performance prediction by Shahiri [17] found that neural network and decision tree are two of commonly used classification techniques with prediction accuracy of 98% and 91% respectively. Support vector machine and k-nearest neighbor have the same accuracy of 83%, while naive Bayes have lower prediction accuracy (76%). The ability of a neural network to learn and adjust is what makes it useful and powerful in EDM prediction and thus, it will also be used in this study.
Han et al., [18] defined a classification model as a model or classifier that is constructed to predict class (categorical) labels while a prediction model as a model (a predictor) constructed to predicts a continuous-valued function, or ordered value, as opposed to a class label. Conversely, [19] explains a model applied to existing data with known class as classification model and when applied to a new data with unknown class as prediction model. However, the two terms will be used interchangeably in this work as used by many researchers [15], [20], [21].
3.
METHODOLOGY
3.1
Data Acquisition and Preprocessing
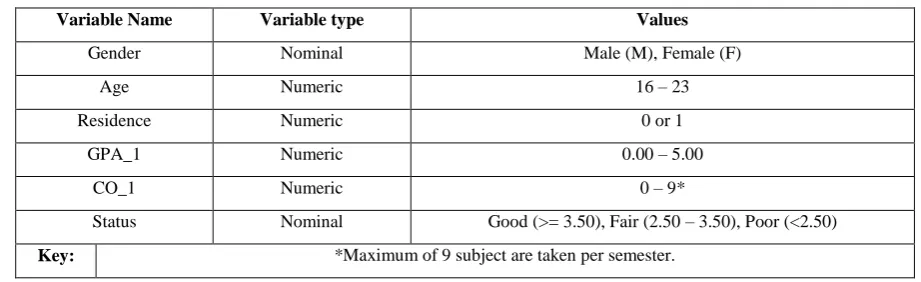
For this study, student dataset of 2018 academic year was obtained from the Department of Networking and System Security in KSITM. The data was carefully reviewed, preprocessed, and organized in a new excel flat file before converting it into WEKA tool file format (arff). Incomplete and irrelevant data were eliminated, such as Exam Scores of 18 subjects from first and second semesters because GPA from the two semesters was provided. After the preprocessing, the dataset comprises records of 61 Computer Networking students’ personal information: Gender which is a nominal variable limited to two values (M or F), and Age which is a numeric value between 16-23 years old, Information about Place of residence which is transformed into a numeric variable of two distinct values (1 for students leaving in Katsina Town, and 0 otherwise), and Academic data: Grade Point Average of first semester (as GPA_1) which is numeric variable, number of subjects failed from preceding semester i.e., Carryovers of first semester (as CO_1) also a numeric variable, and finally, Status - the target variable which is nominal.
[image:2.595.65.526.487.628.2]The new categorical target variable is constructed based on the second semester GPA achieved by the students during the first year of study. The predicted variable has three distinct values, corresponding to the three classes in which the students are classified – Good, Fair, and Poor. Since the objective is on predicting students at risk of delay in graduation or dropping-out, students with GPA below 2.50 are classified as Poor and will need strong intervention, students with GPA between 2.50 to 3.50 are classified as Fair, needing less support, while the students with GPA above 3.50 are classified as Good, they are fine without any intervention. The final dataset for the study contains 61 instances and 6 attributes, 4 of the attributes are numeric variables and the remaining 2 attributes including the predicted class variable are nominal variables accepting a certain number of distinct values as shown in Table 1.
Table 1: Final Dataset Used
Variable Name Variable type Values
Gender Nominal Male (M), Female (F)
Age Numeric 16 – 23
Residence Numeric 0 or 1
GPA_1 Numeric 0.00 – 5.00
CO_1 Numeric 0 – 9*
Status Nominal Good (>= 3.50), Fair (2.50 – 3.50), Poor (<2.50)
Key: *Maximum of 9 subject are taken per semester.
3.2
Model Design and Setup
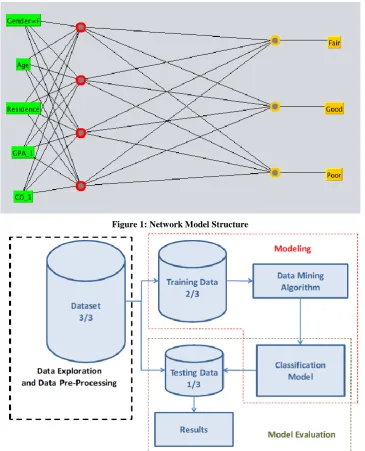
WEKA software – a powerful open source tool offering a wide range of classification and prediction methods [22], was used to build and test the model. A Neural Network (MultiLayer Perceptron) algorithm having 1 Input layer with 5 neurons, 1 hidden layer with 4 neurons, and an Output layer with 3 neurons (5I-4H-3O) structure was selected to build the model as shown in
Figure 1: Network Model Structure. The dataset was divided into two sets using WEKA’s instance Resample filter: Training data comprising of approximately 2/3 (70%) of the data and Testing data comprising the remaining 1/3 (30%). The Training data was firstly used to train the network model and then Testing data was supplied to test and evaluate the model. Figure 2: Model Training and Testing Processes
Figure 1: Network Model Structure
Figure 2: Model Training and Testing Processes [20]
4.
RESULT AND DISCUSSION
After developing any model, it is important to evaluate how well the model fits to the future predictions. One of the simplest methods of analyzing the correctness of a model is by finding the error between the predicted value and the actual value [23]. From here, there are several methods that can be used to further get meaning from the findings. Measuring the accuracy of the model is an important step to justify whether to or not to use the model in a given case. For this study, the accuracy of the model was evaluated using some well-known evaluation measures generated in the WEKA report. The well-known evaluation criteria are:
Percentage of correctly/incorrectly classified instances.
Kappa Statistic: an index that compares correct classifications against chance classifications and take values in the range from -1 for complete disagreement, to 1 for perfect agreement.
True Positive (TP) Rate – which shows fraction of instances correctly classified as a given class. The higher the value the better.
False Positive (FP) Rates – which shows fraction of instances falsely classified as a given class. The low the value the better.
Precision (Specificity) – fraction of items correctly predicted as belonging to a given class out of the entire classified items in the class. The higher the value the better.
Recall (Sensitivity) – fraction of items correctly predicted as belonging to a given class out of the entire class’s actual items/instances. The higher the value the better.
International Journal of Computer Applications (0975 – 8887) Volume 178 – No. 48, September 2019
Receiver Operating Characteristic (ROC) curve – measures model accuracy in a weighted sort way. The greater the area under the curve the better.
Confusion matrix was also used to describe the class-wise performance of the model.
4.1
Instance Classifications
As shown in
Error! Reference source not
found.
Table 2 the model was able to correctly classified 14 of the 19 supplied instance which is about 74% of the total instance. This seems to be promising. The model also shown relatively better result with about 0.6/1 compared to randomguessing (a Kappa statistic of 0.0) of instance’s classes. But the accuracy and reliability of a model cannot be judged based on instances classification only, as it is not sensitive to class distribution, hence the model’s detailed accuracy of each class should be considered.
[image:4.595.70.527.229.434.2]The Neural Network model predicted (TP) all ‘Good’ class instance correctly and most of ‘Fair’ and ‘Poor’ classes instances with above average accuracy. The fractions of the wrongly classified instance (FP) were also very less in all the classes, which means that this model can successfully predict second semester’s GPA class of students based on their personal information, residential information, and academic performance of previous semester.
Table 2: Achieved Results of the Neural Network Model
Evaluation Parameters Number of instances Classification percentage
Correctly Classified Instance 14 73.6842 %
Incorrectly Classified Instance 5 26.3158 %
Kappa Statistics 0.594
Classes
Good Fair Poor Weighted Average
TP Rate 1.000 0.556 0.667 0.737
FP Rate 0.250 0.000 0.125 0.112
Precision 0.700 1.000 0.500 0.811
Recall 1.000 0.556 0.667 0.737
F-Measure 0.824 0.714 0.571 0.732
ROC Area 0.929 0.744 0.708 0.807
4.2
Receiver Operating Characteristic
(ROC)
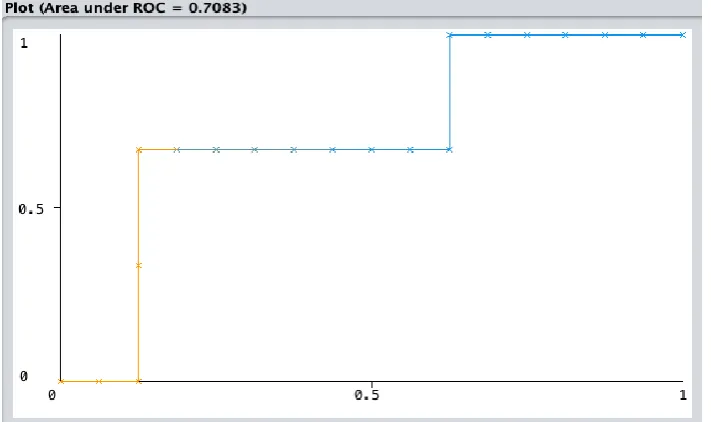
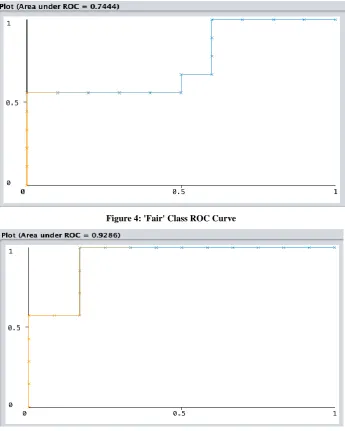
The receiver operating characteristic (ROC) curve illustrates diagnostic ability of the classifier for each of the classes. If the curve approach 1, it shows optimality of the model and it indicates that the model is good for prediction (if the area under the curve (ROC area) is below 0.5, then random guesses
outperform the model). Figure 3, Figure 4, and Figure 5 shows the ROC curve of the classes: ‘Poor’, ‘Fair’ and ‘Good’ respectively, and the AUC (area under the curve) used to measure the overall quality of model – the larger the area, the more accurate the model. The graphs, which are generated by plotting the TP Rate (y-axis) against the FP Rate (x-axis) of a given class, summarized the performance of the model in each class.
[image:4.595.122.478.531.742.2]Figure 4: 'Fair' Class ROC Curve
Figure 5: 'Good' Class ROC Curve
4.3
Confusion Matrix
The Confusion Matrix (commonly called contingency table or error matrix) – a specific table layout that allows visualization of algorithm/model’s performance, typically a supervised learning one, generated by WEKA further shows how well the model is performing on each class. The result presented in
[image:5.595.49.287.674.767.2]Table 3 is encouraging: 66.7% of the poor performing students in ‘Poor’ class were correctly predicted by the network model, all of the good performing students in ‘Good’ class and more than half of the averagely performing students in ‘Fair’ class were also correctly predicted. Sum of diagonal in the matrix is the number of correctly classified instances; all others are incorrectly classified instances.
Table 3: Confusion Matrix
Predicted Class
Good Fair Poor
Actual Class
Good 7 0 0
Fair 2 5 2
Poor 1 0 2
5.
CONCLUSION
The aim of this study was to build a model to predict performance of student at KSITM to help control the ongoing dropout and graduation delay issues. To achieve that, WEKA software tool was used to create a Multilayer Perceptron Neural Network (MLP-NN) model, the model was trained using 70% of the total instances of student dataset of 2018 academic year obtained from the Department of Networking and System Security in KSITM. The model appeared to be promising when tested using the remaining 30% of the dataset. The accuracy of the model was evaluated using some well-known evaluation criteria, it correctly predicts 73.68% of the students’ performance and particularly, 66.67% of the poor performing students.
International Journal of Computer Applications (0975 – 8887) Volume 178 – No. 48, September 2019
departments in KSITM covering results of some years with diverse attributes, this could help in developing more reliable model with higher prediction accuracy.
For future work, the research can be extended with more distinctive attributes and larger dataset to develop more accurate model, useful for improving the students’ performance outcomes. Also, the type of neural network, the number of hidden layers and number of neurons can be studied intensively to determine their effects in training a model. Furthermore, experiments could be done using other data mining algorithms to get a broader approach, and whether or not they could produce more reliable and accurate model. Some different data mining software may as well be used or even implement, train and test the model using Java programming language, Python or Matlab.
Finally, any successfully developed reliable and accurate model can be integrated into the institute’s admission process as decision support system (DSS) to ease and simplify the admission process and ensure admitting more qualified candidates, based on certain attributes such as their secondary school performance, that can graduate successfully in time.
6.
ACKNOWLEDGMENTS
Special thanks to Abdulhakim Ibrahim Yaya of KSITM for providing the dataset for this study, and Mustapha Musa of CUST for his help during data preprocessing and his comments on designing the model.
7.
REFERENCES
[1] A. S. Hoffait and M. Schyns, ‘Early detection of university students with potential difficulties’, Decis. Support Syst., vol. 101, pp. 1–11, 2017.
[2] E. Osmanbegović and M. Suljić, ‘Data Mining Approach for Predicting students performances’, J. Econ. Bus., vol. X, no. 1, pp. 3–12, 2012.
[3] C. Romero and S. Ventura, ‘Educational Data Mininig: A reviwe of the state of the art’, IEEE Trans. Syst. Man. Cybern., vol. 40, no. X, pp. 601–619, 2010.
[4] ‘educationaldatamining.org’. [Online]. Available: http://educationaldatamining.org/. [Accessed: 09-May-2019].
[5] M. M. Abu Tair and A. M. El-Halees, ‘Mining Educational Data to Improve Students’ Performance: A Case Study’, Int. J. Inf. Commun. Technol. Res., vol. 2, no. 2, pp. 140–146, 2012.
[6] H. Hamsa, S. Indiradevi, and J. J. Kizhakkethottam, ‘Student Academic Performance Prediction Model Using Decision Tree and Fuzzy Genetic Algorithm’, Procedia Technol., vol. 25, pp. 326–332, 2016.
[7] P. Cortez and A. Silva, ‘Using data mining to predict secondary school student performance’, Proc. 5th Futur. Bus. Technol. Conf., vol. 2003, no. 2000, pp. 5–12, 2008.
[8] S. Huang and N. Fang, ‘Work in progress: Early prediction of students’ academic performance in an introductory engineering course through different mathematical modeling techniques’, Proc. - Front. Educ. Conf. FIE, vol. 1, pp. 3–4, 2012.
[9] A. M. Flitman, ‘Towards analysing student failures: Neural networks compared with regression analysis and
multiple discriminant analysis’, Comput. Oper. Res., vol. 24, no. 4, pp. 367–377, 1997.
[10] M. Al-Saleem, N. Al-Kathiry, S. Al-Osimi, and G. Badr, ‘Mining Educational Data to Predict Students’ Academic Performance’, Mach. Learn. Data Min. Pattern Recognition, Mldm 2015, vol. 9166, no. 6, pp. 403–414, 2015.
[11] C. E. Lopez Guarin, E. L. Guzman, and F. A. Gonzalez, ‘A Model to Predict Low Academic Performance at a Specific Enrollment Using Data Mining’, Rev. Iberoam. Tecnol. del Aprendiz., vol. 10, no. 3, pp. 119–125, 2015. [12] D. Delen, ‘A comparative analysis of machine learning
techniques for student retention management’, Decis. Support Syst., vol. 49, no. 4, pp. 498–506, 2010. [13] C. El Moucary, M. Khair, and W. Zakhem, ‘Improving
Student’s Performance Using Data Clustering and Neural Networks in Foreign-Language Based Higher Education’, Res. Bull. Jordan ACM, vol. 2, no. 3, pp. 27–34, 2011.
[14] N. Z. Zacharis, ‘Predicting Student Academic Performance in Blended Learning Using Artificial Neural Networks’, Int. J. Artif. Intell. Appl., vol. 7, no. 5, pp. 17–29, 2016.
[15] B. Oancea, R. Dragoescu, and S. Ciucu, ‘Predicting students’ results in higher education using a neural network’, no. 72041, 2013.
[16] T. Wongkhamdi and P. Seresangtakul, ‘A Comparison of Classical Discriminant Analysis and Artificial Neural Networks in Predicting Student Graduation Outcomes’, Proc. Second Int. Conf. Knowl. Smart Technol., pp. 29– 34, 2010.
[17] A. M. Shahiri, W. Husain, and N. A. Rashid, ‘A Review on Predicting Student’s Performance Using Data Mining Techniques’, Procedia Comput. Sci., vol. 72, pp. 414– 422, 2015.
[18] J. Han, M. Kamber, and J. Pei, Data Mining – Concepts & Techniques, 3rd Editio. USA: Morgan Kaufmann Publishers, Elsevier Inc, 2012.
[19] ‘What is the difference between classification and prediction?’ [Online]. Available: https://www.kdnuggets.com/faq/classification-vs-prediction.html. [Accessed: 09-Jun-2019].
[20] D. Kabakchieva, ‘Student Performance Prediction by Using Data Mining Classification Algorithms’, Int. J. Comput. Sci. Manag. Res., vol. 1, no. 4, pp. 686–690, 2012.
[21] B. Guo, R. Zhang, G. Xu, C. Shi, and L. Yang, ‘Predicting Students Performance in Educational Data Mining’, Proc. - 2015 Int. Symp. Educ. Technol. ISET 2015, pp. 125–128, 2016.
[22] I. H. Witten, E. Frank, and H. Mark A., Data Mining Practical Machine Learning Tools and Techniques Third Edition, 3rd Editio., vol. 1, no. 5. USA: Morgan Kaufmann Publishers, Elsevier Inc, 2011.