© 2019, IRJET | Impact Factor value: 7.211 | ISO 9001:2008 Certified Journal
| Page 3331
Rapid Spectrum Sensing Algorithm in Cooperative Spectrum Sensing
for a Large Network
S.B. Gaikwad
1, V.V. Dixit
2, A.R. More
31
(PG Student)Department of Electronics & Telecommunication, RMD SSOE, Pune, 411058 India
2(Principal), RMD SSOE, Pune, 411058 India
3
(Assistant Professor), Department of Electronics & Telecommunication, RMD SSOE, Pune, 411058 India
---***---Abstract -
Cognitive radio is an emerging technology thatenhances the utilization of available spectrum through dynamic access allocation. It autonomously identifies the unutilized portions, white spaces (spectrum holes) , in the licensed band and thus efficiently improving its usage. In co-operative spectrum sensing, decision of spectrum availability is taken based on collective decision by multiple cognitive users. For any detector applied to cooperative spectrum sensing, the ideal voting rule is obtained. The detection threshold was optimized when using energy detection .Finally, a rapid spectrum sensing algorithm is suggested for a big network that needs fewer cognitive radios in cooperative spectrum sensing is obtained
Key Words: Cognitive radio, energy detection,
optimization, spectrum sensing, throughput
1. INTRODUCTION
With advancement in wireless technology, spectrum as the major resource for wireless communication systems has now become much a scarcer resource.. Static spectrum allocation of licensed band by Government has resulted in spectrum scarcity in particular spectrum bands. Moreover, reports by Federal Communications Commission (FCC) show that 70% of the allocated spectrum bands in US are not fully utilized [1]. Hence, dynamic access to spectrum was proposed to solve these spectrum inefficiency problems. Dynamic spectrum allocation enables cognitive radio (CR) users to opportunistically utilize the vacant licensed spectrum bands in either temporal or spatial domain. CR networks, however, impose unique challenges due to the high fluctuations in the available spectrum, as well as the diverse quality of service (QoS) requirements of various applications. Here, we consider optimizing cooperative spectrum sensing with energy detection. The article includes cooperative spectrum sensing, cooperative spectrum sensing optimization, optimal voting rule, ideal threshold and rapid spectrum sensing techniques
1.1 System Modeling
A] Spectrum Sensing
We consider the cognitive network with K quantity of CRs, one primary user and one fusion centre (i.e.
famous receiver).The spectrum sensing is separately performed by each CR.CR's choices are sent to the fusion centre and then the fusion centre decides whether the main user is present or absent. Two hypotheses are considered [1].
H0: The primary user is absent.
H1: The primary user is in operation.
When each ith CR receives the signal, two hypotheses
follow as above. Then the signal will be obtained as
{
(1.1)
where,
x t
i( )
is the received signal at the thi
CR in time slot t ,s t
i( )
is the PU signal. Theh t
i( )
shows the complexchannel gain between PU and ith CR with the node.
( )
i
w t
is the AWGN (Additive White Gaussian Noise).Assume that the sensing time is smaller than the coherence time of the channel. Then, the sensing channel can be viewed as time-invariant during the sensing process. Assume that the sensing time is smaller than the coherence time of the channel. Then, the sensing channel can be viewed as time-invariant during the sensing process.
© 2019, IRJET | Impact Factor value: 7.211 | ISO 9001:2008 Certified Journal
| Page 3332
C
R
C
R
P
U
Common
Receiver
C
R
C
R
Fig-1: System Modelmethod is optimal for detecting zero-mean constellation signals [13]. We are going for the method of energy detection as the PU signal is unknown. We discover average detection probability, probability of missed detection and probability of false alarm over the AWGN channel with the following equations for each CR by energy detection [1];
( )
(1.2)
√
√
(1.3)(1.4)
Where,
iis the energy detection threshold and
iis theinstantaneous signal to noise ratio (SNR) at the th
i
CR.Also u is the energy detector's time bandwidth product,
( )
a
is the gamma function and
( , )
a x
is the incomplete gamma function isequal to∫
(1.5)
The generalised Marcum Q-function i.e.
Q a b
u( , )
is given by [1];∫
(1.6)
Where
I
u1(.)
is the first kind and orderu
1
modified Bessel function.Cooperative spectrum sensing, where number of CRs make binary decisions Di based on local observation and
forward a bit of decision to the common recipients. These choices are summarized at the common recipient and will determine whether the PU is present or in operation [1].
∑
{
(1.7)
Y is the threshold representing the rule "n-out - of-K." If the amount of CR is one, i.e. n=1 it corresponds to the rule of OR and if n = K it relates to the rule of AND.
We find the distance between any two cognitive radios to be lower than the range between one CR and PU in the radio frequency setting around CR's. The signal obtained at each CR therefore follows the same path loss. For AWGN
channel,
1
2
...
kand for Rayleigh fadingchannel
1,
2...
kbecause we suppose it isautonomous and distributed identically (i.i.d) with instant SNRs. These SNR's are also i.i.d. random variables with the same mean distributed exponentially. We take another hypothesis that each CR threshold is the same and that it is
the same
1
1
2
3
...
.
As threshold is constant for all CR,P
f i, will be independent of i , therefore,
f i
P
=P
f . For AWGN channel,P
d i,is independent of i andwe denoted as
P
d. In Rayleigh fading channel,P
disP
d i, averaged over the different values of
1 [1-3].Using the average probability of each CR, the prevalent receiver calculates false alarm probability and missed detection probability. The probability of false alarm is provided by[1],
(
)
{
}
(1.8)Also, the missed detection probability is given by;
(
)
{
}
(1.9)2. OPTIMIZATION OF COOPERATIVE SPECTRUM
SENSING
We evaluate ideal voting rule, optimization of CR number and detection threshold with cooperative spectrum sensing in this section.
2.1 Optimal Voting Rule
© 2019, IRJET | Impact Factor value: 7.211 | ISO 9001:2008 Certified Journal
| Page 3333
Statement 1: To find nopt the minimum error rate valuethat we suggested as follows;
(
)
(1.10)Where,
(1.11)
Proof:
From equation 7 and 8, we get,
(
Q
f
Q
m) 1
G n
( ).
For optimal value of n, error rate should be minimum, [1] i.e.
(1.12)
Therefore, the difference is given by
G n
(
1)
G n
( )
(1.13)
∑ (
) [
]
∑ (
) [
]
(1.14)
(
) [
]
(1.15)i.e. only l = n term remains
(1.16)
(1.17)
On simplifying, we get
*
+
(1.18)Where,
(1.19)
We get certain values for n from equation 9;
a) If Pf and Pm are of same order then α ≈ 1 and n=K/2
b) If Pf ≤ Pm k-1 results in Pf<<Pm for large K then α ≥ K-1
and n=1 i.e. OR rule.
c) If Pm << Pf then α tends to zero and n=K i.e. AND rule.
2.2 Optimal Energy Detection Threshold
Here we find that K, n and SNR are then known what the optimum threshold π * will be to minimize the complete error rate. We have plotted distinct limit values for the complete error rate curve in Figure 1.Figure has the small error rate for specified n for only one threshold value. That is to say, there is one and only value λ for which
(
Q
f
Q
m)
is minimum [1]{
}
(1.20) For optimal energy threshold;
(1.21)
∑
(
)
∑
(
)
(1.22)
(
)
∑
(
)
(1.23)
2.3 Optimal Number of Cognitive Radios
© 2019, IRJET | Impact Factor value: 7.211 | ISO 9001:2008 Certified Journal
| Page 3334
(
Q
f
Q
m)
.
where
is the target error bound. Aspreviously indicated for optimum voting rule[1],
(
*
+)
(1.24)Here, K* (1≤K*≤K) is the least number of CR’s to satisfy
target error bound
(
Q
f
Q
m)
.
and
is calculated from, Pf, Pm, and known SNR and
values. We define thefunction,
(1.25)
Where k is the amount of collaborative spectrum sensors and opt
k
n
Is calculated from above. The probabilityQ
f andm
Q
are functions of k and opt kn
. Therefore we get;
(1.26)
We can use the above equations k* = [k0], Where k0 is the
function's first zero crossing point F( k, opt k
n
) in terms of k. Hence, it is possible to implement quick sensing algorithms by considering only k* CR's instead of K. Thisdecreases the time slot from K to k * to keep the target error bound for the prevalent receiver.
3. System Modelling With Energy Detection of Signal
Here, the signal energy is calculated and false alarm and detection probability is calculated. [92-94]. First, we define separate AWGN channel threshold values and calculate the energy obtained from the signal. If energy of received signal is
x t
1( )
s t
( )
w t
( ),
then the energy of1
( )
x t
is calculated, also if received signal isx t
2( )
w t
( ),
then energy of
x t
2( )
is calculated. If energy ofx t
1( )
is higher than the limit value then the likelihood of detection and if the energy of thex t
2( )
is higher than the limit value then the likelihood of false alarm [2].
∑
(1.27) And
∑
(1.28)where N02is the two sided noise power spectral density [2]
and is given by;
∑
(1.29)
The SNR values are allocated exponentially for the Rayleigh Fading Channel. We consider SNR values with the same mean to be an exponential random number. We used Rayleigh to determine the fading channel gain [3]
√
(1.30)
Then we discover the authority of two sides of the noise [3]
{ ∑ }
(1.31)
Then using this value of 02 N and equation (31) we calculated the energy of the received signal and find probability of false alarm and detection using threshold values.
The energy becomes in Rayleigh Fading Channel;
∑
(1.32)
3 ROC of AND under AWGN
A. Energy Detector
The ED is the simpler method in CRN for spectrum sensing. In a determined spectrum bandwidth, it merely estimates the energy content. The statistical test connected with this is formulated as
| |
(1.33)
Such statistical tests are likened to a threshold level
(
√
√
)
(1.34)
Where the statistical test is lower than the limit λ, the SU selects an idle channel, otherwise the channel will be busy and the SU will not broadcast.
Sensing-time vs. Throughput problem formulation
The likelihood of fake alarm
p
f(.)
and detection© 2019, IRJET | Impact Factor value: 7.211 | ISO 9001:2008 Certified Journal
| Page 3335
approach, associated with the ED can be formulated as afunction of the sensing time parameter τ.
√
√
(1.35)
(
√
√
)
(1.36)
where
p
d andp
f The likelihood of detection targetand false alarm target, respectively, and the essential function of the Gussian probability density is described as
√
∫ (
)
(1.37)
The π threshold value can be associated with the detection probability as [5].
(
√
)
(1.38)When there are distinct channel occupancy probability values, then eq. (1.17) Available to:
( √
)
(1.39)where 1
(
)
r p
P H SNR
. The value ofSNR
p is weighted to 1(
)
r
P H
, Which is the channel's likely to be busy.As a consequence, in the lack and in the presence of the PU, the throughput of the SU is provided.
(1.40)
(
)
(1.41)Where C0 is the SU's output when operating in the absence
of the PU and C1 is the SU's output when operating in the
presence of the PU. Obviously, the value of C0 is always
larger than the value of the C1, i.e The PU signal interferes
with the throughput when the channel is busy. The first and third scenarios therefore contribute to the relationship between sensing and performance [5]
(1.41)
(1.42) In the first case, the PU is not present then SU not generate
false alarm. For the second case PU signal is active. Hence,
0
( )
B
andB
1( )
represent the SU throughput dependent on the sensing-time duration (τ < T) when PU is absent and present, respectively. The probabilities for occurrence of the first and third scenarios are given by [5]Pr(correct detection) = [1 − Pf (τ )] · Pr(H0) (1.43)
Pr(miss detection) = [1 − Pd(τ )] · Pr(H1) (1.44)
where 0
(
)
r
P H
and 1(
)
r
P H
The channel is likely to be idle and busy (linked to first and third situations). The probability(1
P
d( ))
is called the likelihood of miss detection. So, the throughputR
0( )
andR
1( )
they are respectively for the first and third situations.(1.45)
(1.46) Finally, the complete SU network output is provided by
(1.47)
The throughput is provided by eq for the ED spectrum sensing case. (1.26) [5], next page at the top. To simplify, we find the channel's probability to be small, i.e 1
(
)
r
P H
≤0.2 And the second word of the performance feature in (4.27) becomes meaningless and can be simplified as
√
√
(1.48)
Finally, the issue of streamlined optimization of sensing-throughput (STO) can be articulated as
(1.49)
(1.50)
(1.51)
Where Pd = 0.9 is the IEEE 802.22 WRAN detection target
© 2019, IRJET | Impact Factor value: 7.211 | ISO 9001:2008 Certified Journal
| Page 3336
4. Result and DiscussionIn figure.1, by maintaining SNR=10 db, we discovered error rate for various threshold values and amount of CR's. The error rate in the figure is small for n=5 and high for n=10 and n=1.i.e. We can achieve a small error rate with 5 CRs out of 10. This figure explains the optimal rule. The error rate is nothing but
. That is the likelihood of missed detection and if very few or high amount CR's are used, the false alarm probability is high.Thus the number of CRs used should be half of the total CR's, i.e. for n=5 the likelihood of missed detection and false alarm probability is low, so cooperative spectrum sensing allocation is done correctly. We also compare the outcomes of modeling and modeling by modeling the system. We compare outcomes obtained from n = 5 modeling and formulae. The two outcomes are the same. We use the equations described in section 3 for modeling.
As of MATLAB Optimization Toolbox. The numerical solutions discussed in this system confirm that the maximum is a global optimum and the objective function is a concave function.
Figure 1: Complementary ROC curves for local spectrum sensing under AWGN and Rayleigh channel with m = 10
Comparing the values of Pd with values of threshold one
can see that different values of threshold implies in values of Pd ≥ 0.9, which respects the constraints. Comparing
values of Pd with values of Ns and values of sensing time, it
is possible to conclude that for values of Ns ≥ 15600
[image:6.595.334.536.64.373.2]samples, implies in values of Pd above 0.9, with no violation of the constraints limits. Hence, we concluded that the obtained solution respect the constraint of the optimization problem, in addition to maximize the throughput of the SU
[image:6.595.81.249.379.508.2]Figure 2: Energy Detection Graph
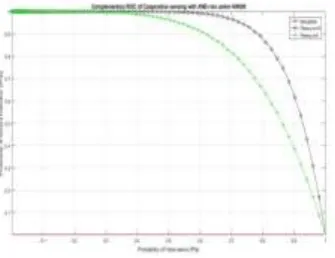
Figure 3: Complementary ROC curves for cooperative spectrum sensing using AND-rule under Rayleigh channel
with m = 10 and SNR = -10 dB.
In the figure.1, we found error rate for different threshold values and number of CR’s by keeping SNR=10 db. In figure, the error rate is low for n =5 and it is high n =10 and
n =1.i.e. with use of 5 CR’s out of 10 we can achieve low error rate. This figure explains the optimal rule. The error rate is nothing but
(
Q
f
Q
m)
. That is probability of missed detection and false alarm probability is high if very few or high number CR’s are used. So the number of CR’s used should be half of total CR’s, i.e. for n=5 the probability of missed detection and false alarm probability is low, so cooperative spectrum sensing allocation is done in correct way. Also, by modeling the system, we compare results get from modeling and formulae for n =5. The both results are same. For modeling, we use equations explained in section 4.We discovered optimum value of ' n ' i.e. ' n from K ' CR's in figure.2.We differ limit values from 10 to 40 and we discovered ideal value of ' n ' from equation 9 for distinct SNR values (0dB, 5dB, 10dB).From the graph we conclude that the necessary amount of CR's is more for low threshold value with low SNR.As we raise the limit value with low or equal SNR, we need very less CR. The ideal value of n also rises as SN rises. E.g. If SNR= 0dB and = 33, the ideal value of n is 1.We can attain a small error rate with 1 CR.© 2019, IRJET | Impact Factor value: 7.211 | ISO 9001:2008 Certified Journal
| Page 3337
likelihood for elevated threshold value with fewer CRs.This probability also decreases in AWGN channel by reducing SNR values for a tiny amount of ' n '
Chart 4: Total error rate of cooperative spectrum sensing in AWGN channel with 10dB SNR. Optimal voting rule for
n=1,2,...,10 and K=10.
5. CONCLUSION
The cooperative energy detection spectrum sensing using formula and system modeling was researched. Analysis of the scheme has been performed with optimum voting rule for minimum error rate and K/2 is the optimum value. In addition, threshold optimization was performed with minimum probability values for missed detection and false alarm probability. System analysis has been performed for the less likelihood of missed detection and false alarm probability, so the spectrum has been properly allocated to secondary consumer. The quick sensing algorithm was suggested and the smallest number of CR's calculated for a specified error bound. With quick sensing algorithm, the intolerably lengthy sensing time has been eliminated.
REFERENCES
[1] Wei Zhang, Member, IEEE, Ranjan K. Mallik, Senior Member, IEEE, and Khaled Ben Letaief, Fellow, IEEE “Optimization of Cooperative Spectrum Sensing with Energy Detection in Cognitive Radio Networks”, IEEE transactions on wireless communications, vol. 8, no. 12, December 2009.
[2] Harry Hrkowitz, Member, IEEE, “Energy Detection of Unknown Deterministic Signals” Proceeding of the IEEE, Vol. 55,Issue no.4 , 1967, Pg.No. 523 –531.
[3] Fadel F. Digham, Member, IEEE, Mohamed-Slim Alouini, Senior Member, IEEE, and Marvin K. Simon, Fellow, IEEE,“ On the Energy Detection of Unknown Signals Over Fading Channels”, IEEE transactions on communications, vol. 55, no. 1, January 2007.
[4] Fadel F. Digham, Mohamed-Slim Alouini, and Marvin K. Simon, “On the Energy Detection of Unknown Signal over Fading Channels”, Communications, 2003, ICC '03.
IEEE International Conference on, pg. no. 3575 – 3579, vol.5, 11-15 May 2003.
[5] Federal Communications Commission, “Spectrum Policy Task Force", Rep. ET docket no. 02-135, Nov. 2002.
[6] Danijela Cabric, Shridhar Mubaraq Mishra, Robert W. Brodersen, Berkeley Wireless Research Center, University of California, Berkeley, “Implementation Issues in Spectrum Sensing for Cognitive Radios”,
[7] Marvin K. Simon Mohamed-Slim Alouini, “Digital Communication over Fading Channels”, A Unified Approach to Performance Analysis A Wiley- Interscience Publication JOHN WILEY & SONS, INC.
[8] M. A. McHenry, “NSF Spectrum Occupancy Measurements ProjectSummary,” Shared Spectrum Company, Aug. 2005.
[9] M. A. McHenry, P. A. Tenhula, D. McCloskey, D. A. Roberson, and C.S. Hood, “Chicago Spectrum Occupancy Measurements & Analysis anda Long-term Studies Proposal.” the First ACM International Workshopon Technology and Policy for Accessing Spectrum, 2006.
[10] F. Khan and K. Nakagawa, “Comparative Study of Spectrum SensingTechniques in Cognitive Radio Networks,” 2013 World Congress onComputer and Information Technology (WCCIT), Sousse, pp. 1-8, 2013.
[11] J. Mitola and G. Q. Maguire, “Cognitive Radio: Making SoftwareRadios More Personal,” IEEE Personal Communications, vol. 6, no. 4,pp. 13-18, Aug 1999.