http://www.scirp.org/journal/ojf ISSN Online: 2163-0437
ISSN Print: 2163-0429
DOI: 10.4236/ojf.2018.82015 Apr. 20, 2018 205 Open Journal of Forestry
Estimating Individual Tree Diameter and Stem
Volume Using Airborne LiDAR in Saga
Prefecture, Japan
Katsumasa Oono
1,2, Satoshi Tsuyuki
11Department of Global Agricultural Sciences, The University of Tokyo, Tokyo, Japan 2Forest & Agriculture Solution Department, Asia Air Survey CO., LTD., Kanagawa, Japan
Abstract
Advancements in airborne LiDAR analysis technology have made it possible to quantify forest resource volumes based on individual trees, and such tech-nology may soon replace field surveys. Unlike individual tree detection or tree height measurements, diameter at breast height (DBH) is difficult to deter-mine directly from measured data and is instead estimated indirectly using the correlation between crown size and DBH. Indicators that represent crown size include crown area, surface area, length, and length ratio, and were uti-lized with tree height as explanatory variables in ten combinations to deter-mine a regression formula. DBH and tree height calculated from the regres-sion formula were applied to an equation to calculate stem volumes of indi-vidual trees. Airborne LiDAR measurements were taken using ALS50-II and ALS60 (Leica) at a density of 4 points/m2. An evaluation of the relationship
between the regression formulae and DBH estimates indicated that a combi-nation of crown area, tree height, and crown ratio for Japanese cedar, and a combination of crown area and tree height for Japanese cypress, yielded the highest coefficients of determination. The average error and RMSE were 6.9% and 2.38 cm respectively for Japanese cedar, while the corresponding values for Japanese cypress were 8.35% and 2.51 cm. Once the relationship was ex-tended to the stem volumes of individual trees, the average error was 14.4% and RMSE was 0.10 m3 for Japanese cedar. The corresponding values for
Jap-anese cypress were 18.9% and 0.10 m3. These results demonstrate the potential
use of airborne LiDAR as a substitute for field surveys.
Keywords
Airborne LiDAR, Diameter at Breast Height, Individual Treevolume, Forest Resource, Individual-Tree-Based Approach
How to cite this paper: Oono, K., & Tsuyuki, S. (2018). Estimating Individual Tree Diameter and Stem Volume Using Airborne LiDAR in Saga Prefecture, Japan. Open Journal of Forestry, 8, 205-228. https://doi.org/10.4236/ojf.2018.82015
Received: January 23, 2018 Accepted: April 17, 2018 Published: April 20, 2018
Copyright © 2018 by authors and Scientific Research Publishing Inc. This work is licensed under the Creative Commons Attribution International License (CC BY 4.0).
DOI: 10.4236/ojf.2018.82015 206 Open Journal of Forestry
1. Introduction
Remote sensing can be employed to efficiently survey forest resources. Research using airborne LiDAR has made significant progress recently. For example, Li-DAR can be used to determine the location and tree height of individual trees based on their crown height, which is represented by the unevenness in crown size
(Hyyppa, 2001; Oono, Numata, & Hirano, 2008; Popescu, Wynne, & Nelson, 2002). Individual tree detection is most suitable to conifers because identifying individual crowns is easier than in the case of broad-leaved trees. Importantly, there is a possibility that such detection from laser-based analysis could replace field surveys in Japan, where the percentage of conifers exceeds 50%. This appli-cability for Japanese cedar and Japanese cypress is crucial, as they constitute ap-proximately 70% of all conifers. However, to utilize the method as a substitute for field surveys, estimations of diameter at breast height (DBH) and stem vo-lume are needed in addition to information on the number of trees and tree height.
While DBH cannot be measured directly from airborne remote sensing data, studies have reported a correlation between DBH and crown diameter (Bechtold, 2004; Hemery, Savill, & Pryor, 2005), and it is possible to indirectly estimate DBH based on remote sensing data. For example, one study used crown diame-ter and tree height as variables for spruces and pines to estimate DBH using aerial photographs (Hall, Morton, & Nesby, 1989). A comparison of the results from 12 models showed that DBH estimates can be accurate. A Japanese re-searcher reported a method for estimating average DBH per hectare from forest data (e.g., tree height and sparsity) and topographic information (e.g., slopes and altitude, obtained from aerial photographs for major tree species, including Jap-anese cedar and JapJap-anese cypress) (Nakajima, 1973). To estimate DBH using airborne LiDAR, subsequent studies have estimated DBH by combining charac-teristics such as crown area and length to determine the relationship between tree crown size and tree height (Verma, Lamb, Reid, & Wilson, 2014; Yao, Krzystek, & Heurich, 2012).
While these studies have shown that several explanatory variables can be used to estimate DBH, explanatory variables appropriate for Japanese cedar and Jap-anese cypress from airborne LiDAR are unknown. In addition, few studies have considered the potential utility of the regression formula used for estimating DBH as a general expression that can be applied across a broad study area, such as an entire prefecture. Therefore, this study considered a regression formula suitable for DBH estimates of Japanese cedar and Japanese cypress, and its use over a broad area. Thus, this work considers appropriate explanatory variables for estimating DBH by performing regression analyses using multiple explana-tory variables, such as crown sizes, obtained from airborne LiDAR analysis.
DOI: 10.4236/ojf.2018.82015 207 Open Journal of Forestry uses indicators, such as tree height and crown area, included in an arbitrarily given area; these are known as distribution-based approaches (Heurich, Persson, Holmgren, & Kennel, 2004; Takahashi et al., 2008; Yao, et al., 2012). The other method uses individual-tree-based approaches, in which stem volume is com-puted by applying tree heights obtained from individual tree detection and DBH estimates obtained from LiDAR analysis to an existing stem volume equation
(Heurich, et al., 2004; Hyyppä et al., 2005; Persson, Holmgrem, & Söderman, 2002). Distribution-based approaches are problematic while using airborne Li-DAR as a substitute for conventional field surveys because the stem volumes of individual trees cannot be obtained; this information is obtained from field sur-veys. To address this problem, this study calculated stem volume based on indi-vidual trees, and considered the possibility of assessing resources using airborne LiDAR analysis as a substitute for field surveys. In addition, the study considered the impact of multiple DBH estimates obtained from DBH regression analyses for stem volume estimates, and aimed to identify explanatory variables for DBH estimation appropriate for the estimation of stem volume.
2. Methods and Data
2.1. Study Site and LiDAR Data
The study area spans 64,000 ha of planted forest in Saga Prefecture, and consists of Japanese cedar and Japanese cypress, which occupy approximately 67% of the forest area. Most soil in Saga Prefecture is derived from granites in the northern mountainous areas and central part of the prefecture, and lands appropriate for afforestation of Japanese cedar are distributed predominantly over this area. Japanese cypress forest is distributed predominantly in the east where the soil is dry. Clayey soils are distributed predominantly across the southern part of the prefecture, which is appropriate for Japanese cypress. Higashi Matsuura Penin-sula is unfavorable for tree growth because of the broad manifestation of basalt lava flow over the plateau, and the soil is strongly clayey with shallow surface soil. Japanese cedar and Japanese cypress dominate Saga Prefecture, and both are major tree species in planted forest. Their complex soil environments provide an advantage in the quantity of forest resources that can be obtained under diverse conditions.
ALS50-II and ALS60 from Leica were used as the airborne LiDAR in this study. LiDAR measurements were taken between July and November 2011 in the Eastern and Western districts. The Eastern district has 483 courses, and the Western, 624 courses, totaling to 1107 courses. The LiDAR measurement density was approximately 4 points/m2 for both districts.
DOI: 10.4236/ojf.2018.82015 208 Open Journal of Forestry high and low, in the Western district. For the low altitude measurements, flight height above ground was 1000 - 1450 m, velocity with respect to the ground was 222 km/h, pulse rate of the laser was 60,000 Hz, scan rate was 35.9 Hz, field of view was ±18˚, beam divergence was 0.22 mrad, and side overlap ratio was 60%. For high altitude measurements, flight height above ground was 1231 - 1981 m, velocity with respect to the ground was 203 km/h, pulse rate of the laser was 31,000 Hz, scan rate was 46.2 Hz, field of view was ±12.5˚, beam divergence was 0.22 mrad, footprint size was 27 - 44 cm, and side overlap ratio was 60%.
A Digital Canopy Surface Model (DCSM) composed of pulses reflected on the canopy surface and Digital Elevation Model (DEM) composed of pulses reflected on the ground surface were created with a 50-cm grid size based on the obtained airborne laser measurement data. The difference between the DCSM and DEM was computed to derive the (Digital Canopy Height Model (DCHM).
[image:4.595.212.540.501.693.2]2.2. Study Overview
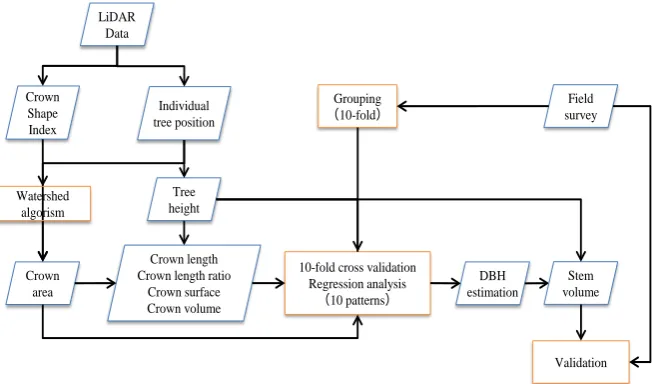
Figure 1 shows the data used to estimate DBH and individual tree stem volume
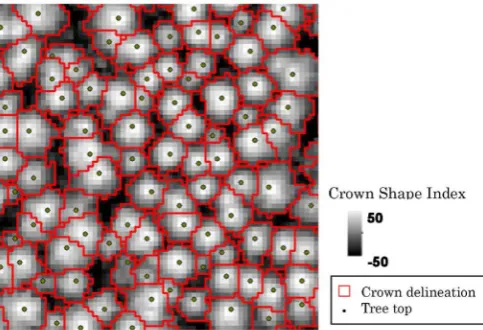
in a flow chart of the study. Based on locations of the vertexes of individual trees detected using the method in Oono et al. (2008), and an indicator that represents the unevenness of the crown surface, called the crown shape index (Oono et al., 2008), crowns were delineated using the Watershed algorithm (Soille, 2013). This index was used as the crown area of an individual tree. In addition, crown length, length ratio, surface area, and volume were calculated and utilized, along with tree height, as explanatory variables in the DBH estimates. Field survey re-sults were divided into ten groups of Japanese cedar and Japanese cypress. For nine of the ten groups, regression analyses were performed to estimate DBH. Here, to identify explanatory variables appropriate for estimating DBH, one to three indicators were selected from six indicators for the regression analysis that estimated DBH, for a total of ten patterns. Ten patterns of regression formula
Figure 1. Study flow chart showing the primary steps in the DBH estimation and stem volume calculation.
Individual tree position
Field survey
10-fold cross validation Regression analysis
(10 patterns) Crown
area
Tree height
Grouping
(10-fold)
Crown length Crown length ratio
Crown surface Crown volume
DBH estimation Crown
Shape Index
Watershed algorism
Stem volume
Validation LiDAR
DOI: 10.4236/ojf.2018.82015 209 Open Journal of Forestry were developed, and a total of 100 regression formulae were devised using a10-fold cross-validation. DBH was calculated using the regression formula with the highest coefficient of determination obtained from the respective results. Next, stem volumes of individual trees were calculated from individual tree heights and DBH using the existing volume equation to validate the accuracy.
2.3. Field Survey Data Used for the Regression Analysis
Field surveys used for regression analysis validation were conducted at 129 plots for Japanese cedar and 126 plots for Japanese cypress. Field survey points were distributed throughout the prefecture, taking into consideration geological con-ditions and tree growth stages. The survey period ranged from September 28, 2011 to February 25, 2012, conducted over almost the same period as the air-borne LiDAR observations. The survey sites were chosen such that the selected forest stands contained plots of single tree species and there was little variation in tree height or DBH within the plot. A survey at each point was performed for a circular 0.04 ha plot, and the coordinates of the center were measured by GPS. For tree height, a representative tree was measured by VertexIV. Then, the tree height curvature was determined, and the heights of the remaining trees were es-timated from the DBH obtained from the field surveys. To calculate stem vo-lume, a volume equation for the Kyushu region (Forestry Agency, 1970) was used and calculated using tree height and DBH as variables. The volume equa-tions are written follows.
Japanese cedar (excludes Obi and Yakushima, adjusted 1962)
(
)
(
)
log 5 0.796182 1.819629 log 1.025738 log 4 32
log 4 0.0754761 1.6644424 log 0.9881512 log 32
V d h d
V d h d
= − + + + ≤ <
= − + + + ≤ (1)
Japanese cypress (adjusted 1961)
(
)
(
)
(
)
log 5 0.87211 1.93699 log 0.81243log 4 12
log 5 0.682931 1.921617 log 1.016795 log 12 22
log 5 0.7985347 1.7862040 log 1.0696647 log 22
V d h d
V d h d
V d h d
= − + + + ≤ <
= − + + + ≤ <
= − + + + ≤
(2)
where V is the stem volume of an individual tree (m3), d is the DBH (cm), and h
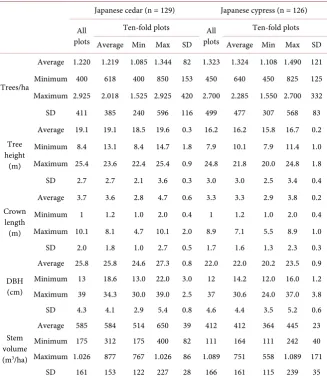
is the tree height (m). Table 1 is a list of field survey results.
DOI: 10.4236/ojf.2018.82015 210 Open Journal of Forestry
Table 1. Characteristics of survey plots and ten-fold plots.
Japanese cedar (n = 129) Japanese cypress (n = 126)
All plots
Ten-fold plots All
plots
Ten-fold plots
Average Min Max SD Average Min Max SD
Trees/ha
Average 1.220 1.219 1.085 1.344 82 1.323 1.324 1.108 1.490 121
Minimum 400 618 400 850 153 450 640 450 825 125
Maximum 2.925 2.018 1.525 2.925 420 2.700 2.285 1.550 2.700 332
SD 411 385 240 596 116 499 477 307 568 83
Tree height
(m)
Average 19.1 19.1 18.5 19.6 0.3 16.2 16.2 15.8 16.7 0.2
Minimum 8.4 13.1 8.4 14.7 1.8 7.9 10.1 7.9 11.4 1.0
Maximum 25.4 23.6 22.4 25.4 0.9 24.8 21.8 20.0 24.8 1.8
SD 2.7 2.7 2.1 3.6 0.3 3.0 3.0 2.5 3.4 0.4
Crown length (m)
Average 3.7 3.6 2.8 4.7 0.6 3.3 3.3 2.9 3.8 0.2
Minimum 1 1.2 1.0 2.0 0.4 1 1.2 1.0 2.0 0.4
Maximum 10.1 8.1 4.7 10.1 2.0 8.9 7.1 5.5 8.9 1.0
SD 2.0 1.8 1.0 2.7 0.5 1.7 1.6 1.3 2.3 0.3
DBH (cm)
Average 25.8 25.8 24.6 27.3 0.8 22.0 22.0 20.2 23.5 0.9
Minimum 13 18.6 13.0 22.0 3.0 12 14.2 12.0 16.0 1.2
Maximum 39 34.3 30.0 39.0 2.5 37 30.6 24.0 37.0 3.8
SD 4.3 4.1 2.9 5.4 0.8 4.6 4.4 3.5 5.2 0.6
Stem volume
(m3/ha)
Average 585 584 514 650 39 412 412 364 445 23
Minimum 175 312 175 400 82 111 164 111 242 40
Maximum 1.026 877 767 1.026 86 1.089 751 558 1.089 171
SD 161 153 122 227 28 166 161 115 239 35
2.4. Explanatory Variables Used in the Regression Formula to
Estimate DBH
For the regression formula to estimate DBH, six explanatory variables were pre-pared, including tree height, and indicators of crown size, including crown area, surface area, volume, length, and length ratio. For h (m), individual tree height determined using the method described in Oono et al. (2008) was used. Crown area Ca (m2) was extracted by inverting the crown shape index, treating the tree
vertex as the lowest point in the crown, and the crowns were delineated using the Watershed algorithm from individual tree detection results. Crown delinea-tion was performed as shown Figure 2.
Crown length Cl (m) was calculated from the difference between the maxi-mum and minimaxi-mum DCHM values within a single crown area. Figure 3 shows an example calculation of crown length. In addition, using tree height h and Cl, the crown length ratio Cr (%) was calculated using Equation (3).
100
Cl Cr
h
DOI: 10.4236/ojf.2018.82015 211 Open Journal of Forestry
Figure 2. Example of crown delineation using the watershed algo-rithm (1 pixel: 50 cm).
Figure 3. Example of crown length calculation; points in the left figure show the DCHM and match points corresponding to the crown shape in the right cross-section.
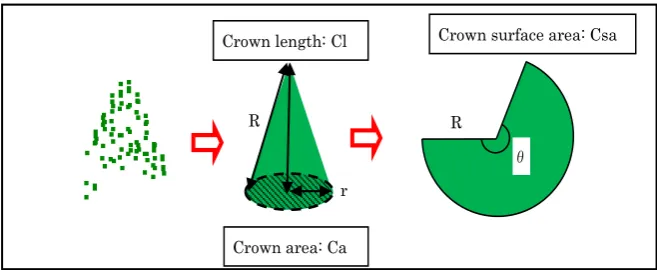
The crown surface area Csa (m2) and crown volume Cv (m3) were calculated
assuming that tree crowns are conical. Based on the approach shown inFigure 4, the crown surface area was calculated from crown area and crown length using Equation (4). Crown volume was calculated using Equation (5).
2 2 and
360 360
r
R r
R
θ θ
π = π =
2
and Ca
Ca πr r
π
= =
2
2 2 2 2 2 2
and Ca Ca Cl
r Cl R R r Cl Cl π
π π
+
+ = = + = + =
(
)
2
2
2 360
Csa R
rR
Ca Ca Cl
Ca Ca Cl
θ π π
π π
π π
π =
=
+ =
= +
[image:7.595.208.538.279.426.2]DOI: 10.4236/ojf.2018.82015 212 Open Journal of Forestry
Figure 4. Method used to calculate the crown surface.
where θ is the center angle (˚) of the sector from conical tree crown, R is the ra-dius of conical slope length (m), and r is the radius of the bottom of the cone (m).
3
Ca Cl
Cv= × (5)
2.5. Regression Analysis and Stem Volume Calculation Methods to
Estimate DBH and Validate the Accuracy
The regression analysis was validated ten times using ten-fold cross validation, and ten patterns of regression formula were developed each time. A total of 100 regression formulae were developed. Nine of the ten groups of field survey plots (Japanese cedar: 116 - 117 plots, Japanese cypress: 113 - 114 plots) were used to develop regression formulae, and the remaining group was used to validate ac-curacy. Equation (6) was used to determine the regression formula, which was based on the allometry theory (Ketterings, Coe, van Noordwijk, Ambagau’, & Palm, 2001; Nielsen, Aldred, & MacLeod, 1979).
1 2 3
1 2 3
DBH =αXβ Xβ Xβ (6) Where X represents individual explanatory variables. Ten patterns of regression formula were considered using combinations of one to three explanatory va-riables hypothesized as ideal to estimate DBH. X2 and X3 were not used for cases
in which only one explanatory variable was applied.
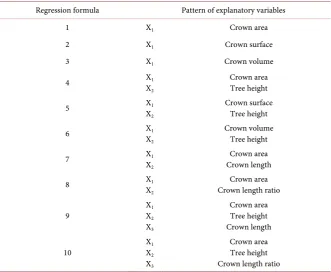
Combinations of explanatory variables across ten patterns are shown in Table 2, which were based first on tree crown size, and then combined with tree height. The tree crown height information, including tree height, crown length, and crown length ratio were combined with crown area.
DBH, the objective variable of regression formula, was calculated using the average value from field survey plots. The average value was calculated per plot for individual tree crown area, an explanatory variable, obtained from LiDAR analysis, and a regression analysis was performed using the average survey plot value. DBH for an individual tree was computed by substituting the group ex-planatory variable preserved for accuracy validation into the regression formula with the highest coefficient of determination; the accuracy was validated by
Crown area: Ca Crown length: Cl
R
r
Crown surface area: Csa
θ
DOI: 10.4236/ojf.2018.82015 213 Open Journal of Forestry
Table 2. Pattern of explanatory variables for the regression analysis.
Regression formula Pattern of explanatory variables
1 X1 Crown area
2 X1 Crown surface
3 X1 Crown volume
4 X1 X2 Crown area Tree height
5 X1 X2 Crown surface Tree height
6 X1 X2 Crown volume Tree height
7 X1 X2 Crown length Crown area
8 X1 X2 Crown length ratio Crown area
9 X1 X2
X3
Crown area Tree height Crown length
10 X1 X2
X3
Crown area Tree height Crown length ratio
calculating the average plot DBH. Using this validation process, ten regression formula patterns were obtained from the 100 patterns.
To calculate the stem volume of an individual tree, the volume equation (formulae 1 and 2) from the Kyushu region (Forestry Agency, 1970) was used based on individual tree height and estimated DBH obtained from airborne Li-DAR analysis. To validate the stem volume, the average individual stem volumes (m3) from surveyed plots was calculated and compared with individual tree stem
volumes from field surveys and LiDAR analysis.
3. DBH Estimates Using Tree Crown and Height Data, and
Individual Stem Volume Estimates
3.1. DBH Estimates
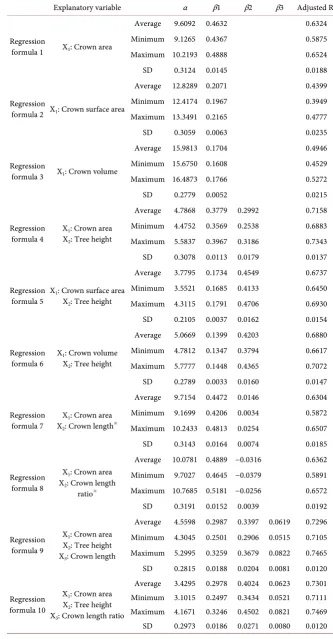
Table 3 and Table 4 show the results from ten regression analysis patterns using ten-fold cross validation for Japanese cedar and Japanese cypress. A high coeffi-cient of determination (corrected R2) was found for the crown surface area,
DOI: 10.4236/ojf.2018.82015 214 Open Journal of Forestry
Table 3. Results of regression analysis for DBH estimation (Japanese cedar).
Explanatory variable α β1 β2 β3 Adjusted R2
Regression
formula 1 X1: Crown area
Average 9.6092 0.4632 0.6324
Minimum 9.1265 0.4367 0.5875
Maximum 10.2193 0.4888 0.6524
SD 0.3124 0.0145 0.0188
Regression
formula 2 X1: Crown surface area
Average 12.8289 0.2071 0.4399
Minimum 12.4174 0.1967 0.3949
Maximum 13.3491 0.2165 0.4777
SD 0.3059 0.0063 0.0235
Regression
formula 3 X1: Crown volume
Average 15.9813 0.1704 0.4946
Minimum 15.6750 0.1608 0.4529
Maximum 16.4873 0.1766 0.5272
SD 0.2779 0.0052 0.0215
Regression
formula 4 X1: Crown area X2: Tree height
Average 4.7868 0.3779 0.2992 0.7158
Minimum 4.4752 0.3569 0.2538 0.6883
Maximum 5.5837 0.3967 0.3186 0.7343
SD 0.3078 0.0113 0.0179 0.0137
Regression
formula 5 X1: Crown surface area X2: Tree height
Average 3.7795 0.1734 0.4549 0.6737
Minimum 3.5521 0.1685 0.4133 0.6450
Maximum 4.3115 0.1791 0.4706 0.6930
SD 0.2105 0.0037 0.0162 0.0154
Regression
formula 6 X1: Crown volume X2: Tree height
Average 5.0669 0.1399 0.4203 0.6880
Minimum 4.7812 0.1347 0.3794 0.6617
Maximum 5.7777 0.1448 0.4365 0.7072
SD 0.2789 0.0033 0.0160 0.0147
Regression
formula 7 X2: Crown lengthX1: Crown area ※
Average 9.7154 0.4472 0.0146 0.6304
Minimum 9.1699 0.4206 0.0034 0.5872
Maximum 10.2433 0.4813 0.0254 0.6507
SD 0.3143 0.0164 0.0074 0.0185
Regression formula 8
X1: Crown area X2: Crown length
ratio※
Average 10.0781 0.4889 −0.0316 0.6362
Minimum 9.7027 0.4645 −0.0379 0.5891
Maximum 10.7685 0.5181 −0.0256 0.6572
SD 0.3191 0.0152 0.0039 0.0192
Regression formula 9
X1: Crown area X2: Tree height X3: Crown length
Average 4.5598 0.2987 0.3397 0.0619 0.7296
Minimum 4.3045 0.2501 0.2906 0.0515 0.7105
Maximum 5.2995 0.3259 0.3679 0.0822 0.7465
SD 0.2815 0.0188 0.0204 0.0081 0.0120
Regression formula 10
X1: Crown area X2: Tree height X3: Crown length ratio
Average 3.4295 0.2978 0.4024 0.0623 0.7301
Minimum 3.1015 0.2497 0.3434 0.0521 0.7111
Maximum 4.1671 0.3246 0.4502 0.0821 0.7469
DOI: 10.4236/ojf.2018.82015 215 Open Journal of Forestry
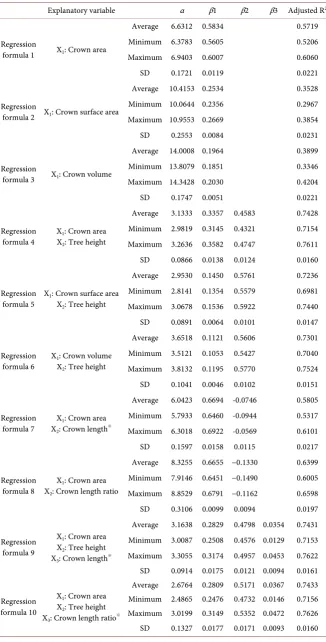
Table 4. Results of regression analysis for estimating DBH (Japanese cypress).
Explanatory variable α β1 β2 β3 Adjusted R2
Regression
formula 1 X1: Crown area
Average 6.6312 0.5834 0.5719
Minimum 6.3783 0.5605 0.5206
Maximum 6.9403 0.6007 0.6060
SD 0.1721 0.0119 0.0221
Regression
formula 2 X1: Crown surface area
Average 10.4153 0.2534 0.3528
Minimum 10.0644 0.2356 0.2967
Maximum 10.9553 0.2669 0.3854
SD 0.2553 0.0084 0.0231
Regression
formula 3 X1: Crown volume
Average 14.0008 0.1964 0.3899
Minimum 13.8079 0.1851 0.3346
Maximum 14.3428 0.2030 0.4204
SD 0.1747 0.0051 0.0221
Regression
formula 4 X1: Crown area X2: Tree height
Average 3.1333 0.3357 0.4583 0.7428
Minimum 2.9819 0.3145 0.4321 0.7154
Maximum 3.2636 0.3582 0.4747 0.7611
SD 0.0866 0.0138 0.0124 0.0160
Regression
formula 5 X1: Crown surface area X2: Tree height
Average 2.9530 0.1450 0.5761 0.7236
Minimum 2.8141 0.1354 0.5579 0.6981
Maximum 3.0678 0.1536 0.5922 0.7440
SD 0.0891 0.0064 0.0101 0.0147
Regression
formula 6 X1: Crown volume X2: Tree height
Average 3.6518 0.1121 0.5606 0.7301
Minimum 3.5121 0.1053 0.5427 0.7040
Maximum 3.8132 0.1195 0.5770 0.7524
SD 0.1041 0.0046 0.0102 0.0151
Regression
formula 7 X2: Crown lengthX1: Crown area ※
Average 6.0423 0.6694 -0.0746 0.5805
Minimum 5.7933 0.6460 -0.0944 0.5317
Maximum 6.3018 0.6922 -0.0569 0.6101
SD 0.1597 0.0158 0.0115 0.0217
Regression
formula 8 X2: Crown length ratio X1: Crown area
Average 8.3255 0.6655 −0.1330 0.6399
Minimum 7.9146 0.6451 −0.1490 0.6005
Maximum 8.8529 0.6791 −0.1162 0.6598
SD 0.3106 0.0099 0.0094 0.0197
Regression formula 9
X1: Crown area X2: Tree height
X3: Crown length※
Average 3.1638 0.2829 0.4798 0.0354 0.7431 Minimum 3.0087 0.2508 0.4576 0.0129 0.7153 Maximum 3.3055 0.3174 0.4957 0.0453 0.7622
SD 0.0914 0.0175 0.0121 0.0094 0.0161
Regression formula 10
X1: Crown area X2: Tree height
X3: Crown length ratio※
Average 2.6764 0.2809 0.5171 0.0367 0.7433 Minimum 2.4865 0.2476 0.4732 0.0146 0.7156 Maximum 3.0199 0.3149 0.5352 0.0472 0.7626
DOI: 10.4236/ojf.2018.82015 216 Open Journal of Forestry p-value of the power of crown length, β2, was greater than 0.05 for both tree species. Compared to regression formula 1, the coefficient of determination did not improve in regression formula 8, where crown length ratio was added to crown area for Japanese cedar, while the p-value of the power of crown length, β2, was greater than 0.05. However, the coefficient of determination did improve for Japanese cypress, albeit not as much as when tree height was added. In re-gression formulae 9 and 10, where crown length and crown length ratio were added to crown area and tree height (regression formula 4), respectively, the coefficient of determination improved compared to regression formula 4 for both Japanese cedar and Japanese cypress; however, the p-value of the power of crown length or crown length ratio, β3, exceeded 0.05.
Regression formula Equations (1)-(6) and (9)-(10) for Japanese cedar, and Equation (10) had p-values less than 0.05 across all evaluations in a ten-fold cross validation; these equations utilized a combination of crown area, tree height, and crown length ratio also yielded the highest coefficients of determina-tion. The p-values were less than 0.05 across all evaluations for regression for-mulae 1 - 6 and 8 for Japanese cypress and Equation (4), which utilized crown area and tree height; these yielded the highest coefficients of determination.
The adjusted R2 can be calculated using the following equation:
(
)
2 2
adjusted 1R n 1 R
n p
= − −
− (7)
Here, n is the sample size, p is the number of explanatory variables, and R2 is
the coefficient of determination.
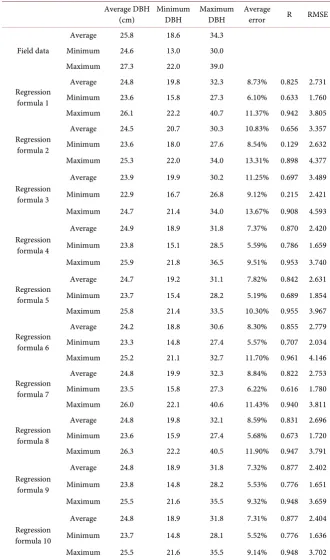
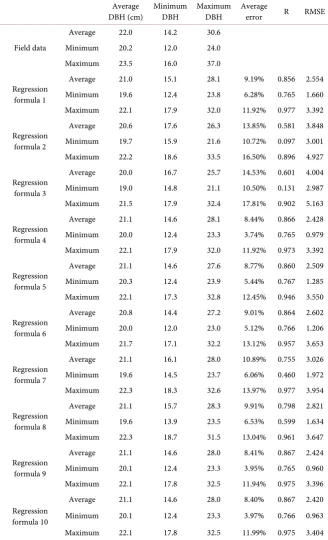
Table 5 and Table 6 show the results comparing field survey values and DBH estimates using ten-fold cross validation. Out of the ten groups, the average, minimum and maximum values were calculated for the group used for valida-tion and compared with the field survey results; the average error (difference in absolute value from the field survey was subtracted and averaged), correlation coefficient R, and RMSE were also calculated. The average, minimum and maximum values of average, minimum, maximum, average error, correlation coefficient and RMSE of ten-fold cross validation are shown in the tables. Re-gression formula 10, which used crown area, tree height, and crown length ratio as explanatory variables yielded the highest coefficient of determination with respect to DBH estimates for Japanese cedar; however, the minimum, maximum and average DBH values obtained from ten-fold cross validation were similar to values obtained using regression formula 9. The average error, correlation coef-ficient, and RMSE were also nearly identical to results obtained from regression formula 9, where the average of average errors was 7.3%, the average of the cor-relation coefficients was 0.877, and the average of the RMSEs was approximately 2.40 cm.
DOI: 10.4236/ojf.2018.82015 217 Open Journal of Forestry
Table 5. Ten-fold cross validation of DBH estimates for Japanese cedar.
Average DBH
(cm) Minimum DBH Maximum DBH Average error R RMSE
Field data
Average 25.8 18.6 34.3
Minimum 24.6 13.0 30.0
Maximum 27.3 22.0 39.0
Regression formula 1
Average 24.8 19.8 32.3 8.73% 0.825 2.731
Minimum 23.6 15.8 27.3 6.10% 0.633 1.760
Maximum 26.1 22.2 40.7 11.37% 0.942 3.805
Regression formula 2
Average 24.5 20.7 30.3 10.83% 0.656 3.357
Minimum 23.6 18.0 27.6 8.54% 0.129 2.632
Maximum 25.3 22.0 34.0 13.31% 0.898 4.377
Regression formula 3
Average 23.9 19.9 30.2 11.25% 0.697 3.489
Minimum 22.9 16.7 26.8 9.12% 0.215 2.421
Maximum 24.7 21.4 34.0 13.67% 0.908 4.593
Regression formula 4
Average 24.9 18.9 31.8 7.37% 0.870 2.420
Minimum 23.8 15.1 28.5 5.59% 0.786 1.659
Maximum 25.9 21.8 36.5 9.51% 0.953 3.740
Regression formula 5
Average 24.7 19.2 31.1 7.82% 0.842 2.631
Minimum 23.7 15.4 28.2 5.19% 0.689 1.854
Maximum 25.8 21.4 33.5 10.30% 0.955 3.967
Regression formula 6
Average 24.2 18.8 30.6 8.30% 0.855 2.779
Minimum 23.3 14.8 27.4 5.57% 0.707 2.034
Maximum 25.2 21.1 32.7 11.70% 0.961 4.146
Regression formula 7
Average 24.8 19.9 32.3 8.84% 0.822 2.753
Minimum 23.5 15.8 27.3 6.22% 0.616 1.780
Maximum 26.0 22.1 40.6 11.43% 0.940 3.811
Regression formula 8
Average 24.8 19.8 32.1 8.59% 0.831 2.696
Minimum 23.6 15.9 27.4 5.68% 0.673 1.720
Maximum 26.3 22.2 40.5 11.90% 0.947 3.791
Regression formula 9
Average 24.8 18.9 31.8 7.32% 0.877 2.402
Minimum 23.8 14.8 28.2 5.53% 0.776 1.651
Maximum 25.5 21.6 35.5 9.32% 0.948 3.659
Regression formula 10
Average 24.8 18.9 31.8 7.31% 0.877 2.404
Minimum 23.7 14.8 28.1 5.52% 0.776 1.636
Maximum 25.5 21.6 35.5 9.14% 0.948 3.702
DOI: 10.4236/ojf.2018.82015 218 Open Journal of Forestry
Table 6. Ten-fold cross validation of DBH estimates for Japanese cypress.
Average
DBH (cm) Minimum DBH Maximum DBH Average error R RMSE
Field data
Average 22.0 14.2 30.6
Minimum 20.2 12.0 24.0
Maximum 23.5 16.0 37.0
Regression formula 1
Average 21.0 15.1 28.1 9.19% 0.856 2.554
Minimum 19.6 12.4 23.8 6.28% 0.765 1.660
Maximum 22.1 17.9 32.0 11.92% 0.977 3.392
Regression formula 2
Average 20.6 17.6 26.3 13.85% 0.581 3.848
Minimum 19.7 15.9 21.6 10.72% 0.097 3.001
Maximum 22.2 18.6 33.5 16.50% 0.896 4.927
Regression formula 3
Average 20.0 16.7 25.7 14.53% 0.601 4.004
Minimum 19.0 14.8 21.1 10.50% 0.131 2.987
Maximum 21.5 17.9 32.4 17.81% 0.902 5.163
Regression formula 4
Average 21.1 14.6 28.1 8.44% 0.866 2.428
Minimum 20.0 12.4 23.3 3.74% 0.765 0.979
Maximum 22.1 17.9 32.0 11.92% 0.973 3.392
Regression formula 5
Average 21.1 14.6 27.6 8.77% 0.860 2.509
Minimum 20.3 12.4 23.9 5.44% 0.767 1.285
Maximum 22.1 17.3 32.8 12.45% 0.946 3.550
Regression formula 6
Average 20.8 14.4 27.2 9.01% 0.864 2.602
Minimum 20.0 12.0 23.0 5.12% 0.766 1.206
Maximum 21.7 17.1 32.2 13.12% 0.957 3.653
Regression formula 7
Average 21.1 16.1 28.0 10.89% 0.755 3.026
Minimum 19.6 14.5 23.7 6.06% 0.460 1.972
Maximum 22.3 18.3 32.6 13.97% 0.977 3.954
Regression formula 8
Average 21.1 15.7 28.3 9.91% 0.798 2.821
Minimum 19.6 13.9 23.5 6.53% 0.599 1.634
Maximum 22.3 18.7 31.5 13.04% 0.961 3.647
Regression formula 9
Average 21.1 14.6 28.0 8.41% 0.867 2.424
Minimum 20.1 12.4 23.3 3.95% 0.765 0.960
Maximum 22.1 17.8 32.5 11.94% 0.975 3.396
Regression formula 10
Average 21.1 14.6 28.0 8.40% 0.867 2.420
Minimum 20.1 12.4 23.3 3.97% 0.766 0.963
Maximum 22.1 17.8 32.5 11.99% 0.975 3.404
DOI: 10.4236/ojf.2018.82015 219 Open Journal of Forestry Equations (8) and (9) are the resulting DBH regression formulae using the average value of the coefficient obtained from ten-fold cross validation of regres-sion formula 10 (Japanese cedar) and regresregres-sion formula 4 (Japanese cypress) where the coefficients of determination were the highest. Both are used to esti-mate the stem volume of an individual tree as an average coefficient regression formula.
0.298 0.402 0.062
3.430
DBHs= ×Ca ×h ×Cr (8)
0.336 0.458 3.133
DBHh= ×Ca ×h (9)
where DBHs is the DBH of a Japanese cedar (cm) and DBHh is the DBH of Jap-anese cypress (cm).
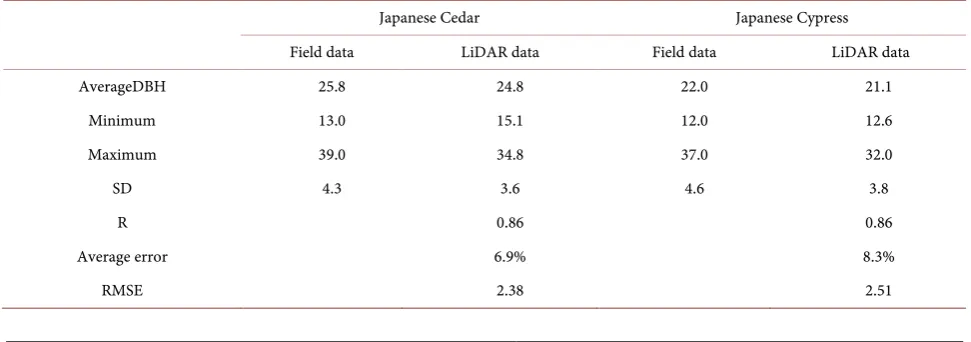
[image:15.595.55.541.567.738.2]Using the average coefficient regression formulae (Equations (8) and (9)), DBH was calculated at an individual tree level. The average DBH was calculated for the survey plot, and the correlation coefficient, average error, and RMSE ob-tained from a comparison of the minimum, maximum, average, and standard deviation of the average DBH per plot and calculated field survey, as shown in
Table 7. The average DBH from the field survey and LiDAR analysis are com-pared graphically in Figure 5. The average DBH was 25.8 cm in the field survey and 24.8 cm from LiDAR analysis of Japanese cedar, while the average DBH was 22.0 cm in the field survey and 21.1 cm from LiDAR analysis of Japanese cy-press. Both LiDAR results were underestimated compared to similar field sur-veys results obtained. The correlation coefficient was 0.86 for both cedar and cypress, the average error was 6.9% and 8.3% and RMSE was 2.38 cm and 2.51 cm for cedar and cypress, respectively, showing the high degree of accuracy of DBH estimates. However, the maximum average DBH obtained by LiDAR anal-ysis was 4.2 cm for Japanese cedar and 5 cm for Japanese cypress, which was smaller compared to the field survey. Figure 5 shows that the coefficient of ap-proximation obtained from the scatter plot was 1.0174 and 1.0498 for Japanese cedar and Japanese cypress, and the DBH obtained from LiDAR analyses were nearly identical compared to field survey results. As shown, there is also a high degree of correlation in the estimate results.
Table 7. Results of DBH estimates using the average coefficient regression formula.
Japanese Cedar Japanese Cypress
Field data LiDAR data Field data LiDAR data
AverageDBH 25.8 24.8 22.0 21.1
Minimum 13.0 15.1 12.0 12.6
Maximum 39.0 34.8 37.0 32.0
SD 4.3 3.6 4.6 3.8
R 0.86 0.86
Average error 6.9% 8.3%
DOI: 10.4236/ojf.2018.82015 220 Open Journal of Forestry (a) (b)
Figure 5. DBH calculated using the average coefficient regression formula (left: Japanese cedar, right: Japanese cypress).
The minimum DBH was 4.2 - 5 cm smaller in the LiDAR analysis; however, because the average coefficient regression formula used the average DBH from field survey plots, this may have been influenced by the narrowing range in DBH compared to individual DBH size obtained from field surveys. For this reason, two DBH histograms, one from the field survey and the other calculated using the average coefficient regression formula (Figure 6 and Figure 7). The figures show that tree height distribution was nearly equal in the field survey and Li-DAR analysis; however, many DBH values were smaller where large DBHs were underestimated, compared to values obtained from the field survey.
3.2. Individual Stem Volume Estimates
Table 8 and Table 9 show the average individual stem volumes in the surveyed plots calculated using the DBH volume equation. This equation was based on the individual tree height measured by LiDAR analysis and regression formulae ob-tained from ten-fold cross validation.
The average single tree volume, minimum volume, maximum volume, corre-lation coefficient R, RMSE, and average error, which is calculated by dividing the difference (absolute value) of the field survey by the results of the field survey and calculating the mean, were calculated from the verification group, as shown in Table 5 and Table 6.
While regression formula 10 resulted in the highest coefficient of determina-tion in estimating DBH for Japanese cedar, equadetermina-tions 4, 9, and 10 were nearly equal in value upon comparing the calculation results of the average individual stem volumes. The average individual stem volume based on regression formula 10 was 0.48 m3 for Japanese cedar, 0.05 m3 smaller than the 0.53 m3 obtained
from the field survey. The range in values between the field survey and LiDAR analysis was 0.10 m3 - 1.20 m3 for the former and 0.11 m3 - 1.12 m3 for the latter,
revealing that the average individual stem volume had the same calculated range. The average error for regression formula 10 was 14.91%, the correlation coeffi-cient was 0.905, and RMSE was 0.102. However, regression formula 4 yielded the
y = 1.0174x + 0.5286
10 15 20 25 30 35 40
10 15 20 25 30 35 40
O
b
se
rvat
ion
D
B
H
(
cm
)
LiDAR DBH(cm)
y = 1.0498x - 0.1686
10 15 20 25 30 35 40
10 15 20 25 30 35 40
O
b
se
rvat
ion
D
B
H
(
cm
)
DOI: 10.4236/ojf.2018.82015 221 Open Journal of Forestry (a) (b)
Figure 6. DBH histograms for tree observations and LiDAR measurements (Japanese cedar, left: observation, right: LiDAR).
[image:17.595.61.536.266.426.2](a) (b)
Figure 7. DBH histograms for tree observations and LiDAR measurements (Japanese cypress, left: observation, right: LiDAR).
Highest coefficient of determination for Japanese cypress; when comparing equ-ations 1 - 6 and 8, with p-values < 5%, the average individual stem volume had the highest accuracy when the DBH obtained from regression formula 4 was used. The average individual stem volume for Japanese cedar was 0.31 m3, which
was 0.05 m3 smaller than the 0.36 m3 obtained from the field survey. The range
in values between the field survey and LiDAR analysis was 0.06 m3 - 1.30 m3 for
the former and 0.05 m3 - 1.00 m3 for the latter, revealing that the high stem
vo-lume estimates decreased. The average error from equation 4 was 19.11%, the correlation coefficient was 0.911, and RMSE was 0.091, where the average error was greater compared to Japanese cypress.
Table 10 shows the calculated minimum, maximum, mean, and standard deviation values for the average individual stem volume, which was calculated using DBH Equations (8) and (9) with trees included in the survey plot. In addi-tion, the correlation coefficient, average error, and RMSE were calculated by comparing with results from the field survey. Compared to the field survey, the values were underestimated for both Japanese cedar and Japanese cypress, as was the case with the ten-fold cross validation, where the average value of the average individual stem volumes were 0.04 m3 and 0.05 m3 for cedar and cypress,
0 200 400 600 800 1000 1200 < 12
12-14 14-16 16-18 18-20 20-22 22-24 24-26 26-28 28-30 30-32 32-34 34-36 36-38 38-40 >
40 T re e num be r DBH(cm) 0 200 400 600 800 1000 1200 < 12
12-14 14-16 16-18 18-20 20-22 22-24 24-26 26-28 28-30 30-32 32-34 34-36 36-38 38-40 >
40 T re e num be r DBH(cm) 0 200 400 600 800 1000 1200 T ree n u m b er
DBH(cm)
0 200 400 600 800 1000 1200 T ree n u m b er
DOI: 10.4236/ojf.2018.82015 222 Open Journal of Forestry
Table 8. Ten-fold cross validation of stem volume estimates for Japanese cedar.
Average single
tree volume (m3) Minimum volume Maximum volume Average error R RMSE
Field data
Average 0.53 0.20 0.94
Minimum 0.47 0.10 0.78
Maximum 0.59 0.28 1.20
Regression formula 1
Average 0.48 0.23 0.84 15.80% 0.907 0.101
Minimum 0.43 0.13 0.68 9.53% 0.842 0.056
Maximum 0.54 0.32 1.02 22.19% 0.983 0.170
Regression formula 2
Average 0.45 0.25 0.74 18.80% 0.879 0.128
Minimum 0.42 0.16 0.59 14.91% 0.734 0.088
Maximum 0.50 0.32 0.87 23.83% 0.967 0.198
Regression formula 3
Average 0.44 0.24 0.73 19.54% 0.889 0.134
Minimum 0.40 0.14 0.57 15.77% 0.765 0.087
Maximum 0.48 0.31 0.86 25.03% 0.966 0.206
Regression formula 4
Average 0.49 0.20 0.88 14.89% 0.901 0.103
Minimum 0.44 0.12 0.73 9.29% 0.825 0.057
Maximum 0.53 0.27 1.13 19.83% 0.965 0.173
Regression formula 5
Average 0.47 0.19 0.87 15.83% 0.897 0.105
Minimum 0.43 0.12 0.68 12.64% 0.813 0.086
Maximum 0.54 0.28 1.10 20.54% 0.954 0.151
Regression formula 6
Average 0.46 0.19 0.84 17.18% 0.892 0.118
Minimum 0.42 0.11 0.67 13.48% 0.789 0.090
Maximum 0.52 0.27 1.06 22.45% 0.964 0.193
Regression formula 7
Average 0.48 0.23 0.84 15.91% 0.908 0.102
Minimum 0.43 0.13 0.67 9.79% 0.842 0.052
Maximum 0.53 0.32 1.02 22.33% 0.983 0.170
Regression formula 8
Average 0.49 0.22 0.85 15.87% 0.902 0.102
Minimum 0.44 0.13 0.70 9.24% 0.841 0.060
Maximum 0.54 0.31 1.04 22.24% 0.980 0.169
Regression formula 9
Average 0.49 0.20 0.89 14.90% 0.905 0.102
Minimum 0.44 0.11 0.71 9.46% 0.825 0.054
Maximum 0.54 0.28 1.12 19.50% 0.971 0.172
Regression formula 10
Average 0.48 0.20 0.88 14.91% 0.905 0.102
Minimum 0.43 0.11 0.70 9.50% 0.825 0.054
Maximum 0.54 0.28 1.12 19.81% 0.971 0.174
respectively, and the maximum values were 0.08 m3 and 0.29 m3, respectively.
DOI: 10.4236/ojf.2018.82015 223 Open Journal of Forestry
Table 9. Ten-fold cross validation of stem volume estimates for Japanese cypress.
Average single
tree volume (m3) Minimum volume Maximum volume Average error R RMSE
Field data
Average 0.36 0.09 0.82
Minimum 0.31 0.06 0.46
Maximum 0.43 0.15 1.30
Regression formula 1
Average 0.31 0.10 0.67 19.23% 0.917 0.090
Minimum 0.26 0.05 0.37 10.05% 0.808 0.047
Maximum 0.36 0.16 1.00 27.89% 0.977 0.160
Regression formula 2
Average 0.28 0.13 0.53 25.28% 0.849 0.137
Minimum 0.25 0.09 0.34 19.88% 0.684 0.070
Maximum 0.33 0.18 0.88 39.85% 0.953 0.247
Regression formula 3
Average 0.27 0.12 0.51 26.34% 0.855 0.144
Minimum 0.24 0.08 0.32 20.19% 0.677 0.081
Maximum 0.31 0.17 0.83 41.72% 0.959 0.251
Regression formula 4
Average 0.31 0.09 0.67 19.11% 0.911 0.091
Minimum 0.27 0.05 0.40 10.05% 0.808 0.047
Maximum 0.36 0.16 1.00 27.89% 0.955 0.160
Regression formula 5
Average 0.31 0.09 0.65 19.98% 0.903 0.097
Minimum 0.28 0.05 0.47 11.26% 0.774 0.051
Maximum 0.36 0.15 0.94 29.68% 0.958 0.176
Regression formula 6
Average 0.30 0.09 0.63 20.58% 0.906 0.101
Minimum 0.27 0.04 0.44 11.89% 0.778 0.054
Maximum 0.35 0.15 0.93 30.45% 0.962 0.183
Regression formula 7
Average 0.32 0.12 0.66 20.21% 0.886 0.100
Minimum 0.26 0.08 0.40 11.19% 0.724 0.061
Maximum 0.37 0.20 0.91 32.57% 0.974 0.178
Regression formula 8
Average 0.32 0.11 0.68 19.84% 0.892 0.096
Minimum 0.27 0.06 0.42 12.29% 0.777 0.061
Maximum 0.37 0.19 0.97 29.00% 0.957 0.161
Regression formula 9
Average 0.31 0.09 0.67 19.18% 0.912 0.092
Minimum 0.27 0.05 0.41 9.81% 0.800 0.046
Maximum 0.36 0.15 1.00 28.38% 0.959 0.162
Regression formula 10
Average 0.31 0.09 0.67 19.16% 0.912 0.092
Minimum 0.27 0.05 0.41 9.82% 0.800 0.046
Maximum 0.36 0.15 0.99 28.28% 0.960 0.162
DOI: 10.4236/ojf.2018.82015 224 Open Journal of Forestry
Table 10. Stem volumes calculated using the DBH average coefficient regression formula.
Japanese Cedar Japanese Cypress
Field data LiDAR data Field data LiDAR data
Average volume 0.53 0.49 0.36 0.31
Minimum 0.10 0.11 0.06 0.05
Maximum 1.20 1.12 1.30 1.01
SD 0.20 0.19 0.20 0.17
R 0.88 0.91
Average error 14.4% 18.9%
RMSE 0.10 0.10
(a) (b)
Figure 8. Average stem volume calculated using the average coefficient regression formula (left: Japanese cedar, right: Japanese cypress).
4. Discussions and Conclusions
To consider an alternative method to field surveys, this study utilized individual tree detection to establish a regression formula effective for estimating DBH us-ing a ten-fold cross validation. Regression formulae to estimate DBH were tried with ten patterns of equations, using combinations of one to three explanatory variables. The stem volume for an individual tree was estimated from the ob-tained DBH and tree height, and the results were compared with those from a field survey.
While estimating DBH, the coefficient of determination for the regression formula improved as the number of explanatory variables increased; the estima-tion accuracy also improved, especially after adding tree height. Compared to regression formulae that used crown area, the coefficient of determination was smaller for equations that used the crown surface area or crown volume due to the calculation methods for crown surface area and volume. This study assumed a conical shape for the crown shape to calculate the crown surface area and vo-lume, which are likely to have been affected by differences in the actual crown surface area and volume values. In particular, the crown length shortens on the
y = 0.9438x + 0.0689
0 0.2 0.4 0.6 0.8 1 1.2 1.4
0 0.2 0.4 0.6 0.8 1 1.2 1.4
O b ser v at io n av er ag e st em v o lu m e (㎥ )
LiDAR average stem volume(㎥)
y = 1.1011x + 0.0122
0 0.2 0.4 0.6 0.8 1 1.2 1.4
0 0.2 0.4 0.6 0.8 1 1.2 1.4
O b ser v at io n av er ag e st em v o lu m e (㎥)
DOI: 10.4236/ojf.2018.82015 225 Open Journal of Forestry ridge side and lengthens on the valley side, and the error increased when calcu-lating the crown surface area and crown volume. The p-value was not less than 5% for regression formulae 7 and 8 for Japanese cedar and formulae 7, 9, and 10 for Japanese cypress; their common feature was the p-values for crown length or crown length ratio was not less than 5%. In addition, neither crown length nor crown length ratio had a significant contribution on the DBH estimates. Fur-thermore, there were no significant differences when comparing the coefficient of determination for regression formula 1, where crown area alone was used as an explanatory variable, and formulae 7 and 8, where crown length and crown length ratio were added to crown area, as shown in Table 3 and Table 4. How-ever, the crown length and length ratio values may change by accurately mea-suring crown surface area and volume. Therefore, an accurate understanding of the shape of the tree crown and their contributions as explanatory variables are future challenges.
For explanatory variables to estimate DBH, the coefficient of determination was the highest for a combination crown area, tree height, and crown length ra-tio for Japanese cedar, and a combinara-tion of crown area and tree height for Jap-anese cypress. While there were differences in explanatory variables used for the cedar and cypress, crown length, maximum crown length, and standard devia-tion of the cedar shown on Table 1 were greater than the corresponding values for cypress by an average value of 0.4 m, 1.2 m, and 0.3, respectively, which were likely affected by large crown lengths and variations in values.
By comparing the field survey results with those obtained from the average coefficient regression formula equation, the RMSE was 2.38 cm and error rate was 9.2% for DBH of 13 - 39 cm (average DBH 25.8 cm) plots for Japanese ce-dar, while the RMSE was 2.51 cm and error rate was 11.4% for DBH of 12 - 37 cm (average DBH 22 cm) plots for Japanese cypress. Compared to past studies where the error was 4.6 cm and error rate was 10% for DBH of 10 - 70 cm (Yao et al., 2012), or error of 13 cm and error rate of 17% for DBH of 28 - 84 cm
(Verma et al., 2014), this study yielded error rates that were similar or slightly smaller, despite the differences in studied tree species and range in DBH values.
Because an average value of survey plots was used for objective variables and explanatory variables in regression analysis, the smallest DBH was greater than the value of an individual tree while the largest DBH decreased. Therefore, for the range in values applied to the regression formula for estimating DBH, the accuracy estimates for the minimum and maximum DBH decreased. As shown in Figure 6 and Figure 7, the number of trees increased with smaller DBH value obtained through LiDAR analysis compared to the value obtained from the field survey, and the number decreased with larger DBH value.
DOI: 10.4236/ojf.2018.82015 226 Open Journal of Forestry rather than an average value of survey plots. Extending the range in DBH appli-cability should also be addressed in the future.
To calculate the average individual tree stem volume, regression for mulae with p-values < 5% were considered, and formulae 4, 9, and 10 yielded similar results for Japanese cedar. For Japanese cypress, regression formula 4 calculated the stem volume with the highest accuracy. In addition, a comparison of the av-erage individual stem volume resulted in an avav-erage error of 14.4% for Japanese cedar and 18.9% for Japanese cypress. Because DBHs are generally calculated conservatively, the average individual stem volumes were also smaller by ap-proximately 0.05 m3 for both tree species compared to the results obtained from
the field survey. The error was greater for Japanese cypress compared to Japa-nese cedar potentially because of the crown shape. While an individual JapaJapa-nese cedar has an independent crown, Japanese cypress crowns overlap with adjacent ones, which makes determining crown shape relatively more difficult, thereby affecting the estimation accuracy. The crown shape also affects the precision of individual tree detection, and given that the error for individual tree detection used in this study was 7.0% for Japanese cedar and 9.8% for Japanese cypress
(Ogawa, Kira, Hikichi, Oono, & Wachi, 2013), Japanese cypress is likely to have a greater margin of error when calculating the average stem volume. Therefore, improving the accuracy of individual tree detection is also an important problem for estimating individual stem volume.
Based on our study findings, we propose that the regression formula for esti-mating DBH can be applied across the entire Saga Prefecture in Japan, and de-termined crown area and tree height are effective explanatory variables for the regression formulae based on the results from DBH and stem volume estima-tions. Through airborne LiDAR analysis, the study also showed that the DBH can be estimated with an error of <3 cm from a single regression formula for both Japanese cedar and Japanese cypress. Additionally, stem volume can likely be estimated with an accuracy of <20% based on calculations of stem volume using the tree height and DBH of individual trees.
Acknowledgements
This study used data measurements and field survey results from the Saga East-ern District Airborne LiDAR Surveying Commission, Saga WestEast-ern District Airborne LiDAR-Surveying Commission, and Saga Prefecture Forest Data Analysis Commission, provided by Saga Prefecture. We would like to express our sincere gratitude to the Saga Prefecture Forest Maintenance Division, which provided the data used in the study and forest registration information.
References
Bechtold, W. A. (2004). Largest-Crown-Width Prediction Models for 53 Species in the Western United States. Western Journal of Applied Forestry, 19, 245-251.
DOI: 10.4236/ojf.2018.82015 227 Open Journal of Forestry
Tokyo: Japan Forestry Survey Group.
Hall, R., Morton, R., & Nesby, R. (1989). A Comparison of Existing Models for DBH Es-timation from Large-Scale Photos. The Forestry Chronicle, 65, 114-120.
https://doi.org/10.5558/tfc65114-2
Hemery, G. E., Savill, P. S., & Pryor, S. N. (2005). Applications of the Crown Diame-ter-Stem Diameter Relationship for Different Species of Broadleaved Trees. Forest Ecology and Management, 215, 285-294.https://doi.org/10.1016/j.foreco.2005.05.016 Heurich, M., Persson, A., Holmgren, J., & Kennel, E. (2004). Detecting and Measuring
Individual Trees with Laser Scanning in Mixed Mountain Forest of Central Europe us-ing an Algorithm Developed for Swedish Boreal Forest Conditions. International Arc-hives of Photogrammetry, Remote Sensing and Spatial Information Sciences, 36,
307-312.
Hyyppä, J., Mielonen, T., Hyyppä, H., Maltamo, M., Yu, X., Honkavaara, E., & Kaartinen, H. (2005). Using Individual Tree Crown Approach for Forest Volume Extraction with Aerial Images and Laser Point Clouds. The International Archives of the Photogram-metry, Remote Sensing and Spatial Information Sciences, 36, W19.
Hyyppa, J. (2001). A Segmentation-Based Method to Retrieve Stem Volume Estimates from 3-D Tree Height Models Produced by Laser Scanners. IEEE Transactions on Geoscience and Remote Sensing, 39, 969-975. https://doi.org/10.1109/36.921414 Ketterings, Q. M., Coe, R., van Noordwijk, M., Ambagau’, Y., & Palm, C. A. (2001).
Re-ducing Uncertainty in the Use of Allometric Biomass Equations for Predicting Above-Ground Tree Biomass in Mixed Secondary Forests. Forest Ecology and Man-agement, 146, 199-209.https://doi.org/10.1016/S0378-1127(00)00460-6
Nakajima, I. (1973). A Study of Forest Survey Methods Utilizing Aerial Photographs.
Bulletin of the Government Forest Experiment Station, 251, 1-253.
Nielsen, U., Aldred, A., & MacLeod, D. (1979). A Forest Inventory in the Yukon using Large Scale Photo Sampling Techniques. Information Report, No. FMR-X-121, Forest Management Institute (Canada).
Ogawa, K., Kira, T., Hikichi, A., Oono, K., & Wachi, A. (2013). Efforts on Forest Zoning in Saga Prefecture Utilizing Forest Laser Analysis Data. Paper Presented at the Japanese Forest Society Conference Presentation Database 124th Conference of the Japanese Forest.
Oono, K., Numata, Y., & Hirano, A. (2008). An Improved Method of Individual Tree De-tection using Airborne LiDAR.
Persson, Å., Holmgrem, J., & Söderman, U. (2002). Detecting and Measuring Individual Trees using an Airborne Laser Scanner. Photogrammetric Engineering & Remote Sensing, 68, 925-932.
Popescu, S. C., Wynne, R. H., & Nelson, R. F. (2002). Estimating Plot-Level Tree Heights with Lidar: Local Filtering with a Canopy-Height Based Variable Window Size. Com-puters and Electronics in Agriculture, 37, 71-95.
https://doi.org/10.1016/S0168-1699(02)00121-7
Soille, P. (2013). Morphological Image Analysis: Principles and Applications. Berlin: Springer Science & Business Media.
DOI: 10.4236/ojf.2018.82015 228 Open Journal of Forestry
Verma, N. K., Lamb, D. W., Reid, N., & Wilson, B. (2014). An Allometric Model for Es-timating DBH of Isolated and Clustered Eucalyptus Trees from Measurements of Crown Projection Area. Forest Ecology and Management, 326, 125-132.
https://doi.org/10.1016/j.foreco.2014.04.003
Yao, W., Krzystek, P., & Heurich, M. (2012). Tree Species Classification and Estimation of Stem Volume and DBH Based on Single Tree Extraction by Exploiting Airborne Full-Waveform LIDAR Data. Remote Sensing of Environment, 123, 368-380.