ISSN Online: 2327-5901 ISSN Print: 2327-588X
DOI: 10.4236/jpee.2018.65004 May 31, 2018 64 Journal of Power and Energy Engineering
Optimal Sizing of Solar/Wind Hybrid Off-Grid
Microgrids Using an Enhanced Genetic
Algorithm
Abdrahamane Traoré, Hatem Elgothamy, Mohamed A. Zohdy
Department of Electrical and Computer Engineering, Oakland University, Rochester, MI, USA
Abstract
This paper presents a method for optimal sizing of an off-grid hybrid micro-grid (MG) system in order to achieve a certain load demand. The hybrid MG is made of a solar photovoltaic (PV) system, wind turbine (TW) and energy storage system (ESS). The reliability of the MG system is modeled based on the loss of power supply probability (SPSP). For optimization, an enhanced Genetic Algorithm (GA) is used to minimize the total cost of the system over a 20-year period, while satisfying some reliability and operation constraints. A case study addressing optimal sizing of an off-grid hybrid microgrid in Nige-ria is discussed. The result is compared with results obtained from the Brute Force and standard GA methods.
Keywords
Optimization, Off-Grid Microgrid, Renewable Energy, Energy Storage Systems (ESS), Solar Photovoltaic (PV), Wind, Battery, Hybrid, Genetic Algorithm (GA)
1. Introduction
Providing access to clean, reliable and affordable energy by adopting microgrid (MG) power systems is important for countries looking to achieve their sustain-able development goals as the extension of the grid is time and capital expensive. These MGs are small electrical power systems that connect several electricity us-ers to some distributed power generators and energy storage systems, which are
mainly interconnected by power converters [1] and can be made of renewable
energy sources or hybridized with fossil fuel generators [2]. Hybrid PV/Diesel
MG power systems are used for off-grid electrification applications, and they are
good for applications in hot climates [3]. However, due to the CO2 emission,
How to cite this paper: Traoré, A., Elgo-thamy, H. and Zohdy, M.A. (2018) Optimal Sizing of Solar/Wind Hybrid Off-Grid Microgrids Using an Enhanced Genetic
Algorithm. Journal of Power and Energy
Engineering, 6, 64-77.
https://doi.org/10.4236/jpee.2018.65004
Received: February 13, 2018 Accepted: May 28, 2018 Published: May 31, 2018
Copyright © 2018 by authors and Scientific Research Publishing Inc. This work is licensed under the Creative Commons Attribution International License (CC BY 4.0).
http://creativecommons.org/licenses/by/4.0/
DOI: 10.4236/jpee.2018.65004 65 Journal of Power and Energy Engineering
rising price and delivery cost of diesel fuel, renewable energy sources are be-coming more and more popular in MG development, especially in remote areas. Both solar and wind power sources are intermittent as they depend on weather and climate changes; however, hybridizing the two sources can overcome this
drawback [4]. Furthermore, using a hybrid ESS in an MG system can increase
the system stability [5]. The PV is used as the main power supply in the system.
The WT is used as complementary power supply to support the load when the PV production is low (e.g. cloudy day) or not available (night times). Addition-ally, the ESS is used as a back-up power to support the load when the power generated by the PV and WT cannot handle the load demand. However, impro-per sizing of the system components may result in higher MG cost and low re-liability. For example, an oversized PV array may increase the MG investment cost and decrease its stability due to the unpredictable nature of solar power
generation [6][7]. Similarly, too much ESS capacity increases the cost and not
enough ESS capacity may result in low system reliability. Consequently, many optimization problems are based mainly on either cost reduction or required
re-liability of the MG power system [4][8][9][10][11].
Previous studies have investigated various methods of optimally sizing in
dif-ferent scenarios of hybrid MG applications. [4] presented a simple sizing
algo-rithm to obtain the number of PV and WT units along with the storage capacity
for a stand-alone hybrid MG. The work in [12] presented a simple method to
optimize the size of PV, WT and battery using an iterative method driven by the loss of power supply probability (LPSP) to minimize the 20-year total cost in-cluding capital, operation and maintenance cost of the MG. Other research
stu-dies focused on the operation optimization of MGs [13][14][15] [16][17]. In
[14] a method was presented, which used an energy management strategy based
on a fuzzy expert system for optimal MG ESS sizing. [16] proposed a genetic
al-gorithm-based optimal sizing method using an operational strategy and joint-optimization for off-grid MGs.
This paper aims to find the optimal size of PV array, WT and ESS for an
off-grid MG by using an enhanced GA, proposed by [18], to minimize the total
cost of the MG (which includes the capital and operating costs), while satisfying
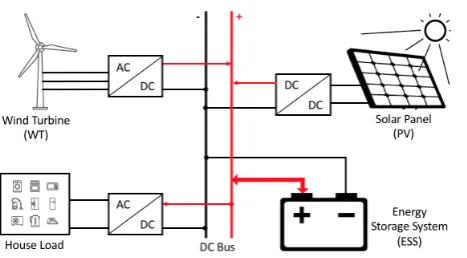
the load demand at all times with a desired reliability. Figure 1 shows the
archi-tecture of a typical hybrid PV/WT/ESS off-grid MG. In the figure is a DC-coupled MG in which the PV panel and the ESS are linked via a DC/DC charge controller, creating a DC bus that carries the power from the WT via a rectifier and power the household load using an inverter. The DC-coupled mi-crogrid uses less power conversions (resulting in a small efficiency gain)
com-pared to an AC-coupled MG [5].
DOI: 10.4236/jpee.2018.65004 66 Journal of Power and Energy Engineering
Figure 1. Architecture of hybrid PV/Wind/Battery off-grid microgrid with power converters.
2. Mathematical Modeling of Hybrid Off-Grid Microgrid
System
2.1. PV Model
As the main power supply in this off-grid solar hybrid MG system, the output power of a PV module is estimated from (1) based on the solar irradiation at
time t, and the efficiency of the PV module is given by (2).
( )
( )
PV PV PV
P t
=
η
⋅
A G t
⋅
(1)(
)
1
PV STC MPPT T TC STC
η =η ⋅η −α − (2)
where APV is the area of a PV module in (m2),
G t
( )
is the hourly total solarirradiance in (W/m2),
PV
η is the efficiency of the PV array, ηSTC is reference
efficiency of the PV cell at standard temperature condition (STC), ηMPPT is the
efficiency of the maximum peak power tracker, TC is the temperature of the PV
cell in (˚C), TSTC is the reference temperature of the PV cell at STC (25˚C), and
α is the temperature coefficient of the PV cell (typically 0.4%/˚C – 0.6%/˚C for
silicon cells). The temperature coefficient is given by the PV cell manufacturer and can be obtained from the PV panel datasheet.
The cell temperature can be obtained from Equation (3).
( )
20 800C a NOCT
T =T + − ⋅G t
(3)
where Ta is the ambient temperature in (˚C) and NOCT is the nominal
oper-ating cell temperature (45˚C - 47˚C).
2.2. WT Model
The output power from a WT at time t depends on the wind speed and can be
obtained from (4) [19].
( )
( )
( )
( )
( )
( )
3
0
0
ci r
WT ci r
WT r
WT r co
co
V t V
a V t b P V V t V
P t
P V V t V
V t V
<
⋅ − ⋅ ≤ <
=
≤ <
≥
DOI: 10.4236/jpee.2018.65004 67 Journal of Power and Energy Engineering
where
(
3WTr 3)
r ci
P a
V V
=
− ;
(
)
3
3 3
ci
r ci
V b
V V
=
− ;
V t
( )
is the wind speed at time t in(m/s);
P
WTr is the rated power of the WT in (W); Vr is the rated speed in(m/s); Vci is the cut-in speed in (m/s) and Vco is the cut-out speed of the WT
in (m/s).
2.3. ESS Model
Depending on its state of charge (SOC), the ESS can supply the load when there is lack of electricity (discharge) and store surplus power when the generated power exceeds the load demand (charge). The discharging and charging energies
of the ESS at time t can be obtained from (5) and (6), respectively [20].
( )
(
1)
( )
( )
( )
d
ESS ESS Load PV WT d
E t =E t− −E t −E t −E t η (5)
( )
(
1)
( )
( )
( )
c
ESS ESS PV WT Load c
E t =E t− +E t +E t −E t ⋅η (6)
where
E
ESS( )
t
−
1
is the energy at time t−1 in (kWh); EPV,EWT,ELoad arethe PV energy, WT energy and load energies, respectively; ηd and ηc are the
discharge and charge efficiencies of the ESS, respectively.
Equations (5) and (6) can be rewritten as (7) and (8) [10].
( )
(
1)
( )
d d
ESS ESS ESS d
E t =E t− −P t ⋅ ∆t
η
(7)( )
(
1)
( )
Δc c
ESS ESS ESS c
E t =E t− +P t ⋅ ⋅t
η
(8)where d
( )
( )
( )
( )
ESS Load PV WT
P t =P t −P t −P t is the power discharged by the ESS;
( )
( )
( )
( )
c
ESS PV WT Load
P t =P t +P t −P t is power charged into the ESS; and Δt=1
since the time interval is 1 hour.
2.4. Load Profile
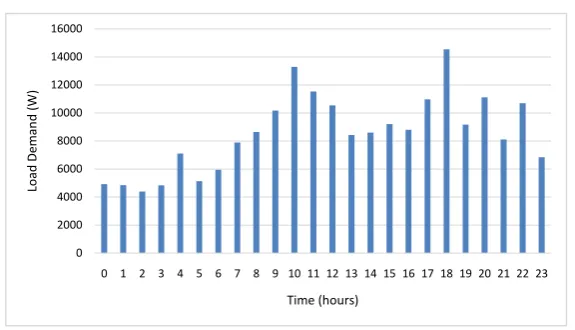
The load profile determines the requirements of power supply from the hybrid MG power system. The load profile is modeled according to the dynamic load
power demands PLoad at times t. In off-grid power system design, the load
pro-file is the driver. Figure 2 shows an example of a per-hour daily residential load
demand profile for a group of some households. This double-bell curve, with high demands early in the morning and late in the evening, could be explained as follows:
• Most residents wake up in the morning to prepare for work and school (i.e.
taking hot showers, preparing breakfast, etc.).
• People then leave for work and school typically from hours 7 to 18 on
week-days.
• Most household members are cooking/warming food, eating dinner,
watch-ing TV from hours 18 to 22 then go to bed.
The curve shown here in Figure 2 represents a weekend profile as people
DOI: 10.4236/jpee.2018.65004 68 Journal of Power and Energy Engineering
Figure 2. Daily residential load demand.
2.5. Reliability Model
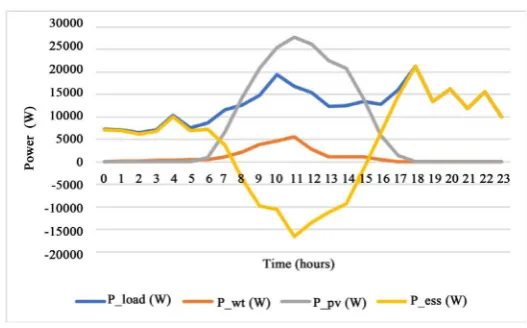
The power balance of the system is illustrated in Figure 3. When the load
de-mand exceeds the energy generated by PV and WT plus the energy stored in the
ESS for hour t, this put the MG in a Loss of Power Supply scenario
(
P
supplied( )
t
<
P
needed( )
t
), which is expressed as( )
( )
( )
( )
d( )
Load PV WT ESS inv
LPS t =P t −P t +P t +P t ⋅η . (9)
where ηinv is the efficiency of the inverter.
The Loss of Power Supply Probability (LPSP), which is the reliability index of
an MG system, for a given time period T can be defined as the ratio of all LPS(t)
values for that period to the sum of the load demands [21].
( )
( )
0 0
0
Power failure time
T T t t T Load t LPS t LPSP T P t = = = =
∑
=∑
∑
(10)3. Problem Formulation
3.1. Objective Function
The objective of this optimization problem is to minimize the capital and oper-ating costs of the off-grid hybrid MG over a total life period of 20 years, while satisfying some reliability, operational and stability constraints. This
optimiza-tion problem is expressed in (11) and (12) [12].
(
)
min ,
f N N E
PV WT,
ESS=
C
PV⋅
N
PV+
C
WT⋅
N
WT+
C
ESS⋅
E
ESS (11)(
)
(
)
(
)
20 20 20 1 PV PVPV cap op PV
WT WT
WT cap op WT
ESS ESS ESS
ESS cap ESS cap ESS op
C C C P
C C C P
C C y C y C
= + ⋅ ⋅ = + ⋅ ⋅ = + ⋅ + − − ⋅ (12)
where NPV is the number of PV panels; NWT is the number of wind turbines;
ESS
E is the storage capacity of the ESS in (Wh); CPV and CWT are the total
costs in (US$) of a PV and a WT, respectively; CESS is the per-unit cost of the
ESS in (US$/Wh) of the ESS; PV, WT
cap cap
C C and ESS
cap
C are the capitol costs of the
0 2000 4000 6000 8000 10000 12000 14000 16000
0 1 2 3 4 5 6 7 8 9 10 11 12 13 14 15 16 17 18 19 20 21 22 23
DOI: 10.4236/jpee.2018.65004 69 Journal of Power and Energy Engineering
Figure 3. Power balance.
PV in (US$/W), WT in (US$/W) and ESS in (US$/Wh), respectively; PV, WT
op op
C C
and ESS
op
C are the operating costs of the PVin (US$/W), WT in (US$/W) and
ESS in (US$/Wh), respectively; and yESS is the expected number of ESS
re-placement over the 20 years. The capital cost of each component includes the purchase and installation cost of that component. The operation cost of each component includes the maintenance and operation cost of that component.
3.2. Constraints
The following constraints should be satisfied:
• Reliability:
set
LPSP LPSP≤ (13)
• PV power limits:
( )
min max
;
0,1,2,
PV PV PV PV
P
≤
P t
≤
P
N
=
(14)• WT power limits:
( )
min max
;
0,1,2,
WT WT WT WT
P
≤
P t
≤
P
N
=
(15)• ESS stored energy and power limits:
( )
min max
ESS ESS ESS
E
≤
E
t
≤
E
(16)(
)
min
1
maxESS ESS
E
= −
DOD E
⋅
(17)( )
max{
max(
(
)
min)
}
0 d d min , 1
ESS ESS Ess d ESS ESS d
P t P = E ⋅
η
E t− −E ⋅η
≤ ≤ (18)
( )
max{
max(
max(
)
)
}
0 c c min , 1
ESS ESS Ess c ESS ESS c
P t P E
η
E E tη
≤ ≤ = − − (19)
In addition to the stored energy constraint, the charge and discharge powers of the ESS must be kept within a certain limit at any point of time. In Equations
(18) and (19), the energy terms are divided by the time internal Δt=1 to get
the powers.
• Energy balance (starting and ending limits):
( )
0( )
ESS ESS ESSstored
DOI: 10.4236/jpee.2018.65004 70 Journal of Power and Energy Engineering
• Power balance
( )
( )
( )
( )
PV WT ESS Load
P t P t P
+
+
t
=
P
t
(21)4. Enhanced Genetic Algorithm
In the past few decades, various nature-inspired computational methods have
been developed to solve complex engineering problems [22][23][24][25]. One
such computational method is Evolutionary algorithms which are generic, opti-mization algorithms that are biology-inspired mechanisms. Geneticalgorithm (GA) is a rapidly growing area of Artificial Intelligence. It is an intelligent me-thod for solving combinatorial, hard optimization problems in n-dimensions.
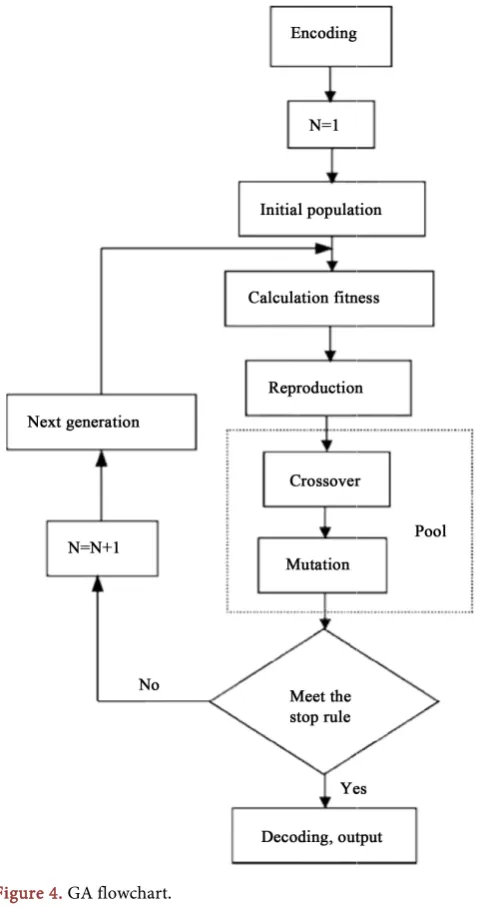
The flowchart of a GA is shown in Figure 4. The work in [18] proposed
[image:7.595.254.495.273.727.2]en-hancements that give a new variant of the Standard GA. Five enen-hancements were
DOI: 10.4236/jpee.2018.65004 71 Journal of Power and Energy Engineering
were introduced (multiple weighted roulettes, multiple cross over points, mul-tiple mates, utilizing the Daubechies wavelets (D4) and using normal distribu-tion for selecting the initial populadistribu-tion). The convergence velocity of the algo-rithm is also improved thereby reducing the time taken for the algoalgo-rithm to reach the sought solution.
A basic part of the selection process is to stochastically select from one gener-ation to another in order to create the basis of the next genergener-ation. The under-lining requirement is that the set of fittest individuals would have a greater chance of survival than the set of weaker ones. This inheritance nature in those fitter individuals will tend to have a better probability of survival and will go on forward to form updated mating pool for the next generation. Weaker individu-als are not left without a chance though. In nature those individuindividu-als may have genetic coding that may also prove useful to future generations.
Selection is the first genetic operation in the reproductive phase of GA. It helps the GA by directing the genetic search towards promising regions in the search space. Selection pressure is a crucial factor that determines the efficiency of the algorithm and is reduced in our proposed algorithm. The first enhance-ment proposed is to use multiple weighted roulettes, each designed to comple-ment the others. This will further distribute the selection pressure for one gener-ation to another. The job that GAs have in this case is to mate sets of individuals and then replicate this selection process. The usual implementation is by cros-sover. The only general requirement is that the offspring carry forward the im-portant genetic material from the parents, whilst introducing enough variation that they survive. The crossover method emulates this process by exchanging chromosome patterns between individuals to create offspring for the next gener-ation.
The second and third enhancements are to use multiple cross over points as well as using multiple mates as a function of results of mating individual parents creating some offspring. Those offspring will have of the genetic material of both parents. There are three options regarding the fitness of the offspring, they can be weaker, the same or fitter than their parents. If they are weaker they will tend to die out—if they are stronger their chances of survival are better. It is of gener-al note that the stronger the parents are in terms of fitness then the fitter the offspring will be. The variation caused by this process allows the offspring to
search out different available niches, i.e. find better fitness values and
subse-quently better solutions.
DOI: 10.4236/jpee.2018.65004 72 Journal of Power and Energy Engineering
Daubechies wavelet family is the most popular wavelet family used for texture feature analysis, due to orthogonal and compact support abilities. Daubechies averages over more pixels, it is smoother than the HAAR wavelet. It is Similar to the well-known Fourier transform, but it takes care of rapid transitions better than Fourier.
The fifth enhancement is used for initializing the initial population and it is done by replacing the uniform distribution with the normal distribution. The normal (Gaussian) distribution is the most widely known and used of all distri-butions. Because the normal distribution approximates many natural phenome-na so well, it has developed into a standard of reference for many probability problems. That is why it was selected to be the fifth enhancement proposed to deal with the step of selecting the initial population. Some of the characteristics of the normal distribution are that it is symmetric, bell shaped and continuous
for all values of X between -∞ and ∞ so that each conceivable interval of real
numbers has a probability other than zero. Normal distribution is actually a family of distributions since the two parameters μ and σ determine the shape of the distribution.
This enhanced GA was used in radar system application to detect the angle of
arrival by analyzing readings from an array of multiple radars [26]. This paper
will assess the robustness and accuracy of the developed enhanced GA in MG power system applications. The form of the individual of the GA’s population is
set to [NPV NWT EESS]. To accomplish this, a specific fitness function was
devel-oped along with a new data preprocessing program in Java to organize and pre-pare the data for importation into the enhanced GA search environment to eva-luate every individual for 8760 hours per simulation cycle. A GA optimization can have many ways to use as a stop rule. The best one of course is if the opti-mum solution is known. However, since in this case the optiopti-mum solution was unknown, the system used the population size and a maximum number of gen-erations as the stop rule.
5. Case Study
The location of Guzape (suburb of Abuja), Nigeria (Latitude 9˚0'31''N, Longi-tude 7˚30'50''E) is used as site for the case study. The global horizontal solar
ir-radiance Figure 5, ambient temperature Figure 6 and wind speed Figure 7 data
were taken from the Typical Meteorological Year (TMY) data sets [27] and used
to calculate the output powers of the PV and WT. Table 1 contains information
about the PV, WT and ESS parameters used in this paper. The site consists of 10 apartments with some outside lighting. The estimated hourly load demand for
the site is shown in Figure 8.
6. Results and Discussion
DOI: 10.4236/jpee.2018.65004 73 Journal of Power and Energy Engineering
[image:10.595.232.515.270.416.2]Figure 5. Hourly global solar irradiance of the year (W/m2).
Figure 6. Hourly ambient temperature of the year (˚C).
Figure 7. Hourly wind speed of the year (m/s).
those obtained from the Brute Force and standard GA. A comparison between
the three strategies is presented in Table 2. The enhanced GA outperformed the
standard GA in terms of speed as it took 41,218 less trials to reach the same re-sult on the same machine. The rere-sults obtained from the enhanced GA agree with those from the two other methods. The effect of the ESS depth of discharge
(DOD) on the MG system sizing and total coast is shown in Table 3. It was
0 200 400 600 800 1000 1200
0
250 500 750 1000 1250 1500 1750 2000 2250 2500 2750 3000 3250 3500 3750 4000 4250 4500 4750 5000 5250 5500 5750 6000 6250 6500 6750 7000 7250 7500 7750 8000 8250 8500 8750
So
la
r Ir
ra
di
an
ce
(W
/m
2)
Time (hours)
15 20 25 30 35 40 45 50
0
250 500 750 1000 1250 1500 1750 2000 2250 2500 2750 3000 3250 3500 3750 4000 4250 4500 4750 5000 5250 5500 5750 6000 6250 6500 6750 7000 7250 7500 7750 8000 8250 8500 8750
Amb
ien
t T
emp
er
at
ur
e
(
oC)
Time (hours)
0 10 20 30 40 50 60 70
0
250 500 750 1000 1250 1500 1750 2000 2250 2500 2750 3000 3250 3500 3750 4000 4250 4500 4750 5000 5250 5500 5750 6000 6250 6500 6750 7000 7250 7500 7750 8000 8250 8500 8750
W
ind S
pe
ed
(m
/s
)
[image:10.595.232.514.449.602.2]DOI: 10.4236/jpee.2018.65004 74 Journal of Power and Energy Engineering
[image:11.595.205.540.271.527.2]Figure 8. Hourly load demand for the year (W).
Table 1. Parameters of system components.
Parameter Value
PV Data
Max power Efficiency at STC
Length Width Capital cost Operation cost Life time 255 W 15.7% 1.64 m 0.99 m $0.80/W $0.04/W 25 yr WT Data Rated power Cut-in wind speed Cut-out wind speed
Rated wind speed Capital cost Operation cost Life time 1500 W 2.5 m/s 17 m/s 12 m/s $0.67/W $0.1005/W 20 yr ESS Data Charge efficiency Discharge efficiency Capital cost Operation cost Life time 80% 100% $0.15/Wh $0.015/Wh 5 yr
Table 2.Comparison of the three strategies.
Brute Force Standard GA Enhanced GA
No. of Trials 35,267,760 117,624 76,406
Table 3. Results of optimal sizing.
DOD = 0.8 DOD = 0.7 DOD = 0.6 DOD = 0.5
NPV NWT PPV PWT EESS Total Cost 164 5 41.8 kW 7.5 kW 200 kWh $255012.00 166 5 42.3 kW 7.5kW 200 kWh $255828.07 168 5 42.8 kW 7.5 kW 200 kWh $256644.00 176 5 44.9 kW 7.5 kW 200 kWh $259908.00 0 5000 10000 15000 20000 25000 30000 0
[image:11.595.204.540.560.594.2] [image:11.595.207.543.629.720.2]DOI: 10.4236/jpee.2018.65004 75 Journal of Power and Energy Engineering
Figure 9. Aerial view of the site.
found that the optimal size of the site is 176 solar panels, 5 wind turbines with 200 kWh of energy storage for the minimum total 20-year cost of $259,908.00 based on the desired operation and reliability constraints with 50% DOD and
LPSP less than or equal to 0.15. Figure 9 shows an aerial view of the project site
in Nigeria.
7. Conclusions
An approach of sizing a PV/WT/ESS hybrid off-grid MG using an enhanced GA is proposed in this paper. A case study involving the optimal sizing of an off-grid MG system site in Nigeria using real field data was discussed. For the case study, a special Java program was developed along with the enhanced GA to obtain the optimal size of the MG.
That is the combination of PV, WT and ESS that met the load demand subject to the operation constraints and the desired LPSP with the minimum total MG cost over a period of 20 years. The result is compared to those obtained from the Brute Force and standard GA. All methods give the same result under the same conditions, showing that the enhanced GA is well suited for optimal MG system sizing, and the proposed method is feasible for sizing PV/WT/ESS hybrid off-grid MG systems.
Acknowledgements
This work was supported by the Information, Computation, Communication& Control (ICCC) group at Oakland University, USA and Blue Camel Energy Ltd., a solar energy company based in Abuja, Nigeria. We thank Blue Camel Energy for providing site data and details that greatly contributed to the development of this manuscript. We thank Dr. Serge Kruk from the Department of Mathematics and Statistics at Oakland University for providing insight and expertise that greatly improved the manuscript.
References
DOI: 10.4236/jpee.2018.65004 76 Journal of Power and Energy Engineering
J. and Moreno-Alfonso, N. (2006) Power Electronic Systems for the Grid
Integra-tion of Renewable Energy Sources: A Survey. IEEE Transactions on Power
Elec-tronics, 53, 1002-1016.
[2] Asmus, P. (2014) Why Microgrids Are Moving into the Mainstream: Improving the
Efficiency of the Larger Power Grid. Electrification Magazine, IEEE, 2, 12-19.
https://doi.org/10.1109/MELE.2013.2297021
[3] Shaahid, S.M. and Elhadidy, M.A. (2003) Opportunities for Utilization of
Stand-Alone Hybrid (Photovoltaic + Diesel + Battery) Power Systems in Hot
Cli-mates. Renew Energy, 28, 1741-1753.
https://doi.org/10.1016/S0960-1481(03)00013-2
[4] Li, J., Wei, W. and Xiang, J. (2012) A Simple Sizing Algorithm for Stand-Alone
PV/Wind/Battery Hybrid Microgrids. Energies, 5, 5307-5323.
https://doi.org/10.3390/en5125307
[5] Traore, A., Taylor, A., Zohdy, M.A. and Peng, F.Z. (2017) Modeling and Simulation
of a Hybrid Energy Storage System for Residential Grid-Tied Solar Microgrid
Sys-tems. Journal of Power and Energy Engineering, 5, 28-39.
https://doi.org/10.4236/jpee.2017.55003
[6] Yan, R., Saha, T.K., Modi, N., Masood, N-A. and Mosadeghy, M. (2015) The
Com-bined Effects of High Penetration of Wind and PV on Power System Frequency
Response. Applied Energy, 145, 320-330.
https://doi.org/10.1016/j.apenergy.2015.02.044
[7] Balcombe, P., Rigby, D. and Azapagic, A. (2015) Environmental Impacts of
Micro-generation: Integrating Solar PV, Stirling Engine CHP and Battery Storage. Applied
Energy, 139, 245-259. https://doi.org/10.1016/j.apenergy.2014.11.034
[8] Amer, M., Namaane, A. and M’Sirdi, N.K. (2013) Optimization of Hybrid
Renewa-ble Energy Systems (HRES) Using PSO for Cost Reduction. Energy Procedia, 42,
318-327. https://doi.org/10.1016/j.egypro.2013.11.032
[9] Xu, D., Kang, L., Chang, L. and Cao, B. (2005) Optimal Sizing of Standalone Hybrid
Wind/PV Power Systems using Genetic Algorithms. IEEE ECE Conference,
Saska-toon, 1-4 May 2005, 1722-1725.
[10] Chen, S.X., Gooi, H.B. and Wang, M.Q. (2012) Sizing of Energy Storage for
Micro-grids. IEEE Transactions on Smart Grid, 3, 142-151.
https://doi.org/10.1109/TSG.2011.2160745
[11] Yang, H., Lu, L. and Zhou, W. (2007) A Novel Optimization Model for Hybrid
So-lar-Wind Power Generation System. Solar Energy, 81, 76-84.
https://doi.org/10.1016/j.solener.2006.06.010
[12] Tito, M.S.R., Lie, T.T. and Anderson, T. (2013) A Simple Sizing Optimization
Me-thod for Wind-Photovoltaic-Battery Hybrid Renewable Energy Systems.
Proceed-ings of the 20th Electronics New Zealand Conference, 5, 8-12.
[13] Xiao, H., Pei, W., Yang, Y. and Kong, L. (2014) Sizing of Battery Energy Storage for
Micro-Grid Considering Optimal Operation Management. International
Confe-rence on Power System Technology, No. CP1697, 3162-3169.
https://doi.org/10.1109/POWERCON.2014.6993661
[14] Fossati, J.P., Galarza, A., Martín-Villate, A. and Fontan, L. (2015) A Method for
Optimal Sizing Energy Storage Systems for Microgrids. Renewable Energy, 77,
539-549. https://doi.org/10.1016/j.renene.2014.12.039
[15] Arefifar, S.A., Paz, F. and Ordonez, M. (2017) Improving Solar Power PV Plants
DOI: 10.4236/jpee.2018.65004 77 Journal of Power and Energy Engineering
Topics in Power Electronics, 5, 638-650.
https://doi.org/10.1109/JESTPE.2017.2670500
[16] Zhao, B., et al. (2013) Optimal Sizing, Operating Strategy and Operational
Expe-rience of a Stand-Alone Microgrid on Dongfushan Island. Applied Energy, 113,
1656-1666.https://doi.org/10.1016/j.apenergy.2013.09.015
[17] Mahesh, A. and Sandhu, K.S. (2017) A Genetic Algorithm Based Improved Optimal
Sizing Strategy for Solar-Wind-Battery Hybrid System Using Energy Filter
Algo-rithm. Frontiers in Energy, 1-13.https://doi.org/10.1007/s11708-017-0484-4
[18] Elgothamy, H., Zohdy, M.A. and Abdel-Aty-Zohdy, H.S. (2014) Design and
Appli-cation of an Enhanced GA. IEEE 57th International Midwest Symposium on
Cir-cuits and Systems, College Station, 3-6 August 2014, 864-867.
https://doi.org/10.1109/MWSCAS.2014.6908552
[19] Patel, M.R. (1999) Wind and Solar Power System. CRC Press, Boca Raton.
[20] Lan, H., Wen, S., Hong, Y., Yu, D.C. and Zhang, L. (2015) Optimal Sizing of Hybrid
PV/Diesel/Battery in Ship Power System. Applied Energy, 158, 26-34.
https://doi.org/10.1016/j.apenergy.2015.08.031
[21] Yang, H., et al. (2008) Optimal Sizing Method for Stand-Alone Hybrid Solar-Wind
System with LPSP Technology by Using Genetic Algorithm. Solar Energy, 82,
354-367.https://doi.org/10.1016/j.solener.2007.08.005
[22] Garbacik, N.R. and Zohdy, M.A. (2008) Genetic Algorithm: Scattered Data
Prob-lems Using Lipschitz Interpolation. Aerospace and Electronics Conference, Dayton,
16-18 July 2008, 56-58.https://doi.org/10.1109/NAECON.2008.4806516
[23] Khan, A.A. and Zohdy, M.A. (1997) A Genetic Algorithm for Selection of Noisy
Sensor Data in Multisensor Data Fusion. American Control Conference,
Albu-querque, June 1997, 2256-2262.
[24] Zohdy, M.A., Loh, K., Liu, N., Jun, A. and Abdul-Wahab, A. (1989) Application of
Maximum Likelihood Identification with Multisensor Fusion to Time-Varying
Stochastic System. Journal of Chemical Neuroanatomy.
[25] Alfaro, A., Doan, M., Finke, J., Galdes, M. and Zohdy, M.A. (2007) Application of
Divide and Conquer Extended Genetic Algorithm to Tertiary Protein Structure of
Chymotrypsin Inhibitor-2. Applied Bionics and Biomechanics, 3, 263-271.
[26] Elgothamy, H., Zohdy, M.A. and Abdel-Aty-Zohdy, H.S. (2018) Application of an
Enhanced Genetic Algorithm to Radar System. International Journal of Advanced
Research in Computer and Communication Engineering, 7, 37-43.