PHENOTYPIC CORRELATION AND PATH COEFFICIENT ANALYSIS IN RICE (
INTROGRESSION LINES UNDER DROUGHT AND CONTROLLED CONDITIONS
D.K. Dwivedi
1, Anil
1
Department of Plant Molecular Biology and Genetic Engineering, Narendra Deva University of Agriculture and
Technology, Kumarganj, Faizabad. U.P. India.224229
2
Department of Genetics and Plant Breeding, Narendra Dev
Kumarganj, Faizabad. U.P. India.224229
ARTICLE INFO ABSTRACT
The association among yield and yield components, their direct and indirect were estimated in 58 rice
design of experiment indicated that only three characters were non were significant and other cha
under drought condition. Leaves per seedling significant and other. All the characters showed highly significant differences among treatments under control conditions except leaves per
recorded significant differences. The entries IR82853 82848
mean performance for most of the yield componen
harvest index had the highest positive direct effect followed by biological yield/plant and kernel length on grain yield/plant in all environments and pooled level.
yield and
to be incorporated in hybridization programme as donor parent for incorporation of these characters along with drought tolerance. The path coefficient analysis indic
index had maximum direct effect on grain yield at phenotypic and genotypic level under drought condition. Biological yield and harvest index had maximum direct effect on grain yield at phenotypic level and grains per
genotypic level under control condition. Seedling height, leaves per seedling and plant height exerted very high positive indirect effect on grain yield at phenotypic and genotypic
conditions
INTRODUCTION
Drought occurs in many parts of the world every year, often with devastating effects on crop production (Ludlow and Muchow, 1990). The environmental stresses such as drought, temperature, salinity, air pollution, heavy metals, pesticides and soil pH are major limiting factors in crop production because, they affects almost all plant functions (Lawlor, 2002 and Hernandez et al., 2001). Water deficit (commonly known as drought) can be defined as the absence of adequate moisture necessary for normal plant grow and to
life cycle (Zhu, 2002). The lack of adequate moisture leading to water stress is common occurrence in rain fed areas, brought about by infrequent rains and poor irrigation (Wang al., 2005). Drought stress is a serious limiting factor to ric production and yield stability in rainfed rice areas (Dey and Upadhyaya, 1996). The occurrence of drought can be assessed by following variables such as weather conditions, soil moisture, and crop condition over a particular growing season.
*Corresponding author: [email protected]
ISSN: 0975-833X
Article History:
Received 20th April, 2012
Received in revised form 18th May, 2012
Accepted 27th June, 2012
Published online 30th July, 2012
Key words:
Drought, Introgression, Checks line,
Analysis of variance, Genotypes,
Oryza sativa L.
RESEARCH ARTICLE
PHENOTYPIC CORRELATION AND PATH COEFFICIENT ANALYSIS IN RICE (
INTROGRESSION LINES UNDER DROUGHT AND CONTROLLED CONDITIONS
, Anil Kumar
1, V.K.Mishra
1*and Saket Dwivedi
Department of Plant Molecular Biology and Genetic Engineering, Narendra Deva University of Agriculture and
Technology, Kumarganj, Faizabad. U.P. India.224229
Department of Genetics and Plant Breeding, Narendra Deva University of Agriculture and Technology,
Kumarganj, Faizabad. U.P. India.224229
ABSTRACT
The association among yield and yield components, their direct and indirect were estimated in 58 rice introgression lines including check varieties design of experiment indicated that only three characters were non
were significant and other characters were highly significant indicating variability among treatments under drought condition. Leaves per seedling significant and other. All the characters showed highly significant differences among treatments under control conditions except leaves per
recorded significant differences. The entries IR82853-6 followed by IR82873
82848-9 and IR 82873-38 produced highest grain yield. These lines also possessed average to high mean performance for most of the yield components. Correlation coefficient analysis indicated that harvest index had the highest positive direct effect followed by biological yield/plant and kernel length on grain yield/plant in all environments and pooled level.
yield and majority of yield components, the above mentioned lines were identified as most promising to be incorporated in hybridization programme as donor parent for incorporation of these characters along with drought tolerance. The path coefficient analysis indicated that biological yield and harvest index had maximum direct effect on grain yield at phenotypic and genotypic level under drought condition. Biological yield and harvest index had maximum direct effect on grain yield at phenotypic level and grains per panicle and panicles per plant had maximum direct effect on grain yield at genotypic level under control condition. Seedling height, leaves per seedling and plant height exerted very high positive indirect effect on grain yield at phenotypic and genotypic
conditions via harvest index.
Copy Right, IJCR, 2012, Academic Journals
occurs in many parts of the world every year, often production (Ludlow and Muchow, 1990). The environmental stresses such as drought, temperature, salinity, air pollution, heavy metals, pesticides ting factors in crop production because, they affects almost all plant functions (Lawlor, 2002 ., 2001). Water deficit (commonly known as drought) can be defined as the absence of adequate moisture necessary for normal plant grow and to complete the life cycle (Zhu, 2002). The lack of adequate moisture leading to water stress is common occurrence in rain fed areas, brought about by infrequent rains and poor irrigation (Wang et ., 2005). Drought stress is a serious limiting factor to rice production and yield stability in rainfed rice areas (Dey and Upadhyaya, 1996). The occurrence of drought can be assessed by following variables such as weather conditions, soil moisture, and crop condition over a particular growing season.
In rice, the effect of drought varies with the variety, degree, and duration of stress and its coincidence with different growth stages. Rice’s susceptibility to water stress is more pronounced at the reproductive sta
reduction in grain yield when stress coincides with the irreversible reproductive processes (Matsushima, 1966; Cruz and O’Toole, 1984). The genetic architecture of grain yield can be better resolved through components rather than per se, as the yield is the end product of multiplication interactions between various yield components (Grafius, 1959). The correlations provide information about inter relationship among yield and its components, which is very helpful for developing efficient selection strategy. The significant positive relationship of grain yield with productive tillers, filled grain number per panicle, 1000
harvest index reported by Reddy Siddiqui (1996) observed positi
of yield per plot with plant height, length of panicle, days to maturity and 1000-grain weight. The correlation and path analysis by evaluating 30 genotypes of rice for 11 characters and grain yield per plant showed signific
Available online at http://www.journalcra.com
International Journal of Current Research
Vol. 4, Issue, 07, pp.007-012, July,2012
INTERNATIONAL
PHENOTYPIC CORRELATION AND PATH COEFFICIENT ANALYSIS IN RICE (
Oryza sativa
L.)
INTROGRESSION LINES UNDER DROUGHT AND CONTROLLED CONDITIONS
and Saket Dwivedi
2Department of Plant Molecular Biology and Genetic Engineering, Narendra Deva University of Agriculture and
a University of Agriculture and Technology,
The association among yield and yield components, their direct and indirect influences on grain yield introgression lines including check varieties. Analysis of variance for the design of experiment indicated that only three characters were non-significant and two characters racters were highly significant indicating variability among treatments under drought condition. Leaves per seedling significant and other. All the characters showed highly significant differences among treatments under control conditions except leaves per seedling, which 6 followed by IR82873-27, IR82936-16, IR 38 produced highest grain yield. These lines also possessed average to high Correlation coefficient analysis indicated that harvest index had the highest positive direct effect followed by biological yield/plant and kernel length on grain yield/plant in all environments and pooled level. Based on mean performance for majority of yield components, the above mentioned lines were identified as most promising to be incorporated in hybridization programme as donor parent for incorporation of these characters ated that biological yield and harvest index had maximum direct effect on grain yield at phenotypic and genotypic level under drought condition. Biological yield and harvest index had maximum direct effect on grain yield at phenotypic panicle and panicles per plant had maximum direct effect on grain yield at genotypic level under control condition. Seedling height, leaves per seedling and plant height exerted very high positive indirect effect on grain yield at phenotypic and genotypic level under control
, Academic Journals. All rights reserved.
In rice, the effect of drought varies with the variety, degree, and duration of stress and its coincidence with different growth stages. Rice’s susceptibility to water stress is more pronounced at the reproductive stage and causes the greatest reduction in grain yield when stress coincides with the irreversible reproductive processes (Matsushima, 1966; Cruz The genetic architecture of grain yield can be better resolved through components rather than yield , as the yield is the end product of multiplication interactions between various yield components (Grafius, 1959). The correlations provide information about inter-relationship among yield and its components, which is very
association with grain yield per panicle and significant negative correlation with plant height, panicle number per plant and chaffy grain number per panicle (Borbora et al., 2005). Grain yield/plant showed strong positive and highly significant association phenotypic levels in all the environments with panicle bearing tillers / plant, harvest-index, biological yield / plant, L / B ratio and significant positive correlation with 1000-grain weight in all environments and pooled level (Kumar et al., 2011). Studied on indica X japonica double haploid population of 114 homozygous lines in rice and reported a high positive indirect effect of panicle weight on grain yield through harvest-index and number of grains per panicle. Panicle weight followed by number of grains per panicle and harvest-index exerted maximum positive direct effect on grain yield per plant at phenotypic level (Bagali et al., 1999).
METHODS AND MATERIALS
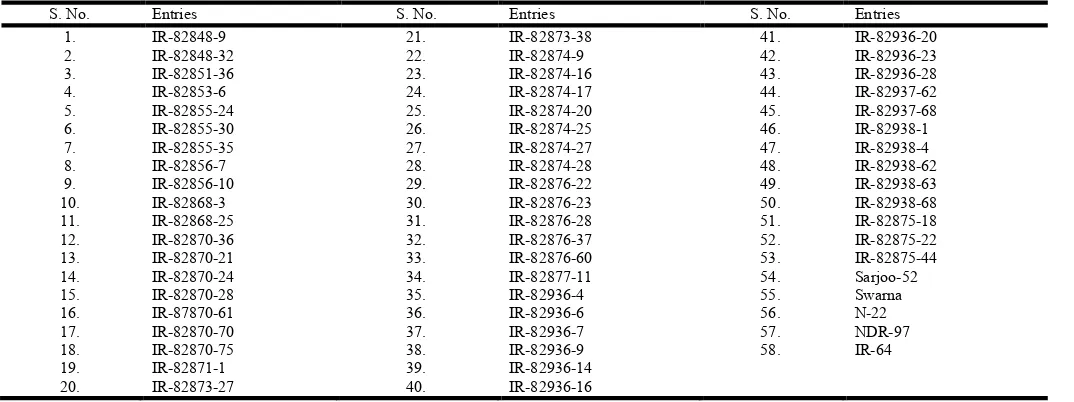
The material for this study consisted of 53 introgression lines developed in the genetic background of IR-64 and five check varieties namely Sarjoo 52, IR 64, Nagina-22, NDR-97 and Swarna. Entries of the experimental material are shows in Table 1. The nursery was grown at the Student Instructional Farm, N.D. University of Agriculture and Technology, Kumarganj, Faizabad and observed weather data during crop period (Kharif 2010-2011). The plant materials for vegetative and reproductive screening were used form this nursery. The introgression lines and checks were sown in nursery bed. After 28 days single seedling per hill were transplanted with 20 cm row to row and 15 cm plant to plant spacing in randomized complete block (RBD) design with three replications under drought stress and control (irrigated) condition. The crop was maintained properly at 120:60:60 kg/ha NPK level. The experiment was initially grown under irrigated condition. Drought treatment were applied after 60 days of sowing in stress conditions, while in case of control condition optimum moisture was maintained by frequent irrigations. Observations were recorded on randomly selected five plants from each entry line in each replication at maturity. These plants were harvested and threshed separately. The data were recorded on following characters: days to 50% flowering, plant height (cm), grain yield (g), leaf rolling, relative water content, panicle bearing tillers per plants, number of spikelet per panicle number of grains per panicle, spikelet fertility (%), test weight (g), biological yield (g), harvest index (%) and grain yield (g). The phenotypic correlation coefficient among different characters was carried out as per procedure suggested by Searle (1961). The path coefficient analysis was done as suggested by Dewey and Lu (1959).
RESULT AND DISCUSSION
The phenotypic and genotypic correlation coefficients were estimated among the fifty teen characters under drought and thirteen characters under control conditions are presented in Table 2a, 2b and 3a, 3b respectively.
Phenotypic correlation under drought condition
Grain yield exhibited highly significant and positive correlation with harvest index (0.46), biological yield (0.34),
seedling height (0.28) and grain yield (0.21). Spikelet fertility (-0.29) exhibited highly significant and negative correlation with grain yield. Tiller per plant (-0.15) and seedling height (-0.18) exhibited negative significant associated with harvest index. Panicles per plant (-0.22), plant height (0.27), test weight (-0.30) and biological yield (-0.65) exhibited negative highly significant associated with harvest index. Biological yield exhibited highly significant and positive correlation with seedling height (0.42) and test weight (0.27). Spikelet fertility (-0.18), leaves per seedling (-0.22) and plant height (-0.24) exhibited highly significant and negative correlation with biological yield. Test weight exhibited highly significant and negative correlation with leaf rolling (-0.22) and all characters exhibited negatively or positively correlation but all were non-significant with test weight. Spikelet fertility exhibited highly significant and negative correlation with plant height (-0.17) and seedling height (-0.19). Other characters showed negative and non-significant correlation with spikelet fertility. Number of grains per panicle exhibited highly significant and positive correlation with number of spikelet per panicle (0.74) and spikelet’s fertility (0.62).Whereas, other traits exhibited non-significant and positive or negative correlation with number of grains per panicle. Number of spikelet per panicle exhibited significant and positive correlation with relative water content (0.15).Whereas, other characters exhibited non-significant and positive or negative correlation with number of spikelet per panicle. Panicles per plant exhibited highly significant and positive correlation with tillers per plant (0.87) and seedling height (0.24). Days of 50% flowering (0.16) exhibited significant and positive correlation. Whereas other characters exhibited non-significant and positive or negative correlation with panicle per plant. Tillers per plant exhibited highly significant and positive correlation with seedling height (0.20). Leaf rolling (0.16) exhibited significant and positive correlation but relative water content (-0.10) exhibited significant and negative correlation with tiller per plant. Plant height exhibited significant and negative correlation with seedling height (-0.19). Whereas, other characters exhibited non-significant and positive or negative correlation with plant height. Relative water content exhibited highly significant and negative correlation with leaf rolling (-0.70). Whereas, other characters exhibited non-significant and positive or negative correlation with relative water content. Days of 50% flowering exhibited significant and positive correlation with seedling height (0.19) and leaves per seedling (0.15).Other characters exhibited and positive non-significant association with days of 50% flowering (Table 2a).
Phenotypic correlation under control condition
Table 1. Entries of the experimental material
S. No. Entries S. No. Entries S. No. Entries
1. IR-82848-9 21. IR-82873-38 41. IR-82936-20
2. IR-82848-32 22. IR-82874-9 42. IR-82936-23
3. IR-82851-36 23. IR-82874-16 43. IR-82936-28
4. IR-82853-6 24. IR-82874-17 44. IR-82937-62
5. IR-82855-24 25. IR-82874-20 45. IR-82937-68
6. IR-82855-30 26. IR-82874-25 46. IR-82938-1
7. IR-82855-35 27. IR-82874-27 47. IR-82938-4
8. IR-82856-7 28. IR-82874-28 48. IR-82938-62
9. IR-82856-10 29. IR-82876-22 49. IR-82938-63
10. IR-82868-3 30. IR-82876-23 50. IR-82938-68
11. IR-82868-25 31. IR-82876-28 51. IR-82875-18
12. IR-82870-36 32. IR-82876-37 52. IR-82875-22
13. IR-82870-21 33. IR-82876-60 53. IR-82875-44
14. IR-82870-24 34. IR-82877-11 54. Sarjoo-52
15. IR-82870-28 35. IR-82936-4 55. Swarna
16. IR-87870-61 36. IR-82936-6 56. N-22
17. IR-82870-70 37. IR-82936-7 57. NDR-97
18. IR-82870-75 38. IR-82936-9 58. IR-64
19. IR-82871-1 39. IR-82936-14
20. IR-82873-27 40. IR-82936-16
Table 2a: Estimates of phenotypic correlation coefficient between different characters in rice genotypes under drought conditions
S.No. Characters Seedling height
Leaves per seedling
Leaf rolling
Day of 50% flowering
Relative water content
P l a n t h e i g h t ( c m )
T i l l e r s p e r p l a n t s
P a n i c l e s p e r p l a n t
S p i k e l e t s p e r p a n i c l e
S p i k e l e t f e r t i l i t y
( % )
G r a i n s per panicle
T e s t w e i g h t
( g )
B i o l o g i c a l y i e l d ( g )
H a r v e s t In d e x
G r a i n y i e l d ( g )
1. Seedling height 1.00 0.08 0.04 0.19* 0.03 -0.19* 0.20** 0.24** 0.11 -0.19* -0.05 0.10 0.42** -0.18* 0.29**
2. Leaves per seedling 1.00 0.11 0.15* 0.00 0.06 -0.04 -0.04 0.14 -0.02 0.09 -0.22** -0.22** 0.10 -0.13
3. Leaf rolling 1.00 0.02 -0.70** -0.11 0.16* 0.13 -0.09 -0.03 -0.09 -0.08 0.05 -0.10 -0.06
4. Day of 50% flowering 1.00 0.13 -0.14 0.14 0.16* 0.14 -0.06 0.08 -0.10 0.01 0.06 0.10
5. Relative water content 1.00 0.05 -0.17* -0.11 0.15* -0.04 0.10 0.02 -0.02 0.04 0.02
6. P l a n t h e i g h t ( c m ) 1.00 -0.12 -0.14 0.13 -0.17* -0.01 0.02 -0.24** 0.27** 0.04
7. T i l l e r s p e r p l a n t s 1.00 0.87** 0.00 -0.03 -0.02 -0.01 0.07 -0.15* -0.07
8. P a n i c l e s p e r p l a n t 1.00 0.00 -0.01 -0.01 0.14 0.11 -0.22** -0.09
9. S p i k e l e t s p e r p a n i c l e 1.00 -0.04 0.75** 0.03 -0.02 -0.02 -0.03
10. S p i k e l e t f e r t i l i t y ( % ) 1.00 0.62** 0.03 -0.18* -0.02 -0.29**
11. G r a i n s per panicle 1.00 0.05 -0.13 -0.03 0.21**
12. T e s t w e i g h t ( g ) 1.00 0.27** -0.30** -0.07
13. B i o l o g i c a l y i e l d ( g ) 1.00 -0.65** 0.34**
14. H a r v e s t In d e x 1.00 0.46**
15. G r a i n y i e l d ( g ) -
[image:3.842.40.807.347.519.2]Table 2b: Estimates of phenotypic correlation coefficient between different characters in rice genotypes under control conditions
S.No. Characters Seedling
height
Leaves per seedling
Day of 50% flowering
Plant height (cm)
Tillers per plants
Panicle per plants
Spikelets per panicle
Spikelet fertility (%)
Grains per panicle
Test weight (g)
Biological yield (g)
Harvest Index (%)
Grain yield (g)
1. Seedling height 1.00 -0.18* 0.07 -0.09 -0.42** -0.36** 0.05 -0.13 -0.07 -0.10 0.09 0.07 0.23**
2. Leaves per seedling 1.00 0.13 0.16* 0.38** 0.21** -0.14 0.08 -0.08 -0.10 -0.15* 0.01 -0.16*
3. Day of 50% flowering 1.00 0.04 0.04 -0.05 0.05 0.06 0.08 0.14 0.01 -0.16* -0.19*
4. Plant height (cm) 1.00 0.18* 0.06 0.08 -0.03 0.05 0.12 -0.05 0.04 -0.02
5. Tillers per plants 1.00 0.71** -0.19* 0.31** 0.06 0.05 -0.07 -0.03 -0.14
6. Panicles per plant 1.00 -0.17* 0.31** 0.07 0.10 0.13 -0.06 0.04
7. Spikelets per panicle 1.00 -0.26** 0.71** 0.18* 0.12 -0.07 0.05
8. Spikelet fertility (%) 1.00 0.49** -0.16* -0.05 -0.08 -0.17*
9. Grains per panicle 1.00 0.05 0.08 -0.13 0.08
10. Test weight (g) 1.00 0.06 -0.04 0.02
11. Biological yield (g) 1.00 -0.61** 0.30**
12. Harvest Index (%) 1.00 0.53**
13. Grain yield (g)
-Table 3a: Direct and indirect effects for different characters on grain yield per plant at phenotypic level in rice genotypes under drought conditions
S.
No. Characters
Seedling height
Leaves per seedling
Leaf rolling
Day of 50% flowering
Relative water content
P l a n t h e i g h t
( c m )
T i l l e r s p e r p l a n t s
P a n i c l e s p e r p l a n t
S p i k e l e t s p e r p a n i c l e
S p i k e l e t f e r t i l i t y
( % )
G r a i n s per panicle
T e s t w e i g h t
( g )
B i o l o g i c a l y i e l d ( g )
H a r v e s t I n d e x
C o r r e l a t i o n w i t h g r a i n
y i e l d ( g )
1. Seedling height 0.030 0.000 -0.001 0.000 -0.001 0.003 -0.017 0.030 -0.007 0.087 -0.010 -0.003 0.449 -0.210 0.349
2. Leaves per seedling 0.002 -0.005 -0.003 0.000 0.000 -0.001 0.004 -0.005 -0.009 0.008 0.019 0.006 -0.240 0.116 -0.107
3. Leaf rolling 0.001 -0.001 -0.024 0.000 0.023 0.002 -0.014 0.016 0.006 0.015 -0.019 0.002 0.049 -0.114 -0.058
4. Day of 50% flowering 0.006 -0.001 0.000 0.001 -0.004 0.002 -0.012 0.019 -0.009 0.027 0.017 0.003 0.012 0.066 0.127
5. Relative water content 0.001 0.000 0.017 0.000 -0.033 -0.001 0.014 -0.013 -0.010 0.017 0.022 -0.001 -0.021 0.043 0.036
6. P l a n t h e i g h t ( c m ) -0.006 0.000 0.003 0.000 -0.002 -0.016 0.011 -0.017 -0.008 0.075 -0.002 0.000 -0.259 0.319 0.097
7. T i l l e r s p e r p l a n t s 0.006 0.000 -0.004 0.000 0.006 0.002 -0.086 0.105 0.000 0.014 -0.004 0.000 0.079 -0.180 -0.062
8. P a n i c l e s p e r p l a n t 0.007 0.000 -0.003 0.000 0.003 0.002 -0.074 0.121 0.000 0.005 -0.002 -0.004 0.123 -0.260 -0.082
9. S p i k e l e t s p e r p a n i c l e 0.003 -0.001 0.002 0.000 -0.005 -0.002 0.000 0.000 -0.064 0.018 0.162 -0.001 -0.022 -0.018 0.072
10. S p i k e l e t f e r t i l i t y ( % ) -0.006 0.000 0.001 0.000 0.001 0.003 0.003 -0.001 0.003 -0.454 0.134 -0.001 -0.198 -0.028 -0.544
11. G r a i n s per panicle -0.001 0.000 0.002 0.000 -0.003 0.000 0.002 -0.001 -0.049 -0.283 0.215 -0.001 -0.142 -0.035 -0.298
12. T e s t w e i g h t ( g ) 0.003 0.001 0.002 0.000 -0.001 0.000 0.001 0.017 -0.002 -0.014 0.010 -0.029 0.287 -0.352 -0.078
13. B i o l o g i c a l yi e l d ( g ) 0.012 0.001 -0.001 0.000 0.001 0.004 -0.006 0.014 0.001 0.084 -0.028 -0.008 1.071 -0.758 0.386
14. H a r v e s t I n d e x -0.005 -0.001 0.002 0.000 -0.001 -0.004 0.013 -0.027 0.001 0.011 -0.006 0.009 -0.695 1.168 0.465
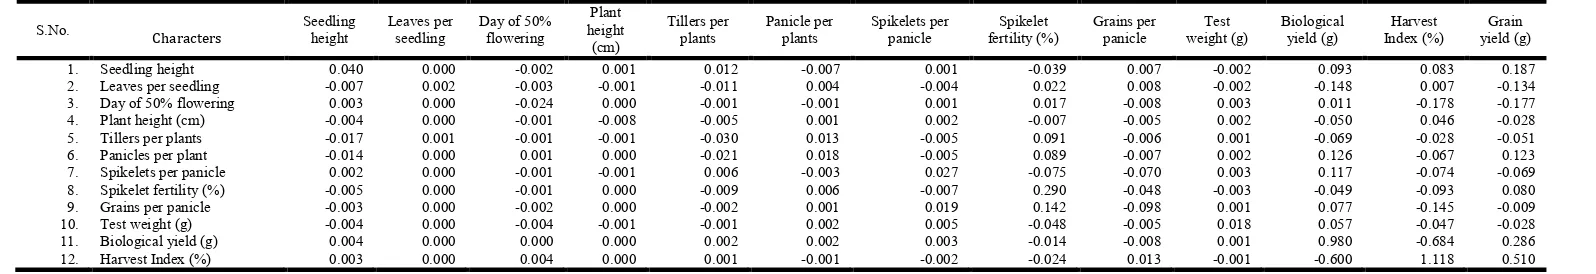
Table 3b: Direct and indirect effects for different characters on grain yield per plant at phenotypic level in rice genotypes under control conditions.
S.No. Characters Seedling
height
Leaves per seedling
Day of 50% flowering
Plant height (cm)
Tillers per plants
Panicle per plants
Spikelets per panicle
Spikelet fertility (%)
Grains per panicle
Test weight (g)
Biological yield (g)
Harvest Index (%)
Grain yield (g)
1. Seedling height 0.040 0.000 -0.002 0.001 0.012 -0.007 0.001 -0.039 0.007 -0.002 0.093 0.083 0.187
2. Leaves per seedling -0.007 0.002 -0.003 -0.001 -0.011 0.004 -0.004 0.022 0.008 -0.002 -0.148 0.007 -0.134
3. Day of 50% flowering 0.003 0.000 -0.024 0.000 -0.001 -0.001 0.001 0.017 -0.008 0.003 0.011 -0.178 -0.177
4. Plant height (cm) -0.004 0.000 -0.001 -0.008 -0.005 0.001 0.002 -0.007 -0.005 0.002 -0.050 0.046 -0.028
5. Tillers per plants -0.017 0.001 -0.001 -0.001 -0.030 0.013 -0.005 0.091 -0.006 0.001 -0.069 -0.028 -0.051
6. Panicles per plant -0.014 0.000 0.001 0.000 -0.021 0.018 -0.005 0.089 -0.007 0.002 0.126 -0.067 0.123
7. Spikelets per panicle 0.002 0.000 -0.001 -0.001 0.006 -0.003 0.027 -0.075 -0.070 0.003 0.117 -0.074 -0.069
8. Spikelet fertility (%) -0.005 0.000 -0.001 0.000 -0.009 0.006 -0.007 0.290 -0.048 -0.003 -0.049 -0.093 0.080
9. Grains per panicle -0.003 0.000 -0.002 0.000 -0.002 0.001 0.019 0.142 -0.098 0.001 0.077 -0.145 -0.009
10. Test weight (g) -0.004 0.000 -0.004 -0.001 -0.001 0.002 0.005 -0.048 -0.005 0.018 0.057 -0.047 -0.028
11. Biological yield (g) 0.004 0.000 0.000 0.000 0.002 0.002 0.003 -0.014 -0.008 0.001 0.980 -0.684 0.286
[image:4.842.40.817.241.397.2] [image:4.842.28.826.422.559.2]panicle (0.18) and negative significant correlation with spikelet fertility (-0.16). Other characters showed non-significant and negative or positive correlation with test weight. Spikelet fertility exhibited highly significant and positive correlation with tiller per plant (0.31) and panicle per plant (0.31). Negative highly significant correlation with spikelet per panicle (-0.26). Rest characters showed non-significant and negative or positive correlation with spikelet fertility. Grains per panicle exhibited highly significant and positive correlation with spikelet per panicle (0.71) and spikelet fertility (0.49). Other characters showed non-significant and negative or positive correlation with grains per panicle. Spikelets per panicle exhibited significant and negative correlation with all character with panicle per plant (-0.17) and tiller per plant (-0.19). And other characters showed non-significant and negative or positive correlation with spikelets per panicle. Panicles per plant exhibited highly significant and positive correlation with tillers per plant (0.71) and leaves per seedling (0.21). Seedling height (-0.36) is exhibited highly significant and negative correlation with panicles per plant. Tillers per plant exhibited highly significant and positive correlation with leaves per plant (0.38). Plant height (0.18) exhibited significant and positive correlation. Seedling height (-0.42) is exhibited highly significant and negative correlation with tillers per plant. Plant height exhibited significant and positive correlation with leaves per seedling (0.16) (Table 2b).
Phenotypic path coefficient analysis under drought condition
The highest positive and direct effect on grain yield was exhibited by harvest index (1.17) followed by biological yield (1.07), grain per panicle (0.21), panicle per plant (0.12), seedling height (0.03), leaf rolling (0.02) and days of 50% flowering (0.00). Negative direct effect was recorded by spikelets fertility (-0.45), tillers per plant (-0.08), spikelets per panicle (-0.06), relative water content (-0.03) and plant height (-0.01). Plant height (0.319) recorded highest indirect effect followed by leaves per seedling (0.116), days of 50% flowering (0.066) and relative water content (0.043) on grain yield via. Harvest index. The highest negative indirect effect of biological yield (-0.758) followed by test weight (-0.352), panicles per plant (-0.260), seedling height (-0.210), tillers per
plant (-0.180), leaf rolling (-0.114), grains per panicle (-0.035), spikelets fertility (-0.028) and spikelets per panicle (-0.022) were reported on grain yield per plant via. Harvest
index (Table 3a).
Phenotypic path coefficient analysis under control condition
Direct and indirect effects of different characters on grain yield at phenotypic level under control conditions are given in Table 4.6b.The highest positive and direct effect on grain yield was exhibited by harvest index (1.118) followed by biological yield (0.980), spikelets fertility (0.290), seedling height (0.040), spikelets per panicle (0.027), panicles per plant (0.018), test weight (0.018) and leaves per plant (0.002).
Negative direct effect was recorded by grains per panicle (-0.098), tillers per plant (-0.030), days of 50% flowering (-0.024), and plant height (-0.01). Seedling height (0.083)
recorded highest positive indirect effect followed by plant height (0.046) and leaves per seedling (0.007) on grain yield via. Harvest index. Biological yield (-0.684) showed highest
negative indirect effect followed by day of 50% flowering (-0.178), grains per panicle (-0.145) spikelet fertility (-0.093),
spikelet per panicle (-0.074), panicle per plant (-0.067), test weight (-0.047) and tillers per plant (-0.028) on grain yield via Harvest index (Table 3b).
Conclusion
In summary, the phenotypic coefficients of variability (PCV) were higher than genotypic coefficients of variability (GCV) for all the characters. The maximum PCV and GCV under drought conditions were observed for harvest index, biological yield and grain yield. Under control conditions the maximum PCV and GCV were observed for harvest index, tillers per plant, biological yield and grain yield. The above mentioned lines were identified as most promising to be incorporated in hybridization programme as donor parent for incorporation of these characters along with drought tolerance.
REFERENCES
Bagali, P.G., Hittalmani, S. and Shashidhar, H.E. 1999. Character association and path coefficient analysis in indica х Japonica doubled haploid population of rice. Oryza. 36 (10): 12.
Borbora, T.K., Hazarika, G.N. and Medhi, A.K. 2005. Correlation and path analysis for panicle characters in rice. Crop Research. 30 (2):215-220.
Cruz, R.T. and O’Toole, J.C. 1984. Dry land rice response to an irrigation gradient at flowering stage. Agron J. 76:178– 183
Dewey, D.R. and Lu, K.H. 1959. A correlation and path analysis of components of crested wheat grass seed production. Agron. J. 57:515—518.
Dey, M.M. and Upadhyaya, H.K. 1996. Yield loss due to drought, cold and submergence tolerance. In: Evenson RE, Herdt RW and Hossain M (Eds.), Rice Research in Asia: Progress and Priorities. International Rice Research Institute in Collaboration with CAB International, UK. Grafius, J.G. 1959. Genetic and environmental relationship of
components of yield, maturity and plant height in F2-F3
soybean populations. Iowa State Coll. J. Sci., 30: 373-374.
Hernandez, J.A., Ferrer, M.A., Jimenez, A., Barceló, A.R. and Sevilla, F. 2001. Antioxidant system and O2/H2O2 production in the apoplast of Pisum sativum L. leaves: its relation with NaCl-induced necrotic lesions in minor veins, Plant Physiol. 127:817–831.
Kumar, Y., Singh, B.N., Verma, O.P., Tripathi, S. and Dwivedi, D.K. 2011. Correlation and Path Coefficient Analysis in Scented Rice (Oryza sativa L.) under Sodicity.Environment & Ecology29 (3B): 1550-1556. Lawlor, D.W. 2002. Limitation to photosynthesis in water
stressed leaves: stomata vs metabolism and role of ATP, Ann. Bot. 89: 871–885.
Ludlow, M.M. and Muchow, R.C. 1990. A critical evaluation of traits for improving crop yields in water-limited environments, Adv. Agron. 43:107–153.
Marekar, R.V. and Siddiqui, M.A. 1996. Genetic variability and correlation studies in rice. Journal of Maharashtra Agriculture Universities, 21(2): 249-251.
Matsushima, S. 1966. Crop Science in Rice: Theory of Yield Determination and Its Application. Fuji Publishing, Tokyo, pp 365
Reddy, Y.A.N., Prasad, T.G. and Kumar, M.U. 1995. Genotypic variations for yield attributes and yield of rice. Madras Agric. J. 82(4): 310-313.
Searle, S. 1961. Phenotypic, genotypic and environmental correlations. Biometrics. 17: 474-480.
Wang, F.Z., Wang, Q.B., Kwon, S.Y., Kwak, S.S. and Su, W.A. 2005. Enhanced drought tolerance of transgenic rice plants expressing a pea manganese superoxide dismutase, J. Plant Physiol. 162:465–472.
Zhu, J.K. 2002. Salt and drought stress signal transduction in plants, Annu. Rev. Plant Biol. 53:247–273.