Development and Validation of Chiral HPLC Method
for Identification and Quantification of (R)-Enantiomer
in Ezetimibe
Kameswara Rao Chimalakonda, Venkatanarayana Gudala, Madhusudhan Gutta, Srinivasulu Polisetty, Sai Venkata Srinivas Koduri
Inogent Laboratory, Jawaharlal Nehru Technological University, Hyderabad, India Email: [email protected]
Received May 6, 2012; revised May 26, 2012; accepted June 11, 2012
ABSTRACT
A normal phase enantioselective high performance liquid chromatographic method was developed for enantiomeric resolution of Ezetimibe it reduces the overall delivery of cholesterol to the liver. The enantiomers of Ezetimibe were resolved on a Chiral Pak AS-H (250 × 4.6 mm, 5 µm) column using a mobile phase system containing n-hexane, etha-nol, 2-propanol and trifloroacetic acid (84:12:4:0.1 v/v). The resolution between enantiomers was found to be more than 2.0. The limit of detection and limit of quantification of (R)-enantiomer were found to be 0.2 µg/mL and 0.5 µg/mL, respectively, for 10 µL injection volume. The sample solution and mobile phase were found to be stable for at least 48 h. The final optimized method was successfully applied to separate (R)-enantiomer from Ezetimibe and was proven to be reproducible and accurate for the quantitative determination of (R)-enantiomer in bulk drugs.
Keywords: Ezetimibe; (R)-Enantiomer; Identification; Quantification and Validation
1. Introduction
Enantiomers of racemic drugs often show different be- haviors in pharmacological action and metabolic process. It is not uncommon for one enantiomer to be active while other isomer is toxic in biological systems. The pharma- ceutical industry has raised its emphasis on the genera- tion of enantiomerically pure compounds before under taking phamarmacokinetic, metabolic, physiological, and toxicological evaluation in the search for drugs with grater therapeutic benefits and low toxicity [1,2]. Now- adays, chiral separations are playing more and more im- portant role for the analysis of single enantiomers in the field of pharmaceutical industry [3]. However, the deve- lopment of the methods for the quantitative analysis of Chiral compounds and for the assessment of enantio- meric purity is extremely challenging, because the same physical and chemical properties of the two enantiomers make discriminating and separating them very difficulty [4].
Ezetimibe was a selective inhibitor of intestinal cho- lesterol and related phytosterol absorption, is designated as 1-(4-fluorophenyl)-3(R)-[3-(4-fluorophenyl)-3(S)-hyd roxypropyl]-4(S)-(4-hydroxypenyl)-2-azetidinone [5]. Eze- timibe selectively prevents the absorption of cholesterol from dietary and biliary sources by blocking the transport
of cholesterol through the intestinal wall. This reduces the overall delivery of cholesterol to the liver, there by promoting the synthesis of LDL receptors and the sub-sequent reduction in serum LDL-C [6,7]. Few HPLC methods for the determination of Ezetimibe and its phar- maceutical dosage forms were reported in literatures [8- 10]. The (R)-enantiomer is an undesired enantiomer, which can be present as a chiral impurity without any pharma-cological and toxipharma-cological reports by now. So it is es-sential to find a effective way to analyze the enantiomers of Ezetimibe, the chemical structures Ezetimibe and (R)- enantiomer are shown in Figure 1.
Ezetimibe, is reported by Normal phase liquid chroma- tography using modified amylose as chiral stationary phases. The aim of this work was to optimize the chro- matographic conditions in terms of temperature and mo- bile phase composition in order to separate, identify and quantify the enantiomer of Ezetimibe. The developed chi- ral HPLC method was reproducible and accurate for the quantitative determination of (R)-enantiomer in Ezeti- mibe.
2. Experimental
2.1. Chemicals and Reagents
Figure 1. (3R,4S)-1-(4-fluorophenyl)-3-[(3S)-3-(4-fluorophe- nyl)-3-hydroxypropyl]-4-(4-hydroxyphenyl)azetidin-2-one.
R & D department of Inogent Laboratory (Hyderabad, India). Chemical structure is presented in Figure 1. HP- LC grade n-hexane, 2-propanal, trifluoroaceticacid and ethanol was purchased from Merck (Mumbai, India). Stock solution of analyte were prepared in n-hexane and ethanol in the ratio (80:20) (diluent) at a concentration 1 mg/mL. Ezetimibe and (R)-enantiomer (the undesired enantiomer (99% ee)) were prepared in the laboratory by using preparative HPLC.
2.2. Chromatographic Conditions
Chromatography was carried out by using Agilent Tech- nologies 1200 series instrument equipped with column oven, UV detector, and the data was processed using a computer program (chemestation, Dayton, OH). The chr- omatographic conditions were optimized using a chiral stationary phase, Chiralpak AS-H column (250 × 4.6 mm, 5 µm, Daicel, Japan). The isocratic mobile phase compo- sition was a mixture of n-hexane, ethanol, 2-propanol and trifluoroacetic acid (84:12:4:0.1 v/v), which was pumped at a flow rate of 1 mL/min. The temperature of the col-umn was maintained at 30˚C and the eluent was moni-tored at a wavelength of 230 nm. The injection volume was 10 µL.
The chromatographic parameters, including the reten- tion factor (k), the separation factor (α), and the resolu- tion (Rs) were selected to evaluate the separation of com- pounds. All the chromatographic results were repeated three times.
2.3. Sample Preparation
Stock solutions of Ezetimibe (1 mg/mL) and (R)-enantio- mer (1 mg/mL) were prepared by dissolving appropriate amount of the substance in n-hexane and ethanol in the ratio (80:20). The analyte concentration of Ezetimibe was fixed as 1000 µg/mL. Ezetimibe solutions spiked with low levels of (R)-enantiomer were prepared by transferring calculated amount of undesired enantiomer stock solution with pipette into the calculated amount of Ezetimibe stock solution, and then the solution was added to volume with diluent and mixed well.
2.4. Validation of the Method
The specificity of the method is performed by injecting both isomers and recemic mixture individually. The spe-
cificity determined by using peak purity, resolution. The system suitability of the method performed by adding known concentration (5.0 µg/mL) of undesired isomer to Ezetimibe. The system suitability is confirmed by using resolution, tailing factor, Tangent.
Method reproducibility was determined by measuring repeatability and intermediate precision of retention times and peak areas for each enantiomer. The repeatability of the method was determined by analyzing six replicate injections containing Ezetimibe (1000 µg/mL) spiked with (R)-enantiomer (0.3%, 3 µg/mL). The intermediate precision was determined over 3 days by performing six successive injections (n = 6) each day and also performed intermediate precision with different system, different analyst and with different column by using six injections (n = 6).
The limit of detection (LOD) and limit of Quantifica- tion (LOQ) for (R)-enantiomer was achieved by injecting a series of dilute solutions of by using standard deviation slope method (ICH Q2 (R1)). The LOQ level precision of the developed chiral method for (R)-enantiomer was checked by analyzing six solutions of (R)-enantiomer prepared at LOQ level and calculating the percentage re- lative standard deviation of area.
Detector response linearity was assessed by preparing eight calibration sample solutions of (R)-enantiomer co- vering from 0.5 µg/mL (LOQ) to 12 µg/mL (0.5, 1.5, 3.0, 4.5, 7.5, 9.0, 10.5 and 12 µg/mL) in diluent. The regres- sion curve was obtained by plotting peak area versus concentrations, using the least square method. The per- centage relative standard deviation of the slope and y- intercept of the calibration curve was calculated.
The accuracy of method was carried out by injecting known concentration of R-enantiomer to the Ezetimibe. The accuracy was calculated in terms of recovery (%). The study was carried out in triplicate at covering from 1.5 µg/mL to 12 µg/mL (1.5, 3.0, 4.5, 7.5, 9.0, 10.5 and 12 µg/mL) in diluent. The recovery of (R)-enantiomer was calculated.
To determine robustness of the method, flow rate was changed at the pace of 0.2 units from 0.8 to 1.2 mL/min. The effect of change in the percent 2-propanol and etha- nol (±10%), and column temperature at 25˚C and 35˚C instead of 30˚C were studied, and the other chromato- graphic conditions were held constant as stated previ- ously.
The solution stability of Ezetimibe at analyte concen- tration was studied by keeping the solution in tightly capped volumetric flask at room temperature on a labo- ratory bench for 48 h. The content of (R)-enantiomer was checked at 6 h interval up to the study period. Mobile phase stability was carried out by evaluating the content of (R)-enantiomer in Ezetimibe sample solutions pre- pared freshly at 6 h interval of 48 h. The same mobile
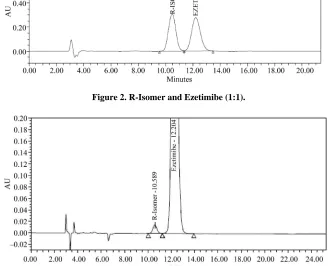
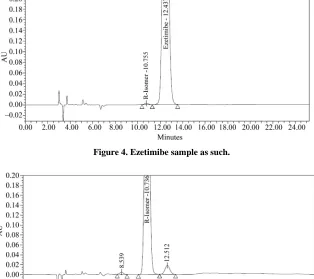
[image:2.595.116.230.85.141.2]phase was used during the study period. from the method development and optimization activities, Chiralpak AS-H (250 × 4.6 mm, 5 µm) column with mo-bile phase of n-hexane, ethanol, 2-propanol and trifluo- roacetic acid (84:12:4:0.1 v/v) was selected from the me- thod development. The flow rate of the final method was 1.0 mL/min with injection volume 10 µL. The column temperature was 30˚C, and the detection wavelength was 230 nm. Under these conditions, the two enantiomers were separated well and the peak of (R)-enantiomer eluted before the peak of Ezetimibe. In the optimized method, the typical retention time of (R)-enantiomer and Ezetimibe were 10.4, 12.2 min, respectively. Base line separation of Ezetimibe and (R)-enantiomer was obtained with total run time of 25 min. The separation of an ap-proximately 1:1 (wt/wt) mixture solution (in diluent) of the two enantiomers in shown in Figure 2 HPLC chro-matogram of Ezetimibe bulk drug sample (1000 µg/mL) spiked with (R)-enantiomer (0.3%) was shown in Figure 3.
3. Results and Discussion
3.1. Optimization of Chromatographic Conditions
Racemic mixture solution of Ezetimibe and (R)-enan- tiomer (1000 µg/mL each) prepared in diluents was used in the method development. To develop a rugged and suitable normal phase HPLC method for the separation of the two enantiomers, different stationary phases and mobile phases were employed. Chiralpak AS-H column (250 × 4.6 mm, 5 µm) with mobile phase consisting of n- hexane, ethanol, 2-propanol and trifluoroacetic acid (84: 12:4:0.1 v/v) was used. It was continued to select the best stationary and mobile phases that would give optimum resolution and selectivity for the two enantiomers. There was an indication of separation on Chiralpak AS-H (250 × 4.6 mm, 5 µm) column using a mobile phase consisting of n-hexane, ethanol, 2-propanol and trifluoroacetic acid acid (84:12:4:0.1 v/v). The composition of the mobile phase was optimized to enhance the chromatographic efficiency and resolution between the enantiomers. The results of resolution factor (Rs) and selectiveity factor (α) are summarized in Table 1. Based on the data obtained
3.2. Validation Results of the Method
[image:3.595.135.453.400.530.2]The HPLC condition of the final method was evaluated for its specificity, LOD, LOQ, linearity, accuracy, preci- sion, robustness and stability.
Figure 2. R-Isomer and Ezetimibe (1:1).
[image:3.595.129.457.447.713.2]Table 1. Specificity.
Compound Purity angle Purity threshold Peak purity
R-Isomer 0.9325 2.3458 Pass
Ezetimibe 3.5871 4.6204 Pass
The specificity of the method was determined by using peak purity.
The specificity results are given in Table 1.
The LOD and LOQ concentrations were estimated 0.2 µg/mL and 1.0 µg/mL for (R)-enantiomer. Calculated the LOD and LOQ by using standard and slope method. The LOD and LOQ values for (R)-enantiomer were 0.2 µg and 0.5 µg. Method precision for (R)-enantiomer at LOQ was less than 2.0% RSD. Therefore, this method had adequate sensitivity for the detection and estimation of (R)-enantiomer in Ezetimibe. R-Isomer and Ezetimibe indi- vidual sample chromatograms are shown in Figures 4
and 5.
Good linearity of (R)-enantiomer was evaluated over eight levels of (R)-enantiomer solutions from 0.5 µg/mL to 12 µg/mL, with the linear regression equation y = mx + c, where x is the concentration in µg/mL, and y is the corresponding peak area of undesired enantiomer in mV/s. We observed linear results with respect to concen- tration for (R)-enantiomer. The correlation coefficient value is more than 0.999 (Table 2). The linearity graph was shown in Figure 6.
The standard addition and recovery experiments were conducted for (R)-enantiomer in bulk samples in tripli- cate at 1.5 µg/mL to 12 µg/mL (1.5, 3.0, 4.5, 7.5, 9.0, 10.5 and 12 µg/mL). The accuracy was in terms of re- covery (%). The recovery was calculated by back calcu- lated concentration at each level in each preparation. The recovery is not less than 99.6% and not more than 102.2% (Table 3).
The repeatability and intermediate precision were ex- pressed as relative standard deviation (RSD). For this study, solution of Ezetimibe (1000 µg/mL) spiked with (R)-enantiomer (0.3%, 3 µg/mL) was analyzed in six in- jections to establish repeatability. RSD values were bet- ter than 0.5% for the retention times of both the enanti- omers. In the intermediate precision study results shown that RSD values were in same order of magnitude than those obtained for repeatability studies (Table 4). All these values indicated that the method was precise.
The method robustness studies were demonstrated by adjusting flow rate, column temperature and mobile pha- se composition variations. The chromatographic resolu- tion of Ezetimibe and (R)-enantiomer was more than 2.0 under all separation conditions tested (Table 5), demon- strated sufficient robustness.
The stability of the solution and mobile phase used in
Table 2. Linearity.
S.No Concentration (%) R-Isomer peak (n = 6)
1 0.05 11331.0
2 0.15 33375.3
3 0.30 68981.3
4 0.45 101922.7
5 0.75 168752.7
6 0.90 202998.7
7 1.05 237024.7
8 1.20 270043.7
Correlation coefficient 0.99998
Slope 225064.81
Y-intercept 358.22
r2 0.99996
Table 3. Accuracy.
Added amount (µg) Recovery (%) %RSD (n = 3)
1.5 99.33 1.01
3.0 101.67 0.76
4.5 102.00 0.33
7.5 101.87 0.26
9.0 100.33 0.68
10.5 99.24 1.13
12.0 100.75 0.25
Table 4. Ruggedness.
Name %RSD (n = 6)
Day-1 0.2
Day-2 0.5
Day-3 0.4
Diff system 0.6
Diff column 0.7
Diff analyst 0.4
Table 5. Robustness.
Description USP Tailing USP Tangent
USP Resolution
Column flow: 0.80 mL/min 1.1 3817 2.5
Column flow: 1.20 mL/min 1.0 4525 2.1
Column Temp: 25˚C 1.0 4049 2.1
Column Temp: 35˚C 1.1 3302 2.4
Organic ratio: 110% 1.1 3142 2.1
Organic ratio: 90% 1.1 4557 2.4
Figure 4. Ezetimibe sample as such.
[image:5.595.65.279.440.573.2]Figure 5. Chromatogram of R-Isomer.
Figure 6. Linearity graph.
this method was tested over a long time. No significance change in (R)-enantiomer content was observed in Ezeti- mibe sample during solution stability and mobile phase stability experiments, and the RSD values were less than 2.0% for (R)-enantiomer peak area. No unknown peak was observed in above stability conditions. Hence, the Ezetimibe sample solution and the mobile phase were stable for at least 48 h.
4. Conclusion
A simple, specific, linear, accurate and precise normal
phase HPLC method was successfully developed, which was capable of separating the undesired enantiomer from Ezetimibe. Amylose based chiral column Chiralpak AS- H column was found to be selective for the enantiomers of Ezetimibe. The developed and validated method can be used for the chiral purity testing of Ezetimibe. The de- veloped method is also stable and can be used for the quantitative determination of chiral impurity in bulk ma- terials.
5. Batch Analysis
By using this method we can anlyze and quantify (R)- enantiomer in Ezetimibe in manufacturing batches and R & D samples. We get repeatable results in all QC sam- ple.
6. Acknowledgements
The authors would like to acknowledge the management of Inogent Laboratories Private Limited, Hyderabad, In- dia.
REFERENCES
To-day, Vol. 9, No. 3, 2004, pp. 105-110. doi:10.1016/S1359-6446(03)02904-0
[2] J. Caldwell, “Importance of Stereospecific Bionalytical Monitoring in Drug Development,” Journal of
Chroma-tography A, Vol. 719, No. 1, 1996, pp. 3-13. doi:10.1016/0021-9673(95)00465-3
[3] N. M. Maier, P. Franco and W. Lindner, “Separation of Enantiomers: Needs Challenges, Perspectives,” Journal
of Chromatography A, Vol. 906, No. 1-2, 2001, pp. 3-33. doi:10.1016/S0021-9673(00)00532-X
[4] T. E. Beesley and R. P. W. Scott, “Chiral Chroma
. Xu, R. Fu, S. W. Chen, et al., “Ezetimibe Analogs togra-phy,”John Wiley & Sons, Ltd., Chichester, 1998, pp. 23- 26.
[5] X. X
with a Reorganized Azetidinone Ring: Design, Synthesis, and Evaluation of Cholesterol Absorption Inhibitions,”
Bioorganic & Medicinal Chemistry Letter, Vol. 17, No. 1, 2007, pp. 101-104. doi:10.1016/j.bmcl.2006.09.078 [6] E. Leitersdorf, “Selective Cholesterol Absorption
Inhibi-tion: A Novel Strategy in Lipid-Lowering Management,”
International Journal of Clinical Practice, Vol. 56, No. 2, 2002, pp. 116-119.
[7] M. Van Heek, C. Farley and D. S. Compton, “Ezetimibe Selectively Inhibits Intestinal Cholesterol Absorption in Rodents in Presence and Absence of Exocrine Pancreatic Function,” British Journal of Pharmacology, Vol. 134, No. 2, 2001, pp. 409-417. doi:10.1038/sj.bjp.0704260 [8] S. Singh, B. Singh, R. Bahuguna, L. Wadhwa and R.
Saxena, “Stress Degradation Studies on Ezetimibe and Development of a Validated Stability-Indicating HPLC Assay,” Journal of Pharmaceutical and Biomedical Analy-
sis, Vol. 41, No. 3, 2006, pp. 1037-1040. doi:10.1016/j.jpba.2006.01.030
[9] R. Sistla, V. S. Tata, Y. V. Kashyap, D. Chandrasekar and P. V. Diwan, “Development and Validation of a Reversed- Phase HPLC Method for the Determination of Ezetimibe in Pharmaceutical Dosage Forms,” Journal of Pharmaceu-
tical and Biomedical Analysis, Vol. 39, No. 3-4, 2005, pp. 517-522. doi:10.1016/j.jpba.2005.04.026
[10] B. G. Chaudhari, N. M. Patel and P. B. Shah, “Stabil-ity-Indicating Reversed-Phase Liquid Chromatographic Method for Simultaneous Determination of Simvastatin and Ezetimibe from Their Combination Drug Products,”
Journal of AOAC International, Vol. 90, No. 5, 2007, pp. 1242-1249.
![Figure 1. (3R,4S)-1-(4-fluorophenyl)-3-[(3S)-3-(4-fluorophe- nyl)-3-hydroxypropyl]-4-(4-hydroxyphenyl)azetidin-2-one](https://thumb-us.123doks.com/thumbv2/123dok_us/9288588.424251/2.595.116.230.85.141/figure-fluorophenyl-fluorophe-nyl-hydroxypropyl-hydroxyphenyl-azetidin-one.webp)