Exploration of uncertainties and risk metrics for
Aerospace and Defence Sector of Developing Countries
and further studying the Interrelationship amongst
various risk factors using ISM Methodology
Mukesh Bansal
IAS, Raipur, Chhattisgarh, India
Remica Aggarwal
MIT School of Education & Research MIT Art, Design & Technological University Pune,
India
ABSTRACT
The Indian aerospace industry is one of the fastest-growing aerospace markets in the world with an expanding consumer base comprising airlines, businesses and high net worth individuals. The rapid growth of this industry has attracted major global aerospace companies to India. All segments in the aerospace industry, including civil and military aviation and space, are showing a significant level of growth. While the long-term outlook for airlines remains robust, recent record growth is likely to slow as the aerospace industry weathers a soft patch driven by a cyclical slowdown in Asia and other key emerging markets . Few industry sectors are as sensitive to the macroeconomic environment as the aerospace sector. When the economy sniffles, the aerospace sector is often the first to catch the cold. And when the recovery is underway, it is often the aerospace sector that is the first to leap out ahead. Demand in the aerospace industry has increased sharply since the recession ended. There are several factors driving growth in manufacturing in India’s aerospace industry. These include both macro and micro factors - strong economic growth that has resulted in rapidly growing domestic aircraft demand, the liberalization of civil aviation policies, offset requirements, a strong domestic manufacturing base, cost advantages, a well-educated talent pool, the ability to leverage IT competitiveness and a liberal Special Economic Zones law that provides attractive fiscal benefits for developers and manufacturers. The challenges include access to technology, funding, poor availability and high cost of raw material and certification processes. However , less exploration has been done with respect to various categories of risks involved in the defense sector particularly with respect to developing countries. This research focuses on first exploring the various risks and thereafter studying the inter-relationships amongst them using ISM methodology .
Keywords
Indian aerospace industry ; ISM methodology ; Defense sector; Aircraft and aviation industry
1.
INTRODUCTION
World is rapidly changing . Change , uncertainty and disruption are rife across the aerospace and defence sectors across the world. India is working hard to develop a national capability in space, ship building , aerospace component , manufacturing and cyber [1,2]. Japan is on the cusp of launching their own indigenous aerospace capability beginning with the recent launch of Mitsubishi Regional Jet (MRJ) and Honda jet and eventually leading to large commercial planes and fighter jet. Additionally, China is
working hard to create their own capabilities across a variety of A& D segments . India is clearly a major player in world defence market .
What is clear is that changes now underway across both the aerospace and the defence sector are not short term or cyclical trends . Indeed they are rapidly changing the very dynamics and fundamentals of global A&D sector. The global defence market has been in a rapid transition as traditional leading players address declining domestic markets through pursuit of export markets . High investments by emerging market nations has both driven demands and also created new domestic champions which are now also pursuing export opportunities. Global defense spending increased marginally in 2015-16 and is estimated to further increased in 2017 after declining steadily since 2011. The reversal in the decline trend was a response to increase geopolitical uncertainty driven by measures taken by the government to counter terrorist activities . Such measures includes upgrading of capabilities to prepare their militaries against political upheavals; Revisit of defense strategies due to Russia’s political tension with Ukraine and the increasing threat from terrorist organizations especially the Islamic cities of Iraq and Syria which has set an alarm for the attack prone countries to modernize and upgrade their military arsenal .
The various defense measures are always appended with some or the other kind of risk . Though , global commercial aerospace military market has the positive long term outlook , supported by rising global GDP and increasing global air traffic etc. which underpinned the 8-10 years forward production for the original equipment manufacturers (OEMs) and the supply chains ; but still they also faced significant risks in pursuing them . These risks encompass their strategic initiatives , their financial positions , their global operations as well as their compliance requirements in the different markets where they operate . The players with the best understanding of these risks will be in a better place to win the race of sustainable profit growth.
2.
LITERATURE REVIEW
2.1
World’s strongest militaries [1,2]
Each year since 2006, the Global Fire Power Index has ranked 137 modern military powers using 55 different metrics to give each country a score based on their size, finances, and number of high tech equipment. A perfect score in the index is 0. The top most rank holders are US [Power Index (PI) :0.0615) with a total aircraft strength of 13,398 aircraft, including 5,760 helicopters in service and a whopping military budget of $716bn acquires the top most position, the US also has the world’s largest defence budget, $492bn more than China – the world’s second largest defence spender. This is followed by Russia (PI: 0.0639) who is possessing 21,932 combat tanks and more than 50,000 armoured fighting vehicles and self – propelled artillery and most of all making it all possible with a miniature budget of $44bn. Russia also has a strong navy, with a total of 352 assets including 82 corvettes. China ( PI: 0.0673) acquires the third position with the top most in towed artillery of 6246 and having the second largest defence budget of whopping $ 224 bn . India (PI: 0.1065) maintains a strong air force and navy, according to the index, ranking 3rd for the number of transport aircraft, at 248, and in 4th place in terms of total aircraft strength, including jet fighters and attack aircraft, and in 5th for total helicopter strength and a topper in terms of its possession of 139 patrol vessels. Overall India acquires a fourth position with the defence budget of $55.2bn for 2019, smaller than the US and China, but slightly larger than Russia’s spending. France (PI: 0.1584) military budget for 2019 stands at $40.5bn in total. It acquires fifth position because of its strong air-force and navy strength . The French Armed forces operate 1,248 different aircraft and 566 helicopters. It has a relatively medium sized navy with 118 naval assets in total, including four aircraft carriers – more than Russia, China and India. Japan (PI: 0.1707) acquires sixth position with a defence budget of $47bn for 2019, according to the Global Fire Power Index. Similar to France, Japan’s military strength lies in its aircraft and naval assets with a total aircraft strength with 1,572 aircraft, and for total helicopter strength with 636. This includes 119 attack helicopters, for which is only bested by three other nations. It also owns 131 naval assets in total including four aircraft carriers, and 37 destroyer warships – the second highest number of destroyers owned by any nation. Finally at seventh place , the position is acquire by South Korea (PI: 0.1761) which is maintaining a good balance between its armed forces , air force as well as navy. The force’s total aircraft strength is ranked in 5th while its total helicopter strength is 4th. Furthermore, it is also ranked the 4th best nation for its number of self-propelled and towed artillery, of which it has 2,140 and 3,854 respectively. South Korea’s national defense budget of $38bn in 2019 places it in 10th on the list of richest militaries.
2.2
History of Indian aerospace sector [1]
Seth Walchand Hirachand established the first ever Indian aircraft company named Hindustan aircraft limited in 1940 which later merged with aeronautics India limited and aircraft manufacturing depot , Kanpur to form India’s largest aerospace major , Hindustan Aeronautics Limited (HAL) . HAL is a prominent government controlled entity and maintains 19 production units and 9 R& D centres in seven locations. HAL has been involved in several R&D programs for both defence and civil aviation and has assumed a significant role in India’s space programs. In 1942 , IISc , India’s premier centre for research and post graduate education in science and engineering , offered a two year
program in aeronautical engineering. In 1948 , the aeronautical society of India was established to integrate engineers , professionals and industrialists towards a common goal of furthering the growth of aerospace sector in India. In 1958 , Defence Research and Development Organization was formed with the merging of the former Technical Development Establishment ( of the Indian Army ) and the Directorate of Technical Development and Production and the Defence Science Organization. Today , the organization has a network of over 50 laboratories which are engaged in developing defence technologies covering disciplines like aeronautics , armaments , defence , missiles , advanced computing etc. In 1959 , National Aerospace Laboratories , Bangalore was formed under CSIR, the premier research R&D organization of India. By the mid-1970s , NAL was the major player in Indian Aeronautics and one of the CSIR best managed national laboratories with the approval of India’s largest light combat aircraft in 1983.
3.
EXPLORATION OF VARIOUS RISKS
Given below are the most common risks that major A&D players from across the globe are facing upon [1-9] .
Risk 1 : Volatility in geo-political and Economic conditions ( VGEC)
Threat of economic slowdown and rising political tension. For most of the A& D countries , their operational and financial performance depend significantly on geo-political and economic conditions in their key markets . On the commercial aerospace side , sustained economic growth and political stability are major underlying factors to drive long term growth in air traffic. On the defense side, political and economic conditions of the developed as well as emerging countries play an instrumental role in dictating the government allocations of funds for military purpose.
Risk 2 : Poor management of large supply chain network (PMSCN)
Poor management of large supply chain network lead to risks of product delays and cost over-runs . As OEMs ramp up production to deliver their large backlogs , suppliers across different levels in supply chains would be under pressure for timely delivery , while maintaining quality and keeping costs under control. Achieving the right operational excellence and ability to access capital to support the production growth can be key challenges to Aeronautics , Aerospace and Defence players to keep pace with growing demand.
Risk 3 : Failure to handle competition in domestic and International Market (FCDIM)
In the face of budget constraints , government are focusing on cost in their push to identify more affordable solutions . Their efforts have included performing certain work internally rather than hiring a contractor and reducing product development cycles. They also fragment large contracts especially in IT and services contract into smaller contracts and thereby hand over these contracts to smaller companies primarily on the basis of price competitiveness. Furthermore , some customers including Department of Defence , US are turning to commercial contractors instead of traditional defence contractors for products and services in IT cyber security and domain.
Risk 4 : Managing and retaining talent (MRT)
business critical processes . In addition certain personnel may be required to receive security clearance and substantial training in order to work on certain programs and perform certain tasks.
Risk 5 : Ineffective succession planning , lack of diversity and limited options for talent mobility (ISP/LD)
Companies need to manage leadership management and succession planning throughout their business. While most of the companies have process in place for management transition and transfer of knowledge , loss of key personnel coupled with the inability to adequately train other personnel , hire new personnel or transfer knowledge could significantly impact their ability to perform under their contracts. On the other hand, as A& D players expand their operations internationally, it becomes increasingly important to hire personnel with relevant experience in local laws , traditions , regulations and business practices. Inability to retain or trained qualified personnel may lead to materially adverse effects on revenue and earnings .
Risk 6 : Failed programs and contracts (FPC)
Failed programs and contracts adversely affect the brand value and financial performance of A&D companies . Due to untested and unproven complex designs and new technologies , A&D players may experience technological challenges and other performance hindrances resulted in delays, setbacks , cost overruns and product failures. The increasing commitment of companies to guarantee a certain level of performance is resulted into higher risk exposure in case the performance level is not achieved. Failure to deliver major programs on time as well as adhering to quality and technical standards within budget , in case of fixed price and cost performance contracts may lead to termination of orders , imposition of penalties and loss of orders.
Risk 7 : Failure to comply to regulations and restrictions (FCRR)
Failure to comply to regulations and restrictions may lead to severe consequences including imposition of fines and penalties , termination of whole contract, civil or criminal investigations or proceedings. Furthermore A&D players are also subject to risks associated with changes in accounting and revenue recognition standards. Asa a result , companies have to see the periodic and variable impacts on their revenues due from adjustment in contract estimates particularly on large contracts with a longer performance period.
Risk 8 : Intellectual property infringement risks (IPIR)
Being a technologically advanced market , the A&D industry is subject to intellectual property infringement risks. Furthermore the IP laws vary from nation to nation. The protection provided by IP law of nation may not be as adequate for A& D players.
Risk 9 : High exposure to bribery and corruption risk (HEBC)
As the customer base for A&D companies include government customers and research agencies , they have to operate in a highly regulated environment. This subjects A&D companies to added scrutiny around corruption and bribery . Operating in countries with high levels of corruption often multiplies the level of exposure to corruptions and bribery litigations.
Risk 10: Low number of export markets (LNEM)
Weak export control laws can significantly impact the financials of the company. Lower number of export market where the defence contractors can export , may have a
significant adverse impact on business, result of operation and financial condition as more than 50 % of the revenue for A&D players comes from export market.
Risk 11 : Poor M&A and partnership decisions ( PPD)
Poor M& A decisions might result into over evaluation of acquired business , failure in achieving synergies , inability to retain talents and financial challenges.
Risk 12 : Threat of cyber- attacks (TCA)
Increased digitization increases the threat of cyber- attacks on A&D players . A&D transfers large amount of data including flight data monitoring , flight operations quality assurance and load management between end user , manufacturer and service provider. In commercial aerospace , key craft functions such as flight navigation and controls , propulsions , landing and braking , and information systems are managed by embedded electronic systems and safety critical software . the critical data generated during the time of flight is analyzed for better flight safety and optimization. On the defense side of business, upgradation of existing weapons as well as increased focus on intelligence , surveillance and reconnaissance (ISR) have increased the information flow within the supply chains .
Risk 13: Foreign currency and commodity price fluctuations (FCCPF)
Operating in multiple countries across continents , A&D organizations are susceptible to changes and fluctuations in forging currency exchange rates. Given that most of the A&D companies have global footprints , they earn significant portion of their revenues from the foreign currency rather than their home market currency . With foreign currency fluctuations , value of revenue earned in foreign currency also fluctuates. Further fluctuations in commodity prices also lead to issues across supply chains . It might lead to late delivery , increased failure probability by smaller suppliers .
Risk 14. Deep Défense budget uncertainty (DDBU)
This risk is particularly existing for US Department of Defense . US defense budget has been in under significant pressure for some time now. The reality is that where aerospace tend to grow head of the economy – defence budget tend to lag shift in the economy. It takes time for economic growth to translate in to tax receipts and ultimately into spendable public expenditure. So while the US economy may be growing , overall government budget may continue to be depressed.
Risk 15. Rising costs, lower margins (RCLM):
In larger part, the increase in costs has more to do with expenses (such as R&D investments and—potentially— employee pension costs) shifting from the DoD’s balance sheet onto the private sector’s balance sheet which, in turn, is putting downward pressure on margins. Government is struggling to balance defence spending against the need to fund and sustain the ballooning costs for mandatory program entitlement spending in areas such as social security , medi-care and federal debt repayment. Margins are also under pressure in the United States due to tougher DoD contracting terms, limited opportunities for further cost cutting, and an end to some short-term favorable Estimate at Completion (EAC) adjustments which benefited defense contractors over the past 2 to 3 years.
Risk 16 : Risk of move to low cost countries (RMLCC)
instability , intellectual property right violations , production delays as well as quality issues .
4.
INTERPRETIVE STRUCTURAL
MODELLING METHODOLOGY
Various risk factors have been further studied for the possible inter-relationship amongst them using ISM methodology [7] . The technique is a computer assisted learning technique for establishing the contextual relationships amongst the selected metrics or criteria or indicators. The process goes via a series of steps ranging from designing a structural self-interaction matrix then initial reachability matrix and thereafter a final reachability matrix. From the final reachability matrix, a diagraph could be drawn after the elements are arranged in different levels in a series of iterations.
5.
DEVELOPMENT OF ISM MODEL
In this section, ISM model is developed for studying the interrelationships amongst various challenges for aerospace and aviation sector of countries like India . About 16 challenges have been identified viz. Volatility in geo-political and Economic conditions (VGEC)/ threat of economic slow-down; Poor management of large supply chain network (PMSCN); failure to handle competition in domestic and International Market (FCDIM) ; Challenge of managing and retaining talent (MRT); Ineffective succession planning , lack of diversity and limited options for talent mobility (ISP/LD) ; Failed programs and contracts (FPC) ; Failure to comply to regulations and restrictions (FCRR) ; Intellectual property infringement risks (IPIR); High exposure to bribery and corruption risk (HEBC) ; Low number of export markets (LNEM) ; Poor M&A and partnership decisions ( PPD); Threat of cyber-attacks (TCA) ; Foreign currency and commodity price fluctuations (FCCPF) ; Deep Défense budget uncertainty (DDBU) ; Rising costs, lower margins (RCLM) ; Risk of move to low cost countries (RMLCC).
Explanation : Poor supply chain management may lead to failed contracts . Economic slowdown could be the result of
poor supply chain management , challenge in maintaining and retaining appropriate talent, competition in domestic market etc. Poor management may result in high exposure to bribery in order to somehow maintain the situation. Poor supply chain management also result in low number of export markets ; poor M&A and partnership decisions may result in poor supply chain management as well as challenge of maintaining and retaining talent. Foreign currency fluctuation may result in failed programs and contracts. Foreign currency fluctuation could result in rising costs lower margins , rise of move to low cost countries . DDBU could also result in RMLCC. competition in international and domestic market may lead to infringement of intellectual property rights as well as high exposure to bribery and corruption. Failed program and contracts , failure to comply to regulations and failure to handle competition in market are all interrelated . Lack of diversity and challenge to maintaining talent could lead to failure to handle competition in domestic market and this in turn will lead to low number of export market . DDBU and RCLM will lead to MRT which in turn will lead to RMLCC. Failed programs is prone to cyber- attacks as well as infringement of intellectual property rights . Move to low cost countries can also lead to cyber -attacks and create security issues .
5.1
Construction of Structural Self
-Interaction Matrix (SSIM)
This matrix gives the pair-wise relationship between two variables i.e. i and j based on VAXO. SSIM has been presented below in Fig 1.
5.2
Construction of Initial Reachability
Matrix and final reachability matrix
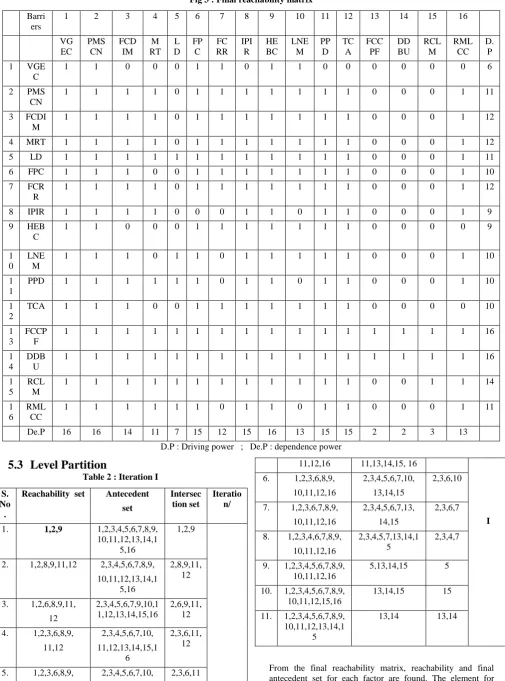
[image:4.595.47.556.485.770.2]The SSIM has been converted in to a binary matrix called the initial reachability matrix shown in fig. 2 by substituting V, A, X, O by 1 or 0 as per the case. After incorporating the transitivity, the final reachability matrix is shown below in the Fig 3.
Fig 1: SSIM matrix for pair wise relationship amongst barriers
S.N o.
Barrie rs
1 2 3 4 5 6 7 8 9 10 11 12 13 14 15 16
VG EC
PMS CN
FCDI M
MR T
L D
FP C
FC RR
IPI R
HE BC
LNE M
PP D
TC A
FCC PF
DD BU
RCL M
RML CC
1 VGE
C
X A A A A A O A A A A A A A A
2 PMS
CN
A A A V X O X V A O A A A A
3 FCDI
M
A A X X V V V X A A A A A
4 MRT A V A V V O A O O A A V
5 LD V O O V V V O O A A A
6 FPC A V V A V V A A A V
7 FCR
R
V V O V V O A A V
8 IPIR A O X X O A A A
9 HEB
C
A A A A A A V
M
11 PPD O A A A V
12 TCA O A A A
13 FCCP F
V V V
14 DDB
U
V V
15 RCL
M
V
16 RML
[image:5.595.52.549.259.733.2]CC
Fig 2: Initial reachability matrix
S.N o.
Barrie rs
1 2 3 4 5 6 7 8 9 10 11 12 13 14 15 16
VG EC
PMS CN
FCDI M
MR T
L D
FP C
FC RR
IPI R
HE BC
LNE M
PP D
TC A
FCC PF
DD BU
RCL M
RML CC
1 VGE
C
1 1 0 0 0 0 0 0 0 0 0 0 0 0 0 0
2 PMS
CN
1 1 0 0 0 1 1 0 1 1 0 0 0 0 0 0
3 FCDI
M
1 1 1 0 0 1 1 1 1 1 1 0 0 0 0 0
4 MRT 1 1 1 1 0 1 0 1 1 0 0 0 0 0 0 1
5 LD 1 1 1 1 1 1 0 0 1 1 1 0 0 0 0 0
6 FPC 1 0 1 0 0 1 0 1 1 0 1 1 0 0 0 1
7 FCR
R
1 1 1 1 0 1 1 1 1 0 1 1 0 0 0 1
8 IPIR 0 0 0 0 0 0 0 1 0 0 1 1 0 0 0 0
9 HEB
C
1 1 0 0 0 0 0 1 1 0 0 0 0 0 0 0
10 LNE
M
1 0 0 0 0 1 0 0 1 1 0 0 0 0 0 1
11 PPD 1 1 1 1 0 0 0 1 1 0 1 0 0 0 0 1
12 TCA 1 0 1 0 0 0 0 1 1 0 0 1 0 0 0 0
13 FCCP F
1 1 1 0 0 1 0 0 1 1 1 0 1 1 1 1
14 DDB
U
1 1 1 1 1 1 1 1 1 1 1 1 0 1 1 1
15 RCL
M
1 1 1 1 1 1 1 1 1 1 1 1 0 0 1 1
16 RML
CC
Fig 3 : Final reachability matrix
Barri ers
1 2 3 4 5 6 7 8 9 10 11 12 13 14 15 16
VG EC
PMS CN
FCD IM
M RT
L D
FP C
FC RR
IPI R
HE BC
LNE M
PP D
TC A
FCC PF
DD BU
RCL M
RML CC
D. P
1 VGE C
1 1 0 0 0 1 1 0 1 1 0 0 0 0 0 0 6
2 PMS CN
1 1 1 1 0 1 1 1 1 1 1 1 0 0 0 1 11
3 FCDI M
1 1 1 1 0 1 1 1 1 1 1 1 0 0 0 1 12
4 MRT 1 1 1 1 0 1 1 1 1 1 1 1 0 0 0 1 12
5 LD 1 1 1 1 1 1 1 1 1 1 1 1 0 0 0 1 11
6 FPC 1 1 1 0 0 1 1 1 1 1 1 1 0 0 0 1 10
7 FCR R
1 1 1 1 0 1 1 1 1 1 1 1 0 0 0 1 12
8 IPIR 1 1 1 1 0 0 0 1 1 0 1 1 0 0 0 1 9
9 HEB C
1 1 0 0 0 1 1 1 1 1 1 1 0 0 0 0 9
1 0
LNE M
1 1 1 0 1 1 0 1 1 1 1 1 0 0 0 1 10
1 1
PPD 1 1 1 1 1 1 0 1 1 0 1 1 0 0 0 1 10
1 2
TCA 1 1 1 0 0 1 1 1 1 1 1 1 0 0 0 0 10
1 3
FCCP F
1 1 1 1 1 1 1 1 1 1 1 1 1 1 1 1 16
1 4
DDB U
1 1 1 1 1 1 1 1 1 1 1 1 1 1 1 1 16
1 5
RCL M
1 1 1 1 1 1 1 1 1 1 1 1 0 0 1 1 14
1 6
RML CC
1 1 1 1 1 1 0 1 1 0 1 1 0 0 0 1 11
De.P 16 16 14 11 7 15 12 15 16 13 15 15 2 2 3 13
D.P : Driving power ; De.P : dependence power
5.3
Level Partition
Table 2 : Iteration I
S. No .
Reachability set Antecedent
set
Intersec tion set
Iteratio n/
1. 1,2,9 1,2,3,4,5,6,7,8,9, 10,11,12,13,14,1
5,16
1,2,9
2. 1,2,8,9,11,12 2,3,4,5,6,7,8,9,
10,11,12,13,14,1 5,16
2,8,9,11, 12
3. 1,2,6,8,9,11,
12
2,3,4,5,6,7,9,10,1 1,12,13,14,15,16
2,6,9,11, 12
4. 1,2,3,6,8,9,
11,12
2,3,4,5,6,7,10,
11,12,13,14,15,1 6
2,3,6,11, 12
5. 1,2,3,6,8,9, 2,3,4,5,6,7,10, 2,3,6,11
11,12,16 11,13,14,15, 16
I 6. 1,2,3,6,8,9,
10,11,12,16
2,3,4,5,6,7,10,
13,14,15
2,3,6,10
7. 1,2,3,6,7,8,9,
10,11,12,16
2,3,4,5,6,7,13,
14,15
2,3,6,7
8. 1,2,3,4,6,7,8,9,
10,11,12,16
2,3,4,5,7,13,14,1 5
2,3,4,7
9. 1,2,3,4,5,6,7,8,9, 10,11,12,16
5,13,14,15 5
10. 1,2,3,4,5,6,7,8,9, 10,11,12,15,16
13,14,15 15
11. 1,2,3,4,5,6,7,8,9, 10,11,12,13,14,1
5
13,14 13,14
which the reachability and intersection sets are same are the top-level element in the ISM hierarchy. After the identification of top level element, it is separated out from the other elements and the process continues for next level of elements. Reachability set, antecedent set, intersection set along with different level for elements have been shown below in table 4 to table 10.
Table 3 : Iteration II
S.No .
Reachability set
Antecedent set Intersec tion set
Itera tion 2. 8,11,12 3,4,5,6,7,8,10,11,12,
13,14,15,16
8,11,12
II 3. 6,8,11,12 3,4,5,6,7,10,11,12,
13,14,15,16
6,11,12
4. 3,6,8,11,12 3,4,5,6,7,10,11,12, 13,14,15,16
3,6,11, 12 5. 3,6,8,11,12,1
6
3,4,5,6,7,10,11,13, 14,15,16
3,6,11
6. 3,6,8,10,11,1 2,16
3,4,5,6,7,10,13,14, 15
3,6,10
7. 3,6,7,8,10, 11,12,16
3,4,5,6,7,13,14,15 3,6,7
8. 3,4,6,7,8,10, 11,12,16
3,4,5,7,13,14,15 3,4,7
9. 3,4,5,6,7,8, 10,11,12,16
5,13,14,15 5
10. 3,4,5,6,7,8, 10,11,12,15, 16
13,14,15 15
11. 3,4,5,6,7,8, 10,11,12,13, 14,15
13,14 13,14
Table 4 : Iteration III
Sr. No.
Reachability set
Antecedent set Intersection set
Itera tion
3. 6 3,4,5,6,7,10,13,1
4,15,16
6
III 4. 3,6 3,4,5,6,7,10,13,1
4,15,16
3,6
5. 3,6,16 3,4,5,6,7,10,13,1 4,15,16
3,6
6. 3,6,10,16 3,4,5,6,7,10,13,1 4,15
3,6,10
7. 3,6,7,10,16 3,4,5,6,7,13,14,1 5
3,6,7
8. 3,4,6,7,10,16 3,4,5,7,13,14,15 3,4,7 9. 3,4,5,6,7,10,
16
5,13,14,15 5
10. 3,4,5,6,7,10, 15,16
13,14,15 15
11. 3,4,5,6,7,10, 13,14,15
13,14 13,14
Table 6 : Iteration IV
S.No .
Reachability set
Antecedent set Intersect ion set
Iteratio n/ Levels
6. 10 4,5,7,10,13,14,
15
10
7. 7,10 4,5,7,13,14,15 7 IV
8. 4,7,10 4,5,7,13,14,15 4,7
9. 4,5,7,10 5,13,14,15 5
10. 4,5,7,10,15 13,14,15 15
11. 4,5,7,10,13,1 4,15
13,14 13,14
Table 7 : Iteration V
Sr. No.
Reachability set
Antecedent set
Intersection set
Itera tion
7. 7 4,5,7,13,14,1
5
7
V
8. 4,7 4,5,7,13,14,1
5
4,7
9. 4,5,7 5,13,14,15 5
10. 4,5,7,15 13,14,15 15
11. 4,5,7,13,14,15 13,14 13,14
Table 8 : Iteration VI
Sr. No.
Reachability set
Antecedent set Intersection set
Itera tion
9. 5 5,13,14,15 5
VI
10. 5,15 13,14,15 15
11. 5,13,14,15 13,14 13,14
Table 9 : Iteration VII
Sr. No.
Reachabilit y set
Antecedent set Intersection set
Itera tion
10. 15 13,14,15 15
VII
11. 13,14,15 13,14 13,14
Table 10 : Iteration VIII
Sr. No.
Reachability set
Antecedent set Intersection set
Itera tion
11. 13,14 13,14 13,14 VIII
11. 9,16 9,12,13 9
12. 9,12,13,16 9,12,13 9,12,13
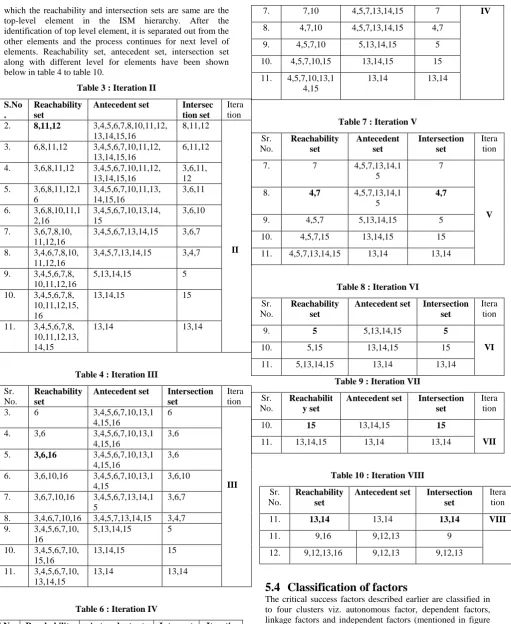
5.4
Classification of factors
Fig . 4: Driving power and dependence diagram
5.5
ISM model
An ISM model is developed ( as shown in fig. 5 below ) after arranging the elements as per their interaction or dependence relationships.
Fig 5: ISM diagraph
6.
LITERARY OBSERVATIONS
This section concludes with some of the literary observations that could be helpful to reader .
In order to a success in defence , government is taking and continue taking a number of steps , such as junking of DPP, redesigning of defence offset programs , enhancing the FDI limits and ease of doing business etc.
Secondly as the financial budgets are limited , defence contractors are expanding their reach into new geographies either through DoD-led foreign military sales or, increasingly, through direct commercial sales. For others, it has meant adapting their current products and capabilities for use in civilian and commercial settings in order to capture adjacent vertical markets.
Thirdly , The more forward-looking organizations, however, are now taking steps to fully rethink their portfolio of products and services and, in doing so, are developing and/or acquiring new capabilities in key growth areas such as cybersecurity, data management, mission software development, and underperforming assets.
Fourthly, the market dynamics are changing with leaner development cycles , lower costs and faster speed to market. In this environment therefore it is required that traditional defence players should play close attention as well as maintain good relations with new entrants with credentials in aligned industry .
Finally , from adapting products to adjacent markets and building new partnerships with non-traditional players such as technology providers , the defence sector is undergoing an era of convergence.
7.
ACKNOWLEDGEMENTS
Co-author Remica Aggarwal is thankful to her friend Ms. Benita Mary Jaiker (IPS) Delhi , India for the motivation to write this piece of manuscript. She is also thankful to her mentor Prof. S.P. Singh for imparting the knowledge about ISM methodology .
8.
REFERENCES
[1] Maiti, S . 2019. Top ten risks in Aerospace and Defense (A&D) . EY website , ey.com/publications. Accessed August 2019.
2. KPMG report 2016. Growth and uncertainty. Highs and lows in the aerospace and defense sectors. https://assets.kpmg.com › content › dam › kpmg › pdf › 2016/04 › growth-and-uncertainty.pdf
[3] Haver Analytics, Markit , US Bureau of Labor Statistics, KPMG economics .
[4] Trends in World Military Expenditure 2014.
[5] Airbus points to supply chain after missing A350 target , Flight global , 12 January 2016 via Dow Jones Factiva.
[6] 3D printing creates new parts for aircraft engines . GE
global research website .
geglobalresearch.com/innovation/3dprinting-creates-newparts-aircraft-engine.
[7] Enabling talents to drive innovation in A&D , EY website , ey.com/ publication/vwLUA assets/EY-enabling talent in aerospace and defence/$file/EY enabling talent in aerospace and defense .pdf
[8] Additive manufacturing . How airbus is printing the future. AMT Aircraft Maintenance Technology. March 2017 via Dow Jones Factiva , copyright Cygnus Business Media .
[9] A revolution in the making : digital technology is transforming manufacturing , making it leaner and smarter and raising the prospects of an American industrial revival. The wall street Journal online , June 2013 via Dow Jones Factiva .
[10] Warfield, J.N. 1974. Developing interconnection matrices in structural modeling. IEEE Transactions on Systems, Man, and Cybernetics, (1), 81-87.
Driv ing pow er
16 FCCP F, DDBU
15
14 RCL
M 13
12 MRT,
FCRR
FCDI M
11 Driver Linkage LD RM
LCC
PMSC N
10 LNE
M FPC PPD,
TCA
9 IPIR HEBC
8
7 Dependent
6 VGEC
5 Autonomous 4
3 2 1
[image:8.595.84.250.333.575.2]1 2 3 4 5 6 7 8 9 10 11 12 13 14 15 16 DEPENDENCE
Figure 2 : Interpretive structural model LD
LNEM
TCA FPC
FCDIM
PPD
RMLCC
VGEC HEBC
IPIR
PMSCN MRT FCRR