ISSN Online: 1945-3086 ISSN Print: 1945-3078
DOI: 10.4236/wsn.2018.104005 Apr. 30, 2018 93 Wireless Sensor Network
Airborne Sensor Network for Atmospheric
Profiling
Tyler Horton, Michael Bolt, Craig Prather, John Manobianco, Mark L. Adams
Department of Electrical and Computer Engineering, Auburn University, Auburn, AL, USA
Abstract
The need for higher spatial/temporal resolution in-situ atmospheric sensing has been established by both weather and climate researchers. In order to ad-dress this need, an airborne wireless sensor network called GlobalSense is currently being developed. GlobalSense is based on low-cost airborne probes that collect environmental data as they fall slowly through the atmosphere and on portable base stations that receive the data being collected. This paper presents an overview of this GlobalSense system as well as preliminary results from ground-based system testing.
Keywords
Biomimetic, Airborne, Atmospheric Sensing
1. Introduction
Improving weather modeling and forecasting has numerous social and economic benefits. For example, more than 3% of the United States’ gross domestic prod-uct is affected by weather variability, which amounts to approximately $485 bil-lion as of 2008 [1]. Additionally, it was estimated that for every 1˚C increase in forecast accuracy, electric utilities would be able to save an additional $59 mil-lion per year, as scheduling electricity generation to meet demand could be done more accurately [2]. However, improving meteorological modeling is not a trivi-al task and requires increased spatitrivi-al and temportrivi-al data accuracy and resolution
[3]. Most measurements utilized by forecasters rely on images and radar from both satellites [4] [5] and ground based systems [6]. These systems are limited in that they cannot provide the full set of parameters necessary for modeling and predicting weather since they do not make direct measurements of all mod-el-dependent variables like temperature, pressure, and moisture. Thus, gathering How to cite this paper: Horton, T., Bolt,
M., Prather, C., Manobianco, J. and Adams, M.L. (2018) Airborne Sensor Network for Atmospheric Profiling. Wireless Sensor Network, 10, 93-101.
https://doi.org/10.4236/wsn.2018.104005
Received: January 19, 2018 Accepted: April 27, 2018 Published: April 30, 2018
Copyright © 2018 by authors and Scientific Research Publishing Inc. This work is licensed under the Creative Commons Attribution International License (CC BY 4.0).
DOI: 10.4236/wsn.2018.104005 94 Wireless Sensor Network in-situ data has a distinct advantage over these systems in this regard. However, the technologies used to gather in-situ data are fairly limited. These technologies include weather balloons [7], dropsondes [8], sporadically located ground sta-tions [9], and aircraft communications addressing and report system (ACARS) data [10]. Unfortunately, these technologies are not able to gather in-situ data with high spatial and temporal resolution and are especially limited for collect-ing data on storms and other significant atmospheric phenomena [11].
To help address the lack of in-situ data available, an airborne environmental sensing system called GlobalSense is being designed and tested. This paper first gives an overview of the GlobalSense wireless network and sensing system. Next, the wireless network that is utilized for GlobalSense is addressed, including the individual environmental sensing nodes and the receiving, processing, and sto-rage subsystem. Finally, testing that verifies the functionality of the full sensor network will be presented.
2. GlobalSense System
2.1. Overview
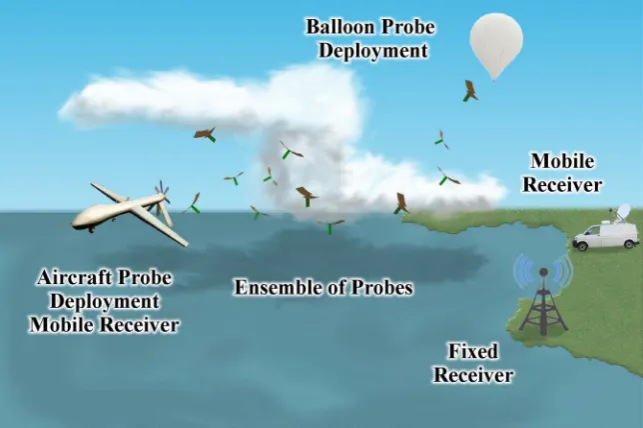
The GlobalSense system was designed to provide in-situ atmospheric data with higher spatial and temporal density than is currently available. To achieve this, the system consists of an ensemble of airborne environmental sensing motes, or eMotes, which are deployed at altitude over atmospheric events of interest as seen in Figure 1. Up to 2080 eMotes weighing approximately 11 g each can be deployed simultaneously and fall at an average velocity of 2.5 m/s, providing significantly more in-situ data than comparable dropsondes which have a ter-minal velocity at sea level of 11 m/s and can only be deployed in small numbers
[image:2.595.213.535.492.706.2][8]. Each eMote transmits temperature, air pressure, and relative humidity val-ues alongside GPS coordinates, timestamps and inertial measurement unit
DOI:10.4236/wsn.2018.104005 95 Wireless Sensor Network (IMU) data once per second to a receiver station for logging and post-processing. Since it is possible to deploy significant numbers of eMotes concurrently, spa-tially dense networks over large areas can be achieved. For example, with an av-erage 500 m spacing between each eMote, a 500 km2 area can be covered. This level of spatial density helps minimize gaps between data points, and allows for improved interpolation of data.
2.2. eMote Design
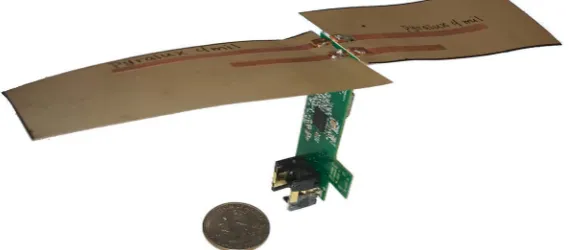
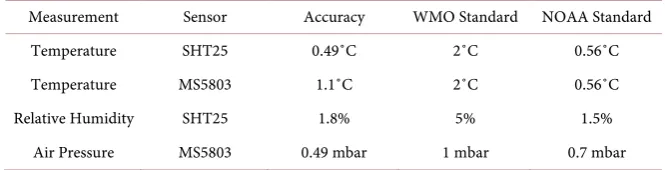
The eMote, shown in Figure 2, is designed to mimic the shape of a maple seed, or samara [12], [13]. This shape is achieved with a rotor structure attached to the main circuit board, with a 915 MHz Industrial, Scientific, and Medical (ISM) band antenna alongside a 1575 MHz GPS L1 band antenna contained in the ro-tor structure. The ISM band antenna is connected to a Texas Instruments CC430F5137 microcontroller with a built-in transceiver to transmit data from a Measurement Specialties MS5803 temperature/air pressure sensor, a Sensirion SHT25 temperature/relative humidity sensor, LSM9DS3 inertial measurement unit, and U-Blox Max-M8 GPS receiver module. The accuracies of these sensors were determined through environmental chamber testing at Auburn University and Oak Ridge National Laboratories, as well as through small-scale deploy-ments described in [11]. The accuracies of these sensors are well within the World Meteorological Organization (WMO) standards [14] for data reporting and are listed in Table 1 alongside these standards, as well as standards from the National Oceanic and Atmospheric Administration (NOAA) [15].
In order to offset the cost of the eMotes, the devices can be reused for many deployments. Since each eMote will continue transmitting its location as long as the battery lasts, the GPS coordinates can be used to locate the devices once they have landed. While it may not be possible to recover all of the eMotes, depend-ing on where each one lands, the costs of subsequent deployments can still be significantly reduced.
2.3. Receiver System
[image:3.595.232.517.574.699.2]The GlobalSense system includes a receiver system consisting of several RF front
DOI: 10.4236/wsn.2018.104005 96 Wireless Sensor Network
Table 1. Measured sensor accuracies alongside data reporting standards for different
me-teorological organizations.
Measurement Sensor Accuracy WMO Standard NOAA Standard
Temperature SHT25 0.49˚C 2˚C 0.56˚C
Temperature MS5803 1.1˚C 2˚C 0.56˚C
Relative Humidity SHT25 1.8% 5% 1.5%
Air Pressure MS5803 0.49 mbar 1 mbar 0.7 mbar
ends to receive data transmissions from the individual eMotes. Each RF front end is a Texas Instruments CC1101 radio module attached to a Tiva-C micro-controller configured to receive data from a single channel. Multiple RF front ends are networked together via Ethernet to a single computer, which runs sev-eral Python scripts to log the received data to both comma separated value (csv) files and a database for post-processing and real-time visualization respectively. The RF front ends have been tested and validated at ranges of up to 19.8 km, with calculations indicating the maximum range for data reception to be ap-proximately 50 km with a 10 dBm transmit power; this longer distance has been verified in an anechoic chamber utilizing in-line attenuators to approximate range but has not been verified with in-situ testing.
3. Wireless Network
In order to facilitate the collection and storage of the environmental data, the eMotes were equipped with radios to transmit the data to receiving units. In the implemented scheme, each eMote functions as a node in the spatially distributed sensing network that captures environmental conditions, creates and encodes a packet with this data, and then transmits this data using a hardware radio core. The receiver platforms contain hardware and software to decode data packets from numerous eMotes and store or retransmit the information to other loca-tions.
3.1. eMote Transmission Scheme
DOI:10.4236/wsn.2018.104005 97 Wireless Sensor Network its recorded data, using GPS timing. Based on this ID number, the software dy-namically rearranges each software task to not interfere with data transmission, which has the highest priority.
However, the total number of eMotes could be increased with minor modifi-cations. For example, the transmission time could be reduced by decreasing the margin between sequential transmissions on a channel. To allow for a generous margin of error, each transmission is given a time slot of 50 milliseconds that could be reduced as low as 35 milliseconds. Additionally, if data readings are required less frequently, each radio channel would be able to support an addi-tional 19 eMotes for every second added between transmissions.
3.2. Transmission Robustness
Due to the use of inherently noisy channels and the need to maximize transmis-sions, processes were implemented to improve transmission reliability and range. First, the radio module used on the eMote was configured to transmit at a power of 10 dBm. Second, cyclical redundancy checks (CRC) are calculated for every packet using the algorithm described in [16] and then appended to the end of the packet. This helps the receiver detect any bit changes that may have oc-curred to the originally transmitted packet. Additionally, a forward error correc-tion (FEC) algorithm [17] was implemented. FEC allows for extended transmis-sion range through an increased signal-to-noise ratio, as it incorporates redun-dancy into the transmitted packet. As a result, the receiver can correct a limited number of errors that could occur during packet transmission [17].
Finally, it is worth addressing that even though the eMotes may be operating over a range up to 50 km, this large gap between multiple eMotes will not affect the transmission robustness. The propagation delay over this distance is ap-proximately 0.15 ms, which will never result in time slot overlap thus avoiding eMote induced channel interference. Propagation delay could become an issue as more eMotes are added to each channel and transmit power (thus range) is increased; however, it is currently not a problem.
3.3. Receiving System
Next, for the receiving subsystem, there are a few major components that make up the entire platform. Commercial-off-the-shelf components were leveraged extensively for the receiving platform, including RF front ends (RFFEs), micro-controllers, an Ethernet router, and a computer. This subsystem is best described by tracing the flow of data. First, packets arrive at an RF front end, which is pro-grammed to look for a 4-byte preamble and a 2-byte sync word and to begin capturing the packet once these requirements are met. To improve data recep-tion range, the quality threshold requirement for the preamble is set relatively low. The RF front end includes both a hardware CRC check that will delete packets that have a bit error, as well as hardware FEC decoding.
microcon-DOI: 10.4236/wsn.2018.104005 98 Wireless Sensor Network troller using a Serial Peripheral Interface (SPI) bus. The microcontroller's em-bedded software is responsible for interfacing with the CC1101 radio module to receive data from eMotes, as well as immediately sending these packets to a computer. This approach offloads the processing intensive operations to the much more capable processor of a computer. Packets are forwarded to the computer over Ethernet through a router that manages the communications between the devices. This allows for multiple microcontrollers to connect to a single laptop. In order to handle packet reception and forwarding, the receiver units run a real time operating system (RTOS). Also, this software allows for the reception of packets from eMotes on a set channel or on multiple channels by scanning through an appropriate range of channels. This scheme allows for flexible system configuration, as different applications may use eMotes in vari-ous ways.
4. System Verification
Several system level tests have been conducted in order to verify the functionali-ty of the system during larger scale deployments. During each of these tests, eMotes were dispersed on the ground and receiving units were placed adjacent to the area the eMotes occupied. These tests served several purposes, including checking the reception rate of packets across the system; analyzing and verifying the environmental data; and confirming the functionality of data processing, storage, and visualization tools.
First, a system level test with 44 eMotes and three RF front ends was con-ducted for a period of about 26 minutes. For this test, eMotes were positioned on the ground and scattered both in direct sun and in the shade. During this test, packets were received from all 44 eMotes, and approximately 87% of sent pack-ets were received. Then, for each eMote, the percentage of the number of re-ceived packets to the number of expected packets can be calculated. Using these data, the histogram shown in Figure 3(a) was created, which shows that the majority of the eMotes had 90% to 100% of their data received.
[image:6.595.71.537.584.701.2]Next, a test with 80 eMotes and seven RFEEs was run for approximately 55 minutes. The eMotes were laid out in a grid configuration in a field, a map of which is shown in Figure 4. This map was generated by the real-time location
DOI:10.4236/wsn.2018.104005 99 Wireless Sensor Network
Figure 4. Real-time map of eMote locations during the second test.
visualization tools that were created for GlobalSense. This test was less successful than the previous one. Packets were received from 90% of the eMotes that were deployed; however, only approximately 37% of the packets that were sent were received. As the histogram in Figure 3(b) shows, many eMotes had a very low rate of reception. A major issue with this test, discovered retrospectively, was that the transmitting eMotes where placed on the ground and the receiver unit was only a few inches above the ground. This led to an issue with multipath causing a large number of bad packets.
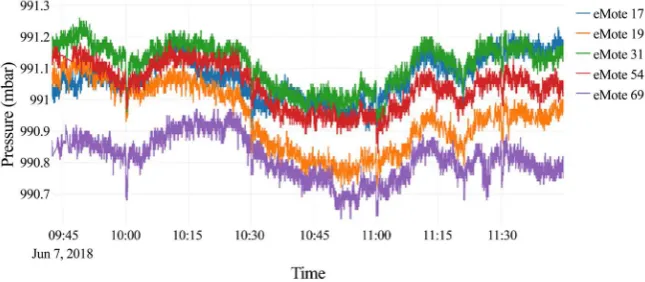
Finally, a test was conducted with 83 eMotes, including three that were at-tached to a balloon and elevated above the others, for a duration of 126 minutes. Example data from this test is shown in Figure 5. Throughout this test, packets were received from 75 out of the 83 eMotes (again, around 90%). Improving over the previous test, approximately 55% of the transmitted packets from those 75 eMotes were received. One factor in the improved reception rate was that the receiver was elevated off the ground. However, this packet reception rate is still lower than desired. The histogram in Figure 3(c) shows that many of the eMotes were received consistently, but that there was a group of eMotes that were not functioning correctly. There are several issues that could have contri-buted to this low packet reception rate that merits further investigation.
5. Conclusions
DOI: 10.4236/wsn.2018.104005 100 Wireless Sensor Network
Figure 5. Sample pressure traces from the third test of five randomly selected eMotes.
the industry standard devices which would allow for longer data collection dur-ing each deployment.
Testing has demonstrated the overall accuracy and reliability of the individual sensors, which is essential for providing meteorological insights. Further, full system tests have shown that the individual aspects of the network function cor-rectly. Individual eMotes organize into their correct channels and time slots and transmit data, and the receiving units receive data and forward this data to a computer, where it is processed and stored.
Future work on the GlobalSense system will seek to resolve the reception re-liability issues, which may require changes to the eMote design or the receiving subsystem. Additionally, testing and calibration will be continued to ensure that the sensors are able to meet the standard requirements for atmospheric data col-lection.
References
[1] Lazo, J., Lawson, M., Larsen, P.H. and Waldman, D.M. (2011) U.S. Economic Sensi-tivity to Weather Variability. Bulletin of the American Meteorological Society, 92, 709-720. https://doi.org/10.1175/2011BAMS2928.1
[2] Teisberg, T.J., Weiher, R.F. and Khotanzad, A. (2005) The Economic Value of Temperature Forecasts in Electricity Generation. Bulletin of the American Meteo-rological Society, 86, 1765-1771. https://doi.org/10.1175/BAMS-86-12-1765
[3] Sun, J., et al. (2014) Use of NWP for Nowcasting Convective Precipitation: Recent Progress and Challenges. Bulletin of the American Meteorological Society, 95, 409-426. https://doi.org/10.1175/BAMS-D-11-00263.1
[4] Durden, S.L. and Perkovic-Martin, D. (2017) The RapidScat Ocean WindsScatte-rometer: A Radar System Engineering Perspective. IEEE Geoscience and Remote Sensing Magazine, 5, 36-43. https://doi.org/10.1109/MGRS.2017.2678999
[5] Veefkind, J.P., et al. (2012) TROPOMI on the ESA Sentinel-5 Precursor: A GMES Mission for Global Observations of the Atmospheric Composition for Climate, Air Quality and Ozone Layer Applications. Remote Sensing of Environment, 120, 70-83. https://doi.org/10.1016/j.rse.2011.09.027
Geos-DOI:10.4236/wsn.2018.104005 101 Wireless Sensor Network cience and Remote Sensing Letters, 14, 72-76.
https://doi.org/10.1109/LGRS.2016.2626320
[7] Galvin, J.F.P. (2003) Back to Basics: Radiosondes: Part 2—Using and Interpreting the Data. Weather, 58, 387-395. https://doi.org/10.1256/wea.126.02B
[8] Vaisala (2010) Vaisala Dropsonde RD94.
[9] Zorer, R., et al. (2013) Daily MODIS Land Surface Temperature Data for the Analy-sis of the Heat Requirements of Grapevine Varieties. IEEE Transactions on Geos-cience and Remote Sensing,51, 2128-2135.
https://doi.org/10.1109/TGRS.2012.2226465
[10] Moninger, W.R., Mamrosh, R.D. and Pauley, P.M. (2003) Automated Meteorologi-cal Reports from Commercial Aircraft. Bulletin of the American Meteorological So-ciety,84, 203-216. https://doi.org/10.1175/BAMS-84-2-203
[11] Bolt, M., Prather, J.C., Harrell, H., Horton, T., Manobianco, J. and Adams, M.L. (2017) Design and Testing of Novel Airborne Atmospheric Sensor Nodes. IEEE Geoscience and Remote Sensing Letters, 15, 73-77.
https://doi.org/10.1109/LGRS.2017.2774203
[12] Pounds, P., Potie, T., Kendoul, F., Singh, S., Jurdak, R. and Roberts, J. (2016) Auto-matic Distribution of Disposable Self-Deploying Sensor Modules. Springer Interna-tional Publishing, Cham, 535-543.
[13] Stevenson, R.A., Evangelista, D. and Looy, C.V. (2015) When Conifers Took Flight: A Biomechanical Evaluation of an Imperfect Evolutionary Takeoff. Paleobiology, 41, 205-225. https://doi.org/10.1017/pab.2014.18
[14] World Meteorological Organization (2017) Observing Systems Capability Analysis and Review Tool. World Meteorological Organization, Geneva.
[15] National Oceanic and Atmospheric Administration (2017) NWS Directives System. Silver Spring, MD.
[16] Lund, J. (2009) Design Note DN502: CRC Implementation.
http://www.ti.com/lit/an/swra111d/swra111d.pdf
[17] Hoel, R. (2007) Design Note DN504: FEC Implementation.