Munich Personal RePEc Archive
Does the Impact of Remittances on
Poverty and Human Development
Depend on the Climate of Receiving
Areas?
Joseph, George and Wodon, Quentin
World Bank
June 2014
Online at
https://mpra.ub.uni-muenchen.de/56517/
1
Does the Impact of Remittances on Poverty and Human Development
Depend on the Climate of Receiving Areas?
George Joseph and Quentin Wodon
June 2014
This paper is forthcoming in:
Wodon, Q., A. Liverani, G. Joseph and N. Bougnoux, 2014 editors, Climate Change and Migration: Evidence from the Middle East and North Africa, Washington, DC: The World Bank.
Abstract
2
1. Introduction
Migration of household members and the potential resulting remittances are part of livelihood strategies used by households to insure against shocks in regions which are prone to natural disasters and adverse weather conditions. There is ample evidence that migration and especially remittances may reduce poverty and improve human development outcomes for receiving households. According to Mansuri (2007), school enrollment rates increase by 54 percent for girls in migrant households in rural Pakistan (the increase is lower for boys at seven percent). Frank and Hummer (2002) find that infants born into Mexico-to-US migrant households have better birth outcomes: while nine percent of infants in international migrant households have low birth weights, 11 percent of those in non migrant households have this condition.Hildebrandt and McKenzie (2005) and McKenzie (2006) suggest that international migration has positive effects on both infant mortality and child weight among Mexican households.
Remittance receiving households typically have better asset ownership and are more entrepreneurial. Taylor and Mora (2006) suggest that international migrant households have the largest marginal budget share for investments in rural Mexico. Makdissi and Wodon (2004) suggest that households with migrants have better housing. Osili (2004) shows that in Nigeria, a ten percent increase in migrants’ income increases the probability of investing in housing by three percentage points in the country of origin. Remittances also help to smooth consumption during adverse shocks – both through ex- ante preparedness and ex post adaptation.
Controlling for the endogeneity of the remittance receiving status of households, remittances help to smooth consumption after floods in Bangladesh and build disaster resilient housing in Ghana and Burkina Faso and ensure sufficient liquidity during food shortage in Ethiopia (Mohapatra et al, 2011). Gubert (2002) finds that households in rural Mali use remittances to insure themselves against adverse shocks, with a 500 kilogram drop in grain output leading to a 48 percent increase in remittances; if that drop in grain output is coupled with a death in the family, remittances rise by 124 percent.
There is also evidence that migration and remittances reduce poverty. Lokshin et al. (2007) show that in Nepal almost 20 percent of the decline in poverty between 1995 and 2004 was linked to migration. Adams and Page (2005) suggest that a ten percent increase in per capita international remittances leads to a 3.5 percent decline in the share of people in poverty. International remittances reduce poverty in Latin America by 0.4 percent for each percentage point increase in the remittances to GDP ratio (Acosta et al., 2006). Conversely, a drop in international remittances may lead to higher poverty, as observed in Burkina Faso after the crisis in Côte d’Ivoire reduces the ability of migrants to remit (Siaens and Wodon, 2011).
The question investigated in this chapter is somewhat different. We are interested in assessing whether the impact of remittances on poverty and human development indicators depends on the areas in which households live. Our hypothesis is that remittances may have a larger impact in areas affected by unfavorable climate because it is in those areas that households tend to be most vulnerable. By combining climate and household survey data from Yemen, we test whether domestic and international remittances reduce poverty and improve education and malnutrition indicators more in areas with high temperatures and low rainfalls.
3
proportions are 33.90 percent for domestic remittances, 14.10 percent for international remittances, and 4.38 percent for both.) Yemen’s topography is diverse, with a mountainous core at the center, coastal plains in the east, west, and south, and upland deserts to the north, towards the Saudi Arabia border. The country suffers from a relatively harsh climate in many areas. Rainfall is limited and the population must deal with high levels of water scarcity as well as persisting economic reliance on water dependent sectors such as rainfed agriculture. The average annual mean temperature is 22 degrees Celsius in our data from BIOCLIM, but there are large differences between various parts of the country as well as over the year, and temperatures have peaked to well above 50 degrees. Climate change is likely to progressively bring in even higher temperatures and lower rainfalls in the future. Climate is not only likely to play an important role in decisions by household members to migrate and remit, but it is also likely to affect poverty and human development outcomes both directly and indirectly through its impact on livelihoods. In turn, as a coping mechanism, the impact of remittances may differ between areas.
The chapter is structured as follows. Section two presents the data and methodology. Section three presents the results from the estimation of the impact of remittances, both domestic and international, on poverty and human development outcomes. A conclusion follows.
2. Data and Methodology
We use the most recently available nationally representative household budget survey implemented in Yemen, whose data were collected in 2005-2006. The survey includes 13,136 households (98,941 individuals) living in 309 of the country’s 333 districts. Apart from the location of households, the survey provides information on a wide range of socio-economic characteristics including among others demographics, education, health and anthropometrics, employment and occupation, consumption and assets, and income including remittances. Data are available on both domestic and international remittances, with 43.6 percent of households receiving some form of remittances (33.9 percent for domestic remittances and 4.38 percent for international sources, and some overlap between both; we treat households receiving remittances from domestic and international sources as international remittance receiving households.)
Beyond the household survey, and based on the location of households proxied through the most populous city in the district in which the household lives, we also use information on the distance between the household/district location and the coast, as well as the distance to the nearest airport; these distances are calculated using an Euclidean distance function in ESRI ArcGIS 9.3 software. We also use measures of travel time to the nearest city with 100,000 populations using a methodology developed from Nelson (2008) with regionally specific information (World Bank, 2011). The percentage of irrigated land is taken from Global Map of Irrigated Areas version 4 (Siebert et al., 2005; Siebert et al., 2006). Weather data on annual mean temperature and rainfall and their variability are collected from BIOCLIM (Busby, 1991). All weather variables are computed on observations for the period 1990 to 2000.
4
regressions used for the matching procedure are available upon request, with some examples provided in appendix – care was applied to make sure that balancing properties were respected. We used k-nearest neighbors matching, with k equal to four, a radius of 0.02, and we excluded the one percent of observations with extreme values for the indicators of interest.
3. Results
In principle, we would expect remittances to have a potentially large impact on poverty and human development indicators. The average transfer received by households who benefit from domestic remittances is YER 46,654 (US$ 252 at the average exchange rate in 2004 of US$ 1 = YER 185), and the average amount for international remittances is as expected significantly higher, at YER 218,786 (US$ 1,183). Given rather low standards of well-being in the country as a whole, these are substantial transfers which should make a difference for households.
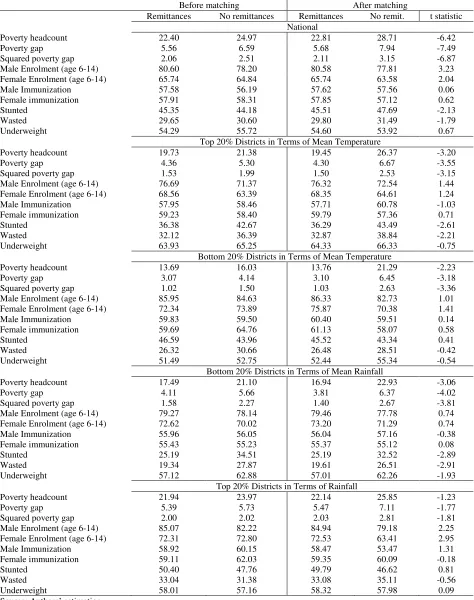
Tables 1 to 3 provide the results from the matching for all, domestic, and international remittances respectively Consider first table 1 which accounts for any type of remittances received, whether domestic or international. Using a cut-off point for t-statistics of 1.96 corresponding to a 95 percent confidence interval, the impact of remittances is statistically significant at the national level for six variables: the three poverty measures (for example, with a reduction of six points for the headcount index from 28.71 percent to 22.81 percent), male and female school enrollment (increase of three points for boys and two points for girls), and stunting (reduction of two points).
Note that statistical significance is easier to obtain at the national level than for subsets of the districts, given the larger number of observations available at the national level. For our purpose, the interesting comparison is between districts with high or low temperatures, as well as between districts with high and low levels of rainfall. Specifically, we will consider the top 20 percent districts with high temperature and the bottom 20 percent districts in terms of rainfall, and compare these groups with respectively the bottom 20 percent districts in terms of temperatures and the top 20 percent districts in terms of rainfall. Our prior is that we expect larger impacts of remittances in districts with high temperatures or low levels of rainfall.
5
Table 1: Matching Results – Any Remittances, Yemen 2005/06
Before matching After matching
Remittances No remittances Remittances No remit. t statistic
National
Poverty headcount 22.40 24.97 22.81 28.71 -6.42
Poverty gap 5.56 6.59 5.68 7.94 -7.49
Squared poverty gap 2.06 2.51 2.11 3.15 -6.87
Male Enrolment (age 6-14) 80.60 78.20 80.58 77.81 3.23
Female Enrolment (age 6-14) 65.74 64.84 65.74 63.58 2.04
Male Immunization 57.58 56.19 57.62 57.56 0.06
Female immunization 57.91 58.31 57.85 57.12 0.62
Stunted 45.35 44.18 45.51 47.69 -2.13
Wasted 29.65 30.60 29.80 31.49 -1.79
Underweight 54.29 55.72 54.60 53.92 0.67
Top 20% Districts in Terms of Mean Temperature
Poverty headcount 19.73 21.38 19.45 26.37 -3.20
Poverty gap 4.36 5.30 4.30 6.67 -3.55
Squared poverty gap 1.53 1.99 1.50 2.53 -3.15
Male Enrolment (age 6-14) 76.69 71.37 76.32 72.54 1.44
Female Enrolment (age 6-14) 68.56 63.39 68.35 64.61 1.24
Male Immunization 57.95 58.46 57.71 60.78 -1.03
Female immunization 59.23 58.40 59.79 57.36 0.71
Stunted 36.38 42.67 36.29 43.49 -2.61
Wasted 32.12 36.39 32.87 38.84 -2.21
Underweight 63.93 65.25 64.33 66.33 -0.75
Bottom 20% Districts in Terms of Mean Temperature
Poverty headcount 13.69 16.03 13.76 21.29 -2.23
Poverty gap 3.07 4.14 3.10 6.45 -3.18
Squared poverty gap 1.02 1.50 1.03 2.63 -3.36
Male Enrolment (age 6-14) 85.95 84.63 86.33 82.73 1.01
Female Enrolment (age 6-14) 72.34 73.89 75.87 70.38 1.41
Male Immunization 59.83 59.50 60.40 59.51 0.14
Female immunization 59.69 64.76 61.13 58.07 0.58
Stunted 46.59 43.96 45.52 43.34 0.41
Wasted 26.32 30.66 26.48 28.51 -0.42
Underweight 51.49 52.75 52.44 55.34 -0.54
Bottom 20% Districts in Terms of Mean Rainfall
Poverty headcount 17.49 21.10 16.94 22.93 -3.06
Poverty gap 4.11 5.66 3.81 6.37 -4.02
Squared poverty gap 1.58 2.27 1.40 2.67 -3.81
Male Enrolment (age 6-14) 79.27 78.14 79.46 77.78 0.74
Female Enrolment (age 6-14) 72.62 70.02 73.20 71.29 0.74
Male Immunization 55.96 56.05 56.04 57.16 -0.38
Female immunization 55.43 55.23 55.37 55.12 0.08
Stunted 25.19 34.51 25.19 32.52 -2.89
Wasted 19.34 27.87 19.61 26.51 -2.91
Underweight 57.12 62.88 57.01 62.26 -1.93
Top 20% Districts in Terms of Rainfall
Poverty headcount 21.94 23.97 22.14 25.85 -1.23
Poverty gap 5.39 5.73 5.47 7.11 -1.77
Squared poverty gap 2.00 2.02 2.03 2.81 -1.81
Male Enrolment (age 6-14) 85.07 82.22 84.94 79.18 2.25
Female Enrolment (age 6-14) 72.31 72.80 72.53 63.41 2.95
Male Immunization 58.92 60.15 58.47 53.47 1.31
Female immunization 59.11 62.03 59.35 60.09 -0.18
Stunted 50.40 47.76 49.79 46.62 0.81
Wasted 33.04 31.38 33.08 35.11 -0.56
Underweight 58.01 57.16 58.32 57.98 0.09
6
Table 2: Matching Results – Domestic Remittances, Yemen 2005/06
Before matching After matching
Remittances No remittances Remittances No remit. t statistic
National
Poverty headcount 22.83 24.97 23.35 28.17 -4.61
Poverty gap 5.71 6.59 5.87 7.55 -4.86
Squared poverty gap 2.12 2.51 2.18 2.91 -4.22
Male Enrolment (age 6-14) 79.69 78.20 79.63 78.29 1.34
Female Enrolment (age 6-14) 64.63 64.84 64.58 64.16 0.34
Male Immunization 57.48 56.19 57.59 58.81 -0.94
Female immunization 58.75 58.31 58.61 60.21 -1.14
Stunted 48.83 44.18 49.18 49.35 -0.14
Wasted 31.55 30.60 31.82 32.51 -0.62
Underweight 54.82 55.72 55.23 55.53 -0.25
Top 20% Districts in Terms of Mean Temperature
Poverty headcount 21.89 21.38 21.53 27.86 -2.48
Poverty gap 5.14 5.30 5.10 7.23 -2.66
Squared poverty gap 1.87 1.99 1.85 2.78 -2.39
Male Enrolment (age 6-14) 75.81 71.37 75.52 72.46 0.99
Female Enrolment (age 6-14) 68.97 63.39 69.19 63.26 1.66
Male Immunization 55.05 58.46 54.08 62.98 -2.48
Female immunization 58.58 58.40 58.41 55.16 0.77
Stunted 39.55 42.67 39.44 50.29 -3.10
Wasted 36.18 36.39 37.12 42.72 -1.62
Underweight 70.34 65.25 71.69 69.72 0.61
Bottom 20% Districts in Terms of Mean Temperature
Poverty headcount 12.81 16.03 12.55 20.32 -2.15
Poverty gap 2.79 4.14 2.77 6.74 -3.66
Squared poverty gap 0.88 1.50 0.88 2.87 -3.98
Male Enrolment (age 6-14) 84.58 84.63 85.79 86.50 -0.12
Female Enrolment (age 6-14) 69.73 73.89 71.49 70.39 0.24
Male Immunization 59.01 59.50 59.06 53.05 0.89
Female immunization 59.37 64.76 59.53 62.42 -0.46
Stunted 47.84 43.96 48.61 41.76 1.11
Wasted 26.20 30.66 27.38 25.78 0.28
Underweight 51.48 52.75 52.23 54.53 -0.36
Bottom 20% districts in terms of Mean Rainfall
Poverty headcount 19.50 21.10 19.08 25.02 -2.29
Poverty gap 5.03 5.66 4.60 6.49 -2.21
Squared poverty gap 2.05 2.27 1.75 2.57 -1.82
Male Enrolment (age 6-14) 78.20 78.14 78.99 73.22 1.97
Female Enrolment (age 6-14) 74.65 70.02 74.93 73.24 0.53
Male Immunization 54.14 56.05 54.41 60.28 -1.43
Female immunization 53.62 55.23 53.63 56.34 -0.64
Stunted 28.33 34.51 27.58 33.48 -1.75
Wasted 23.33 27.87 24.23 30.03 -1.81
Underweight 62.14 62.88 64.43 61.53 0.83
Top 20% Districts in Terms of Rainfall
Poverty headcount 22.94 23.97 23.10 27.13 -1.13
Poverty gap 5.56 5.73 5.63 7.57 -1.75
Squared poverty gap 2.03 2.02 2.06 3.00 -1.80
Male Enrolment (age 6-14) 84.04 82.22 83.75 77.87 1.77
Female Enrolment (age 6-14) 71.36 72.80 71.79 64.27 2.09
Male Immunization 57.91 60.15 58.19 56.65 0.35
Female immunization 59.51 62.03 59.55 62.67 -0.61
Stunted 52.03 47.76 51.24 44.21 1.55
Wasted 33.41 31.38 33.67 35.92 -0.53
Underweight 58.39 57.16 59.04 57.06 0.44
7
Table 3: Matching Results – International Remittances, Yemen 2005/06
Before matching After matching
Remittances No remittances Remittances No remit. t statistic
National
Poverty headcount 20.49 24.97 20.76 29.88 -7.20
Poverty gap 5.13 6.59 5.22 8.31 -7.35
Squared poverty gap 1.94 2.51 1.98 3.33 -6.26
Male Enrolment (age 6-14) 81.53 78.20 81.54 77.66 3.30
Female Enrolment (age 6-14) 67.61 64.84 67.54 63.67 2.68
Male Immunization 57.25 56.19 57.48 56.19 0.81
Female immunization 56.20 58.31 56.27 56.24 0.02
Stunted 36.91 44.18 37.05 44.20 -4.89
Wasted 24.95 30.60 25.05 28.94 -2.94
Underweight 52.89 55.72 53.28 54.54 -0.85
Top 20% Districts in Terms of Mean Temperature
Poverty headcount 13.16 21.38 12.62 24.57 -4.62
Poverty gap 2.69 5.30 2.59 6.06 -4.48
Squared poverty gap 0.94 1.99 0.93 2.38 -3.72
Male Enrolment (age 6-14) 77.78 71.37 77.96 69.21 2.50
Female Enrolment (age 6-14) 67.12 63.39 66.99 66.77 0.05
Male Immunization 64.13 58.46 63.47 64.16 -0.17
Female immunization 62.09 58.40 61.62 60.68 0.22
Stunted 28.82 42.67 27.96 41.97 -4.10
Wasted 27.08 36.39 25.81 34.52 -2.62
Underweight 55.21 65.25 54.48 64.07 -2.65
Bottom 20% Districts in Terms of Mean Temperature
Poverty headcount 16.67 16.03 13.02 14.51 -0.52
Poverty gap 4.03 4.14 2.72 3.77 -1.28
Squared poverty gap 1.46 1.50 0.92 1.33 -1.07
Male Enrolment (age 6-14) 90.27 84.63 93.17 84.82 2.97
Female Enrolment (age 6-14) 79.42 73.89 85.15 69.43 4.28
Male Immunization 60.91 59.50 65.22 66.51 -0.27
Female immunization 56.47 64.76 61.31 61.90 -0.11
Stunted 42.67 43.96 40.31 36.78 0.79
Wasted 21.98 30.66 23.47 26.89 -0.87
Underweight 45.69 52.75 51.02 47.86 0.7
Bottom 20% districts in terms of Mean Rainfall
Poverty headcount 17.26 21.10 16.67 23.57 -2.79
Poverty gap 4.23 5.66 3.85 6.42 -3.13
Squared poverty gap 1.70 2.27 1.45 2.69 -2.89
Male Enrolment (age 6-14) 78.96 78.14 79.46 75.58 1.33
Female Enrolment (age 6-14) 69.01 70.02 69.05 69.65 -0.18
Male Immunization 58.06 56.05 57.94 58.99 -0.28
Female immunization 56.92 55.23 57.42 53.80 0.94
Stunted 22.78 34.51 22.71 27.69 -1.56
Wasted 18.35 27.87 18.75 21.51 -0.93
Underweight 55.24 62.88 55.42 62.64 -2.08
Top 20% Districts in Terms of Rainfall
Poverty headcount 15.64 23.97 15.49 29.44 -4.53
Poverty gap 4.14 5.73 4.10 6.41 -2.45
Squared poverty gap 1.57 2.02 1.58 2.20 -1.41
Male Enrolment (age 6-14) 87.25 82.22 87.53 79.46 3.16
Female Enrolment (age 6-14) 72.12 72.80 74.13 60.49 3.62
Male Immunization 60.63 60.15 62.41 56.40 1.52
Female immunization 57.01 62.03 58.74 60.24 -0.35
Stunted 42.32 47.759 41.87 49.20 -1.97
Wasted 30.73 31.379 30.85 31.21 -0.1
Underweight 56.68 57.16 57.30 54.55 0.74
8
Similar results tend to be observed in tables 2 and 3 when considering domestic and international remittances separately, although there are differences between the impacts of both types of remittances. One would expect that for households benefitting from remittances, the impacts on the various indicators would be larger in the case of international remittances simply because the average level of international remittances among beneficiaries is much higher than the average level of domestic remittances among beneficiaries. This is indeed observed through the fact that at the national level for example, impacts are statistically significant for only three indicators with domestic remittances (the three poverty measures), while impacts are statistically significant for seven indicators in the case of international remittances (the three poverty measures, as well as school enrollment for both boys and girls, and stunting and wasting).
But what about the comparison between districts in terms of climate? Consider first domestic remittances. When looking at temperatures, apart from the results for the poverty measures which tend to be similar in both sets of districts, we see that for domestic remittances, there is a statistically significant impact of remittances on stunting in districts with high temperatures, while this is not the case for districts with low temperatures. (There is also a curious reduction in male immunization with remittances in high temperatures districts – but this is the only case of unexpected result, and the only time that the effect is statistically significant for immunization, so one can probably discount that observation). When looking at rainfall, we see that the effects on poverty are statistically significant for two of the poverty measures in low rainfall areas, while this is not the case in high rainfall areas. As for education, we see a (marginally) statistically significant gain in school enrollment for boys in areas with low rainfall, while there is a gain for girls in areas with high rainfall. Still, overall, the evidence points to a larger impact of domestic remittances in districts with either high temperatures or low rainfall.
This is also observed for international remittances, especially when comparing districts with low and high temperatures. In districts with low temperatures, the impact of international remittances is statistically significant for school enrollment only, while in districts with high temperatures, the impacts are statistically significant for the poverty measures, school enrollment for boys, and the three measures of malnutrition. The differences in impact are lower when comparing districts with high and low levels of rainfall – there the impacts are similar in terms of statistical significance and often as well magnitude for the poverty measures, but school enrollment gains tend to be statistically significant in areas with high rainfall (both types of districts in terms of rainfall levels exhibit some gains in nutrition measures from international remittances, with one of the three impacts being statistically significant, albeit not the same one in the two types of districts).
4. Conclusion
9
10
References
Acosta, P., P. Fajnzylber, and H. Lopez, 2007, The Impact of Remittances on Poverty and Human Capital: Evidence from Latin American Household Surveys, in C. Ozden and M. Schiff, Eds., International Migration Policy and Economic Development: Studies across the Globe, Washington, DC: The World Bank.
Adams, R., and J. Page, 2005, Do International Migration and Remittances Reduce Poverty in Developing Countries, World Development 33(10): 1645-1669.
Busby, J. R., 1991, BIOCLIM—A bioclimate analysis and prediction system, Plant Prot. Q. 6:8– 9.
Frank, R., and R. Hummer, 2002, The Other Side of the Paradox: The Risk of Low Birth Weight among Infants of Migrant and Nonmigrant Households within Mexico, International Migration Review 36(3): 746-765.
Gubert, F., 2007, Insurance Against Poverty, Journal of African Economies, 16(1): 172-175. Hildebrandt, N., and D. McKenzie, 2005, The Effects of Migration on Child Health in Mexico,
World Bank Policy Research Working Paper 3573, Washington, DC: The World Bank. Lokshin, M., M. Bontch-Osmolovski, and E. Glinskaya, 2007, Work-related Migration and
Poverty Reduction in Nepal, World Bank Policy Research Working Paper 4231, Washington, DC: The World Bank.
Makdissi, P., and Q. Wodon, 2004, Migration, Poverty and Housing: Welfare Comparisons Using Sequential Stochastic Dominance, Estudios de Economía 1:5-20.
Mansuri, G., 2007, Temporary Migration and Rural Development, in C. Ozden and M. Schiff, Eds., International Migration Policy and Economic Development: Studies across the Globe, Washington, DC: The World Bank.
McKenzie, D., 2006, Beyond Remittances: The Effects of Migration on Mexican Households, in C. Ozden and M. Schiff, editors, International Migration, Remittances and the Brain Drain, Washington, DC: The World Bank.
Mohapatra S., G. Joseph and D. Ratha, 2011 (forthcoming), Remittances and Natural Disasters: Ex-post Response and Contribution to Ex-ante Preparedness, Environment, Development and Sustainability.
Nelson, A., 2008, Travel time to major cities: A global map of Accessibility, Global Environment Monitoring Unit – Joint Research Centre of the European commission, Ispra, Italy. Available at: http://gem.jrc.ec.europa.eu
Osili, U. O., 2004, Migrants and Housing Investments: Theory and Evidence from Nigeria,
Economic Development and Cultural Change 52(4): 821-849.
Siaens. C., and Q. Wodon, 2011, International Migration, Conflict and Remittances: The Impact of the Crisis in Côte d’Ivoire on Burkina Faso, mimeo, World Bank, Washington, DC. Siebert, S., P. Döll, J. Hoogeveen, J.-M. Faurès, K. Frenken, and S. Feick, 2005, Development
and validation of the global map of irrigation areas, Hydrology and Earth System Sciences 9: 535-547.
11
Taylor, J. E., and J. Mora, 2006, Does migration reshape expenditures in rural households? Evidence from Mexico, World Bank Policy Research Working Paper 3842, Washington, DC: The World Bank.
World Bank, 2010, Yemen: Assessing the Impacts of Climate Change and Variability on the Water and Agricultural Sectors and the Policy Implications, Washington, DC: The World Bank.
World Bank, 2011, Poor Places, Thriving People: How the Middle East and North Africa Can Rise Above Spatial Disparities, MENA Development Report, Washington, DC: The World Bank.
World Health Organization, 1995, Physical Status: The Use and Interpretation of