http://www.scirp.org/journal/ojfd ISSN Online: 2165-3860
ISSN Print: 2165-3852
Effect on the Flow Behaviors by Adding
Internals in a Riser Reactor
Liuhai Feng
1,2, Yifeng Bu
1, Juan Wang
2, Yu Mao
2*, Zhuowu Men
1*1National Institute of Clean-and-Low Carbon Energy, Beijing, China
2College of Chemical Engineering, China University of Petroleum, Beijing, China
Abstract
Riser reactor is a key unit in the Fluid Catalytic Cracking (FCC), and it has important influences on increasing the yield coefficient of gas and oil. In this paper, the behaviors of gas-solid two-phase flow in the traditional y-type riser reactor are investigated by numerical simulation. The calculated particle con-centration distribution is in good agreement with the experimental data, which verified the advanced models and calculating methods. The non- uniform distribution, such as core-annulus flow, may result in the unreasona-ble matching relationship of catalyst-to-oil ratio. An optimized riser with cu-neal internals is proposed and the comparison of two different structures of riser reactor is presented. The comparison results show that the cuneal inter-nals in the riser both can block effectively the slip down of the particles near wall region and weaken core-annulus flow structure due to the redistribution of particles. The results also prove that the particle concentration distribution becomes uniform along the axial and radial direction in the optimized riser by adding cuneal internals, which would be benefits for the catalytic cracking reactions.
Keywords
Riser Reactor, Gas-Solid Two-Phase Flow, Core-Annulus Flow Structure, Numerical Simulation
1. Introduction
Fluid Catalytic Cracking (FCC) plays a crucial role in oil refining industry, espe-cially at aspect of cracking heavy-oil to more valuable light products [1] [2]. Ris-er reactor is a key unit, which has many simple geometry, good heat and mass transfer and easy to operate. It can be divided into four sections from bottom to top according to their functions: the pre-lift zone, the feedstock injection zone,
How to cite this paper: Feng, L.H., Bu, Y.F., Wang, J., Mao, Y. and Men, Z.W. (2017) Effect on the Flow Behaviors by Adding Internals in a Riser Reactor. Open Journal of Fluid Dynamics, 7, 72-82. https://doi.org/10.4236/ojfd.2017.71005
Received: January 8, 2017 Accepted: February 24, 2017 Published: February 27, 2017
Copyright © 2017 by authors and Scientific Research Publishing Inc. This work is licensed under the Creative Commons Attribution International License (CC BY 4.0).
the full-reaction zone and the quenching zone. Despite the fact that the riser is widely used, it is difficult to be clearly studied the complex processes of gas-solid flow and mixing, even liquid oil vaporization. The gas-solid flow and mixing in the riser directly affect the product yield. Much attention had been paid to study gas-solid two-phase flow by measuring the particle velocity and concentration. The solids distributions showed that a radially dense high near the wall and low in the center (i.e. a core-annulus structure [3]) existed in the riser, and an axially dense near the bottom and dilute near the top [4] also existed in the riser. Some researchers found that the factors of the solids flux, the superficial gas velocity and the feedstock injection structure influenced the flow uniformity [5] [6]. The formation mechanisms are however hard to validate and quantify through direct measurement owing to the current limitation in experimental techniques. In re-cent years, with rapid development of computing technologies, Computational Fluid Dynamics (CFD) has been widely recognized as a useful tool to analyze the complex gas-solid flow behaviors in a fluidized bed [7] [8] [9] [10]. Though the gas-solid flow at the pre-lift zone and the feedstock injection zone has attracted plenty of researches [11] [12] [13], less attention is paid to the impact of the un-even distribution in the full-reaction zone.
Thus, in this paper, we try to put emphasis on the gas-solid flow and mixing in the full-reaction zone. By using CFD simulation, we will find the reasons of non-uniform flow and mixing, and then present a novel internal structure to improve the flow uniformity.
2. Geometric Model and Grid System
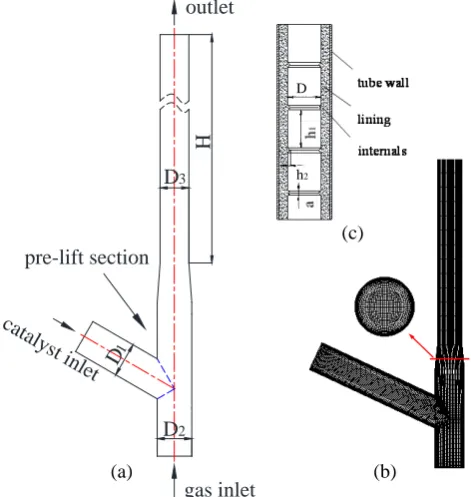
The schematic diagram of riser reactor and cuneal internals and grid system are shown in Figure 1. The catalyst particles (instead of particles in this paper), with volume fraction of 0.3 and density of 1500 kg·m−3, are introduced into the pre-rising phase from regeneration tube at the speed of 0.16 m/s. Then they are pushed up by bottom gas with a superficial gas velocity of 5.5 m/s and finally are vented from the top of riser. Considering simplified the geometric structure of riser [11] [14] [15] [16] might affect the prediction accuracy severely, the entire computational domain is discretized by hexahedron cells. The origin of the coordinate system is set at the intersection of the bottom of riser and the center axis, and the positive direction of z axis is upward. The structured grid system is shown as in Figure 1(b). In additional, different intervals between two cuneal internals [17] are added to the traditional riser to investigate the difference of hydrodynamic characteristics. The schematic of cuneal internals is shown as in Figure 1(c). The main parameters of the structures are given in Table 1.
3. Mathematical Models
3.1. Governing Equations
L. H. Feng .
[image:3.595.207.539.378.541.2]Figure 1. Schematic diagram of riser, cuneal internals and grid system.
Table 1. Geometry size of riser and cuneal internals.
Parameters Value, m
Riser height, H 15.6
Diameter of outlet, D3 0.1
Diameter of gas inlet, D2 0.12
Diameter of catalyst inlet, D1 0.12
Internals interval, H 0.5, 1
Internals width, h 0.016
Internals height, a 0.04
Continuity equations
0.
i
i
v x
∂ =
∂ (1)
Momentum equations
(
)
j
i i i
j i i j
j i j j i j
v
v v p v
v g v v
t x x x x x x
ρ∂ +ρ ∂ = −∂ + ∂ µ∂ +∂ +ρ − ∂ ρ ′ ′
∂ ∂ ∂ ∂ ∂ ∂ ∂ (2)
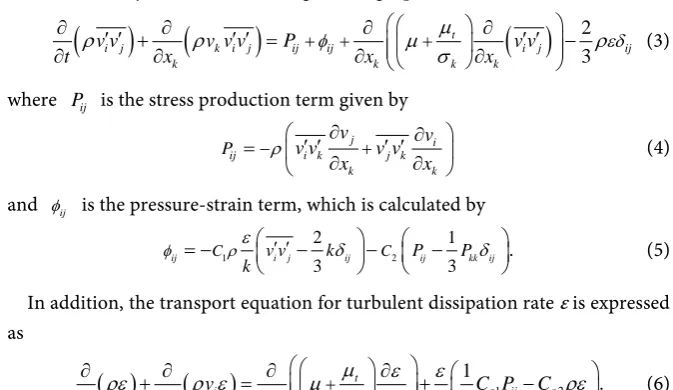
where p, ρ and μ are pressure, density and dynamic viscosity, respectively. vi and vi′ are the mean and the corresponding fluctuating velocity. The additional transport equations requiring for calculation of the Reynolds stresses are em-ployed to close the above equations [18]. Comparing the closing models of the standard k-ε model, the Reynolds stress model (RSM) calculate the Reynolds stresses from their own transport equations, which may described some aniso-tropy of turbulence [19]. In this paper, the turbulence model of RSM is used to
(a) (b)
outlet
D
1gas inlet
pre-lift section
cat
alys
t in
let
H
D
3D
2D
h2
calculate the Reynolds stresses. The governing equations of RSM are as follows:
(
)
(
)
( )
23 t
i j k i j ij ij i j ij
k k k k
v v v v v P v v
t x φ x x εδ
µ
ρ ρ µ ρ
σ
+ + +
∂ ′ ′ + ∂ ′ ′ = ∂ ∂ ′ ′ −
∂ ∂ ∂ ∂ (3)
where Pij is the stress production term given by
j i
ij i k j k
k k
P v v v v v v
x x
ρ
− ′ ′∂ + ′ ′ ∂
=
∂ ∂
(4)
and φij is the pressure-strain term, which is calculated by
1 2
2 1
3 3 .
ij C v vi j k ij C Pij Pkk ij
k
φ = − ρε ′ ′− δ − − δ
(5)
In addition, the transport equation for turbulent dissipation rate ε is expressed as
( )
(
)
1 21
. 2
t
i ii
i j j
v C P C
t x x ε x k ε ε
µ ε ε
ρε ρ ε µ ρε
σ + ∂ + ∂ = ∂ ∂ + −
∂ ∂ ∂ ∂ (6)
The values of the constants which appear in the RSM are usually assigned as follows: C1= 1.8, C2 = 0.6, C
µ
= 0.09, Cε1 = 1.44, Cε2 = 1.92, σε = 1.3.3.2. Multi-Phase Flow Model
The multi-phase flow model in current includes Euler-Euler model and Euler- Lagrangian model, among which Euler-Euler two-fluid model regards gas as continuous phase and solid particle as quasi-continuous phase, and they are co-existing and interpenetration. In recent years, based on kinetic theory of dense gas, the model takes energy dissipation and transfer caused by imperfect elastic collision between particles into account, so it has great advantages in pre-dicting the particle concentration distribution.
3.3. Simulation Conditions
The gas inlet and catalyst inlet are defined as a velocity inlet boundary condition, where the velocity magnitude is specified according to the experiment. The flow at the outlet is assumed to be fully developed, so an ambient pressure is given at the outlet. The walls are set as no-slip boundary conditions, and the standard wall function is applied to determine the flow near walls. The computation is carried out by using the commercial CFD code, Gambit 2.4 and Fluent 6.3. The governing equations are solved by the finite volume method. The QUICK scheme is applied for the convection terms in all transport equations. The SIMPLE algorithm is implemented to deal with the coupling between velocity and pressure. The calculation is considered to be finished when the scaled resi-dual of the continuity converges to below 10−4.
4. Results and Discussion
[image:4.595.203.540.85.280.2]4.1. Validation of Experimental and Numerical Method
L. H. Feng .
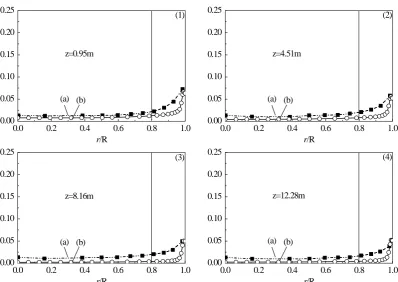
Figure 2. Particle concentration distribution along radial direction at different heights. (a) Experimental
da-ta; (b) Numerical simulation.
is divided into two parts along radial direction: a uniform concentration region at the center that r/R value is between 0 and 0.8, and a non-uniform region near wall that the aggregation is obvious. The graph shows that the distribution trends of particle concentration obtained by numerical simulation agree well with the experimental data. Therefore, the model shows the remarkable advan-tage on simulation of flow characteristic in riser.
4.2. Particle Concentration Distribution in the Traditional Riser
Figure 3 shows the particle concentration distribution at five different sections in the traditional riser. The figure shows that the particles aggregate near the wall region and grow large with the action of the coalescence between particle groups. The low gas velocity might be hard to load the large particles, resulting in the sink of particles. Finally, the particle concentration is much denser at the bottom of the traditional riser, and becomes more uniform with the increased riser height, as shown in Figure 3(a). Due to the high gas velocity, there is not obvious coalescence of particles existed in the center region. However, the par-ticles near the wall will aggregate the fine parpar-ticles. All these lead to non-uniform distribution of particle concentration, with lower particles in the center region and higher particles near the wall, as shown in Figure 3(b).4.3. Structure Optimization
4.3.1. Particle Concentration Distribution of Different Constructs
The non-uniform distribution of particle concentration exists in the traditional
0.0 0.2 0.4 0.6 0.8 1.0
0.00 0.05 0.10 0.15 0.20 0.25 z=0.95m (1) (a) r/R (b)
0.0 0.2 0.4 0.6 0.8 1.0
0.00 0.05 0.10 0.15 0.20 0.25 z=4.51m (2) (a) r/R (b)
0.0 0.2 0.4 0.6 0.8 1.0
0.00 0.05 0.10 0.15 0.20 0.25 z=8.16m (3) (a) r/R (b)
0.0 0.2 0.4 0.6 0.8 1.0
(a) (b)
Figure 3. Particle concentration distribution at different
heights in the traditional riser. (a) Axial particle concen-tration distribution; (b) Radial particle concenconcen-tration distribution.
riser obviously, which might result in coking and unreasonable matching rela-tionship of catalyst-to-oil ratio. All of above have the adverse impact on the product yield. Therefore, a new internals, as shown in Figure 1(c), is added in the traditional riser to investigate the effect of the particle concentration distri-bution. A comparison of particle concentration distributions at different sections in the traditional and optimized riser are shown in Figure 4. The concentration distribution presents a core-annulus flow structure in radial direction, with low-er in rislow-er centlow-er and highlow-er near the rislow-er wall, as shown in Figure 4(a). The sliding particles are pushed to center region along the surface of cuneal internals in optimized riser. The distribution of particle concentration tends to be homo-geneous with the redistribution of the particle near wall, as shown in Figure 4(b) and Figure 4(c).
12.2 12.4
0.030 0.029 0.028 0.027 0.026 0.025 0.024 0.023 0.022 0.021 0.020 0.019 0.018 0.017 0.016 0.015 0.014 0.013 0.012 0.011 0.010 0.009 0.008 0.007 0.006 0.005 0.004 0.003 0.002 0.001 0.000
0 0.2 0.8 1 4.4 4.6 8 8.2
L. H. Feng .
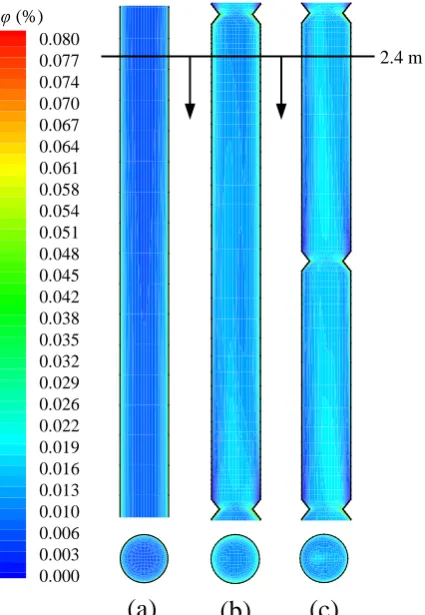
[image:7.595.268.480.559.704.2]Figure 5 shows the particle concentration distribution at z = 2.4 m in different riser structures. As can be seen from the figure, although particles concentration distribution both in the traditional and optimized riser are dilute in center and dense in wall, the particle concentration near wall in the optimized riser is only half of what in the traditional riser. It can be seen that the particles aggregated near the wall are pushed to the center region with the action of cuneal internals, and then they move upwards with the action of upstream gas. In general, the
Figure 4. Particle concentration distribution in different
riser structures. (a) Traditional riser; (b) Optimized riser with 6 internals; (c) Optimized riser with 12 internals.
Figure 5. Particle concentration distribution at z = 2.4 m
in different structures of riser.
0.080 0.077 0.074 0.070 0.067 0.064 0.061 0.058 0.054 0.051 0.048 0.045 0.042 0.038 0.035 0.032 0.029 0.026 0.022 0.019 0.016 0.013 0.010 0.006 0.003 0.000
(a)
(b)
(c)
2.4 m
distribution of particles tends to be more uniform in the optimized riser, and the more cuneal internals the more uniform of particle concentration distribution.
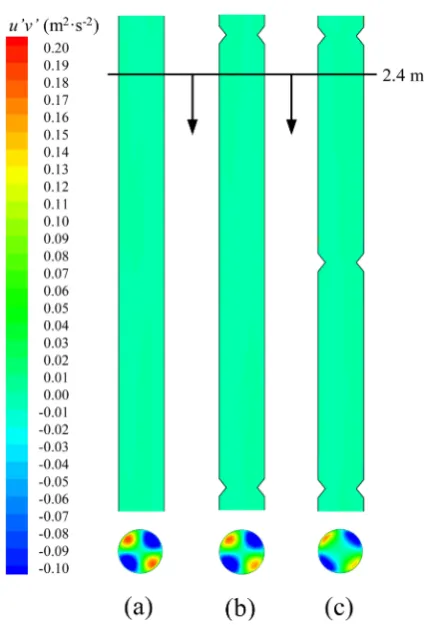
4.3.2. Distribution of Reynolds Stress
Figure 6 shows the comparison of Reynolds stress in the traditional and opti-mized riser. A large gradient of the Reynolds stress emerges along the radial di-rection in the traditional riser, while the value of the Reynolds stress is lesser and more uniform by adding the wedge internals relatively. The Reynolds stress is an additional tension formed by turbulent fluctuation. Therefore, the larger the Reynolds stress, the more intensity the turbulent fluctuation of flow. In general, the action of the turbulent fluctuation is benefits for both the breakage of par-ticles and the uniform of particle distribution, which strongly agrees with the previous analysis.
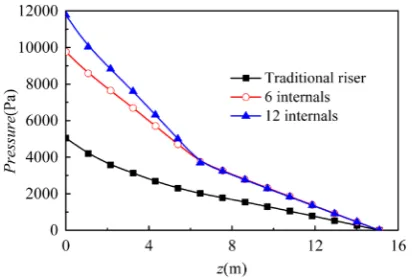
4.3.3. Pressure Drop of Different Constructs
Figure 7 shows the pressure distribution along the axial direction in different structures of riser. The energy consumption will be increase by adding the cu-neal internals in the riser, resulting that the pressure drop in optimized riser is relative increase. In addition, the pressure gradient in the cuneal internal region at the bottom is significantly higher than that without cuneal internals at the top. In general, the pressure drop in the optimize riser is about 2 times as large as in the traditional riser.
Figure 6. Distribution of Reynolds stress in different riser
[image:8.595.266.479.393.708.2]L. H. Feng .
Figure 7. Pressure distribution in different structures
of riser.
5. Conclusions
The gas-particle flow behaviors both in the traditional and optimized riser reac-tors are studied by numerical simulation. The flow dynamics, including pressure drop and particle concentration distribution, is revealed. The main conclusion can be summarized as follows:
1) A three-dimensional full-scale structural grid system is built in this study. The flow behaviors obtained by RSM turbulence model and Euler-Euler two- fluid model are in good agreement with the experimental phenomena and expe-rimental data, all of which can validate the reliability of the model.
2) The core-annulus flow obviously exists in the traditional riser, which might have the adverse impact on the product yield. The particles aggregated near the wall are pushed to the main stream of the center region in the optimized riser by adding the cuneal internals, and then the particles move upward along with the high speed gas flow. Comparing the traditional riser, the optimized riser can ef-fectively weaken the non-uniform particle concentration destruction.
3) In the optimized riser, the kinetic energy increases among the redistribu-tion of particles near the wall region. Comparing the tradiredistribu-tional riser, there is a higher pressure drop in the optimized riser.
References
[1] Glicksman, L.R., Hyre, M.R. and Farrell, P.A. (1994) Dynamic Similarity in Fluidi-zation. International Journal of Multiphase Flow, 20, 331-386.
https://doi.org/10.1016/0301-9322(94)90077-9
[2] Chen, Y.M. (2006) Recent Advances in FCC Technology. Powder Technology, 163, 2-8. https://doi.org/10.1016/j.powtec.2006.01.001
[3] Huang, W.X., Qi, X.B., Pan, Y.L., et al. (2002) Local Solid-Particle Concentration and Flow Development in a Long CFB Riser. Journal of Chemical Engineering of Chinese Universities, 16, 626-631.
[4] Fan, Y., Ye, S., Lu, C.X., et al. (2002) Gas-Solid Two Phase Flow in Feed Injection Zone of FCC Riser Reactors (I) Experimental Research. Journal of Chemical Indus-try and Engineering (China), 53, 1003-1008.
1450-1458. https://doi.org/10.1002/aic.690371003
[6] Kong, C.L., Huang, W.X., Pan, Y.L., et al. (2002) Experimental Investigation on Particle Velocities for Gas-Solid Two Phase Flow in a CFB Riser. Journal of Sichuan University, 34, 41-45.
[7] Zheng, Y., Wan, X., Qian, Z., et al. (2001) Numerical Simulation of the Gas-Particle Turbulent Flow in Riser Reactor Based on k-ε-k p-ε p-Θ Two-Fluid Model. Chemi-cal Engineering Science, 56, 6813-6822.
https://doi.org/10.1016/S0009-2509(01)00319-0
[8] Gao, J., Xu, C., Lin, S., et al. (2001) Simulations of Gas-Liquid-Solid 3-Phase Flow and Reaction in FCC Riser Reactors. AIChE Journal, 47, 677-692.
https://doi.org/10.1002/aic.690470315
[9] Benyahia, S., Syamlal, M. and O’Brien, T.J. (2007) Study of the Ability of Multiphase Continuum Models to Predict Core-Annulus Flow. AIChE Journal, 53, 2549-2568.
https://doi.org/10.1002/aic.11276
[10] Li, J., Fan, Y.P., Lu, C.X., et al. (2013) Numerical Simulation of Influence of Feed Injection on Hydrodynamic Behavior and Catalytic Cracking Reactions in a FCC Riser under Reactive Conditions. Industrial & Engineering Chemistry Research, 52, 11084-11098. https://doi.org/10.1021/ie400250c
[11] Bi, H.T. (2002) Some Issues on Core-Annulus and Cluster Models of Circulating Fluidized Bed Reactors. Canadian Journal of Chemical Engineering, 80, 809-817.
https://doi.org/10.1002/cjce.5450800504
[12] Fan, Y., Ye, S., Chao, Z., et al. (2002) Gas-Solid Two-Phase Flow in FCC Riser.
AIChE Journal, 48, 1869-1887. https://doi.org/10.1002/aic.690480905
[13] Chen, S., Fan, Y., Yan, Z., et al. (2016) CFD Simulation of Gas-Solid Two-Phase Flow and Mixing in a FCC Riser with Feedstock Injection. Powder Technology, 287, 29-42. https://doi.org/10.1016/j.powtec.2015.09.005
[14] Hoomans, B.P.B., Kuipers, J.A.M., Briels, W.J., et al. (1996) Discrete Particle Simu-lation of Bubble and Slug Formation in a Two-Dimensional Gas-Fluidised Bed: A Hard-Sphere Approach. Chemical Engineering Science, 51, 99-118.
https://doi.org/10.1016/0009-2509(95)00271-5
[15] Benyahia, S., Arastoopour, H., Knowlton, T.M., et al. (2000) Simulation of Particles and Gas Flow Behavior in the Riser Section of a Circulating Fluidized Bed Using the Kinetic Theory Approach for the Particulate Phase. Powder Technology, 112, 24-33.
https://doi.org/10.1016/S0032-5910(99)00302-2
[16] Liu, Y., Lu, H., Liu, W., et al. (2003) Model and Simulation of Gas-Solids Flow with Wide Size Distributions in Circulating Fluidized Beds. Journal of Chemical Industry & Engineering, 54, 1065-1071.
[17] Mao, Y., et al. (2006) A New Internals to Weaken the Core-Annulus Flow in the Riser Reactor. CN200810055684.X.
[18] Ferziger, J.H. and Perić, M. (1996) Computational Methods for Fluid Dynamics, Springer, Berlin. https://doi.org/10.1007/978-3-642-97651-3
[19] Nallasamy, M. (1987) Turbulence Models and Their Applications to the Prediction of Internal Flows: A Review. Computers & Fluids, 15, 151-194.
L. H. Feng .
Nomenclatures
g gravitational acceleration (m·s−2) k turbulent kinetic energy (m2·s−2) p pressure (Pa)
R radius of the cylinder (m) r radial coordinate (m)
i
v meanvelocity in the ith direction (m·s-1)
i
v′ fluctuating velocity in the ith direction (m·s−1)
i
x spatial component in ith direction (m) z axialcoordinate(m)
ij
δ Kronecker’s delta
ε dissipation rate of turbulent kinetic energy (m2·s−3) μ dynamic viscosity (kg·m−1·s−1)
θ azimuthalcoordinate(m) ρ density (kg·m−3)
Subscripts
g gas phasei, j, k spatial coordinates s solid phase
Submit or recommend next manuscript to SCIRP and we will provide best service for you:
Accepting pre-submission inquiries through Email, Facebook, LinkedIn, Twitter, etc. A wide selection of journals (inclusive of 9 subjects, more than 200 journals)
Providing 24-hour high-quality service User-friendly online submission system Fair and swift peer-review system
Efficient typesetting and proofreading procedure
Display of the result of downloads and visits, as well as the number of cited articles Maximum dissemination of your research work