Munich Personal RePEc Archive
Trust and Prosperity: A Conditional
Relationship
Asongu, Simplice A. and Kodila-Tedika, Oasis
7 May 2013
Online at
https://mpra.ub.uni-muenchen.de/46865/
1
Trust and Prosperity: A Conditional Relationship
Simplice A. Asongu
African Governance and Development Institute, P.O. Box 18 SOA/ 1365 Yaoundé, Cameroon.
E-mail: [email protected]
Oasis Kodila-Tedika
Department of Economics, University of Kinshasa, B.P. 832 KIN XI, Kinshasa, Democratic Republic of Congo.
Email: [email protected]
Abstract
The paper extends Breggren et al. (2008, EE) on ‘trust and growth: a shaky relationship”
by incorporating recent developments in the trust-growth literature and using a robust
methodological underpinning that accounts for the presence of outliers. The empirical evidence is
based on 63 countries. Two main findings are established. Firstly, the substantially documented
positive trust-growth nexus is broadly confirmed. Secondly, when initial levels of growth come
into play in determining the relationship, only 0.25 and 0.90 quantiles confirm the positive nexus.
The results suggest that the trust-growth nexus cannot be generalized for all countries as some
previous studies have concluded. Accordingly, blanket trust-growth policies may not succeed
unless they are contingent on existing levels of development and tailored differently across rich
and poor countries.
JEL Classification: A13; O40; Z13
2
1. Introduction
Over the past decades, a substantial body of work has covered the nexus between trust
and economic growth (Knack & Keefer, 1997; La Porta et al., 1997; Glaeser et al., 2000; Zak &
Knack, 2001; Beugelsdijk et al., 2004; Breggren et al., 2008; Cahuc, 2013). Accordingly, most
studies that have investigated the nexus have established a positive trust-growth nexus. The
debate has recently shifted from the sign of the nexus to the robustness of the nexus (Beugelsdijk
et al., 2004; Breggren et al., 2008). While Beugelsdijk et al. (2004) have concluded that the
relationship between trust and economic growth in terms of statistical significance is reasonably
robust in terms of size of the estimated effect, Breggren et al. (2008) have examined the
conclusions of previous literature by taking the robustness further and investigating the stability
of previous findings and exposing them to systematic empirical scrutiny. Whereas Breggren et al.
(2008) have concluded on a robust and shaky nexus, the conclusions of recent literature provide a
motivating background for the assessment of a robust and conditional relationship.
The emergence of a recent strand of interesting threshold literature on the trust-growth
nexus has focused on how initial trust levels matter in the trust-growth relationship (Uslaner,
2008; Tabellini, 2008; Roth, 2009; Algan & Cahuc, 2010). Uslaner (2008) has concluded that
generalized trust is stable value that is transmitted from parents to children by assessing how
ethnic background matters in the relationship. Tabellini (2008) in explaining the range of
situations in which individuals cooperate has studied a theoretical model where individuals
respond to incentives but are also influenced by norms of good conduct inherited from earlier
generations. Accordingly, there is an underlying assumption that parents rationally choose what
values to transmit to their offspring and this choice is influenced by the quality of external
enforcement and the pattern of likely future transactions. In the same vein, Algan & Cahuc
3 growth by focusing on the inherited component of trust and time variation. They show that
inherited trust of descendants is influenced by country of origin and the timing of arrival of their
forebears: a strategy that allows them to identify the sizeable causal impact of inherited trust on
worldwide growth during the twentieth century. Deviating from ‘inherited initial levels of trust,
Roth (2009) has also concluded that from a policy point of view, an increase in trust is crucial for
countries with low levels of trust, but can likely be neglected by countries with sufficient levels
of trust and may even hamper economic performance in countries with high levels of trust.
This paper contributes to existing literature along two main axes: complementing existing
literature and extending Berggren et al. (2008). Firstly, it complements recent literature in a
twofold manner by: focusing on ‘growth thresholds’ instead of ‘trust thresholds’ and;
investigating the Roth (2009) hypothesis: “The common knowledge which has governed the
nature of discussions in social science and economics of the last ten years, that trust is generally
positively related to economic performance, must be seriously questioned” (p. 1). Accordingly,
the use of the quantile regression estimation technique enables us to assess how growth
thresholds matter in the Roth hypothesis. Secondly, we extend Berggren et al. (2008) by using a
methodology that is robust in the presence of outliers. The extension of Berggren et al. (2008) has
a twofold motivation. (1) By using quantile regression, we are able to assess the robustness of the
findings from another methodology underpinning. Hence, we also complement a strand of the
literature on the relevance of a robust trust-growth nexus. (2) While the trust-growth relationship
may be shaky, establishing how it is conditioned on initial growth levels could have substantial
policy implications. Hence, if the trust-growth nexus is heterogeneous across growth distributions
then, blanket policies may not be effective unless they are contingent on initial growth levels and
4 As far as we have reviewed, the only study closest to the present paper in the literature in
terms of methodological underpinning is Peiró-Palomino & Tortosa-Ausina (2012). The present
paper steers clear of theirs from three standpoints. Firstly, while they employ the quantile
regression technique, their scope and positioning is on short-run and long-run development
outcomes. Secondly, their study does not control for the plethora of cultural and social
unobserved heterogeneity recently documented in the trust-growth literature (Uslaner, 2008;
Tabellini, 2008; Algan & Cahuc 2010). Thirdly, the dataset used is significantly different from
the Berggren et al. (2008) dataset which we intend to use.
Consistent with Peiró-Palomino & Tortosa-Ausina (2012) on the motivation for
employing quantile regression, another aspect on which no consensus has yet been reached
relates to determining if social capital effects are stronger in poorer or richer countries. Previous
findings on the concern are based on average effects, mainly from Ordinary Least Squares (OLS)
which suffers from several limitations. On the one hand in big samples outlying observations are
common. Hence, estimated coefficients heavily affected by outliers may be biased. On the other
hand, when the outliers are controlled for, the trust-growth nexus could depend on initial levels of
growth. This argument which has become a challenging issue in social capital studies highlighted
by Knack & Keefer (1997) has been integrated in recent studies (Roth, 2009)1.
The rest of the paper is organized as follows. Measurement and methodology issues are
discussed in Section 2. Empirical analysis is covered in Section 3. We conclude with Section 4.
1
Knack & Keefer (1997) included a regression term ‘trust × initial income’ and concluded that the trust-growth
5
2. Data and Methodology
2.1 Data
We examine a sample of 63 countries using the same dataset as in Berggren et al. (2008)
because; the problem statement is an extension of Berggren et al. (2008). Hence, using the same
dataset is logical, since this paper steers clear of the Berggren study in terms of methodological
underpinnings. The large dataset for the period 1990-2000 also source from Inglehart et al.
(2000), Inglehart et al. (2004) and Latinobarómetro (2004). Consistent with our methodological
motivation, we focus on the large sample of Berggren et al. (2008) and not on the small sample
because issues of outliers (our estimation technique intends to handle) are common with heavier
samples. We divide the variables into four groups as in the seminal paper motivating this study.
These include: the dependent variable, the variable of interest and, the fixed and switching
control variables. While the fixed variables are control variables that are included in all
regressions, the switch variables are included and varied across specifications. The latter set of
variables is principally used to control for the unobserved heterogeneity.
The dependent variable is the annual growth of real GDP chain per capita (Growth). The
independent variable of interest is Trust. Fixed variables include: Schooling (the average number
of years in school, 1990), Investment-good price (the price level of investment), Openness
(Exports plus imports divided by real GDP per capita, in current prices 1990) and Real GDP per
capita, in thousands of USD, 1990. Switch variables are twelve that are used in pairs of three in
four different specifications. These include: UK Colony, Language fractionalization, Religious
fractionalization, Orthodox, Muslims, Buddhists, Hindus, Jewish, sub-Saharan Africa,
Urbanization, European Language and Area. These variables are the same used by Berggren et al.
6 Details about variable definitions (with descriptive statistics) and correlation analysis
(showing the relationships between key variables used in the paper) with presentation of
countries are found in the appendices. The ‘summary statistics’ of the variables used in the
regressions shows that there is quite some variation in the data utilized so that one should be
confident that reasonable estimated nexuses would emerge (Appendix 1). The purpose of the
correlation matrix (Panel A of Appendix 2) is to address issues resulting from overparametization
and multicolinearity. Based on a preliminary assessment of the correlation coefficients, there do
not appear to be any serious concerns in terms of the relationships to be estimated. Countries
making-up the dataset are presented in Panel B of Appendix 2.
2.2 Methodology
2.2.1 Issue of outliers and robustness
It has been substantially documented that OLS estimates are sensitive to outliers
(Berggren et al., 2008; Billger & Goel, 2009; Okada & Samreth, 2012; Asongu, 2013a, b). This
means observations that deviate from the linear pattern formed by the majority of the data.
Outliers frequently occur in datasets because of measurement errors as some observations may be
drawn from a different population with a different type of nexus between them and the variable
of interest or due to exceptional events (e.g earthquakes). Accordingly, OLS on such a dataset
contaminated by outliers may results in severely biased estimates. In the extreme case for
instance, one single outlier can result in an infinite bias of OLS estimates. In order to deal with
the problem, robust regression methods are required. As far as we have reviewed, quantile
regressions are the most widely used regression methods that are robust to outliers.
Another issue in the trust-growth nexus literature that has been substantially debated is
robustness (Berggren et al., 2008). In fact, the results may be fragile as the size of the estimated
7 using four different sets of switching control variables that control for the unobserved
heterogeneity and hence, assess the sensitivity of the trust-growth nexus to changes in
socio-economic and cultural environments documented in recent literature (Uslaner, 2008; Tabellini,
2008; Algan & Cahuc 2010; Cahuc, 2013: Kodila-Tedika & Agbor, 2013).
2.2.2 Estimation technique
Consistent with recent literature (Billger & Goel, 2009; Okada & Samreth, 2012; Asongu,
2013a, b), to determine whether existing levels of per capita economic prosperity affect how trust
comes into play, we use quantile regression. This approach enables us to assess if the nexus
between trust and growth differs throughout the distributions of growth (Koenker & Hallock,
2001). Hence, based on this estimation technique we are able to carefully examine the incidence
of trust throughout the conditional distribution with particular emphasis on countries with the
highest and lowest growth levels. Quantile regression (hence QR) yields parameters estimated at
multiple points in the conditional distribution of the dependent variable (Koenker & Bassett,
1978). Accordingly, the th quantile estimator of the endogenous variable is obtained by
solving for the following optimization problem.
i i i i i i k x y i i i x y i i i R x y x y : : ) 1 ( min (1)Where is in the ‘0 and 1’ interval. Contrary to OLS that is based on minimizing the sum of
squared residuals, with QR we minimize the weighted sum of absolute deviations. For example
the 10th or 75th quantiles (with =0.10 or 0.75 respectively) by approximately weighing the
residuals. The conditional quantile of yigiven xiis:
i i
y x x
Q( / ) (2)
where unique slope parameters are derived for each th quantile of interest. This formulation is
8 mean of the conditional distribution of the endogenous variable. For the model in Eq. (2) the
dependent variable yi is the GDP per capita growth rate while xi contains a constant term, trust
and control variables. Consistent with Berggren et al. (2008) we also provide a baseline
estimation of mean effects. The employment of four sets of switch variables in different
specifications for further robustness is consistent with recent quantile regression literature
(Billger & Goel, 2009; Okada & Samreth, 2012; Asongu, 2013a).
3. Empirical analysis
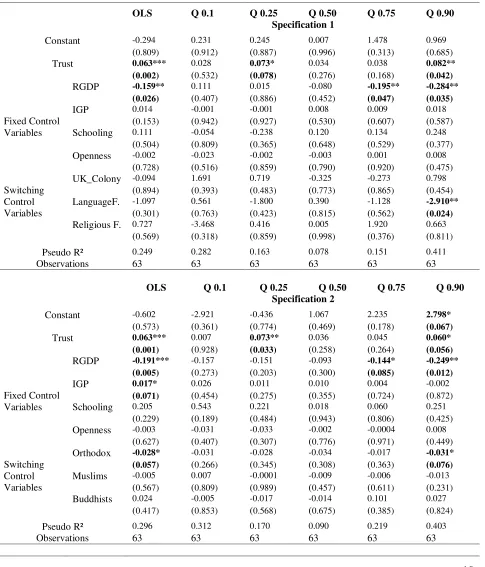
The results presented in Tables 2 include OLS and QR estimates. OLS estimates provide
a baseline of mean effects and we compare these to estimates of separate quantiles in the
conditional distributions of the growth dependent variable. In the interpretation of estimated
coefficients, it is worth noting that smaller values (in conditional distributions) of the dependent
variables denote less growth.
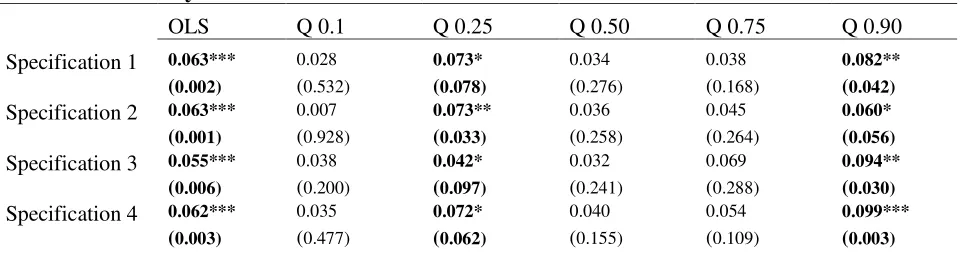
Table 1 below summarizes the trust-growth effects of Table 2. The motivation for this
summary is to synthesize the potential incidence of trust on growth when initial growth levels
matter. Based on the summary of the results, two main conclusions could be drawn. Firstly, the
substantially documented positive trust-growth nexus is broadly confirmed. Secondly, when
initial levels of growth come into play in determining the relationship, only 0.25 and 0.90
quantiles confirm the positive nexus. These findings are consistent across specifications.
Most of the significant control variables have the right signs. Firstly, the negative value of
the initial growth coefficient confirms the presence of convergence in per capita income growth.
This implies poorer countries (within full dataset and in some specific quantiles) are catching-up
with their richer counterparts in terms of per capita income growth. Secondly, there is broadly a
positive relationship between ‘investment-good price and growth’. This nexus is not significantly
9 of the Hindu dummy on growth in low income countries is broadly driven by the recent economic
success of India in the sample.
While the emergence of a recent strand of interesting threshold literature on the
trust-growth nexus has focused on how initial levels of trust matter in the relationship (Uslaner, 2008;
Tabellini, 2008; Roth, 2009; Algan & Cahuc, 2010), we have shown that initial levels of growth
could also matter in this relationship. In fact the present study has complemented Breggren et al.
(2008) by establishing that, while the trust-growth nexus is shaky, it is also conditional on initial
growth levels. From the available weight of empirical evidence, the Roth (2009) hypothesis that
cautions the generalization of the positive role of trust in economic performance is confirmed2.
Hence, the trust benefits of economic growth could be contingent on initial levels of growth such
that blanket trust-growth policies may not succeed unless they are tailored differently across
[image:10.612.68.549.414.543.2]low-income and high-low-income countries.
Table 1: Summary of results
OLS Q 0.1 Q 0.25 Q 0.50 Q 0.75 Q 0.90
Specification 1 0.063*** 0.028 0.073* 0.034 0.038 0.082**
(0.002) (0.532) (0.078) (0.276) (0.168) (0.042) Specification 2 0.063*** 0.007 0.073** 0.036 0.045 0.060*
(0.001) (0.928) (0.033) (0.258) (0.264) (0.056) Specification 3 0.055*** 0.038 0.042* 0.032 0.069 0.094**
(0.006) (0.200) (0.097) (0.241) (0.288) (0.030) Specification 4 0.062*** 0.035 0.072* 0.040 0.054 0.099***
(0.003) (0.477) (0.062) (0.155) (0.109) (0.003)
*, **, ***, denote significance levels of 10%, 5% and 1% respectively. Lower quantiles (e.g., Q 0.1) signify nations where GDP per capita growth is least. OLS: Ordinary Least Squares.
2“The common knowledge which has governed the nature of discussions in social science and economics of the last
ten years, that trust is generally positively related to economic performance, must be seriously questioned” (Roth,
10
Table 2: Conditional estimations
OLS Q 0.1 Q 0.25 Q 0.50 Q 0.75 Q 0.90
Specification 1
Constant -0.294 0.231 0.245 0.007 1.478 0.969
(0.809) (0.912) (0.887) (0.996) (0.313) (0.685)
Trust 0.063*** 0.028 0.073* 0.034 0.038 0.082**
(0.002) (0.532) (0.078) (0.276) (0.168) (0.042)
Fixed Control Variables
RGDP -0.159** 0.111 0.015 -0.080 -0.195** -0.284**
(0.026) (0.407) (0.886) (0.452) (0.047) (0.035)
IGP 0.014 -0.001 -0.001 0.008 0.009 0.018
(0.153) (0.942) (0.927) (0.530) (0.607) (0.587)
Schooling 0.111 -0.054 -0.238 0.120 0.134 0.248
(0.504) (0.809) (0.365) (0.648) (0.529) (0.377)
Openness -0.002 -0.023 -0.002 -0.003 0.001 0.008
(0.728) (0.516) (0.859) (0.790) (0.920) (0.475)
Switching Control Variables
UK_Colony -0.094 1.691 0.719 -0.325 -0.273 0.798
(0.894) (0.393) (0.483) (0.773) (0.865) (0.454)
LanguageF. -1.097 0.561 -1.800 0.390 -1.128 -2.910**
(0.301) (0.763) (0.423) (0.815) (0.562) (0.024)
Religious F. 0.727 -3.468 0.416 0.005 1.920 0.663
(0.569) (0.318) (0.859) (0.998) (0.376) (0.811)
Pseudo R² 0.249 0.282 0.163 0.078 0.151 0.411
Observations 63 63 63 63 63 63
OLS Q 0.1 Q 0.25 Q 0.50 Q 0.75 Q 0.90
Specification 2
Constant -0.602 -2.921 -0.436 1.067 2.235 2.798*
(0.573) (0.361) (0.774) (0.469) (0.178) (0.067)
Trust 0.063*** 0.007 0.073** 0.036 0.045 0.060*
(0.001) (0.928) (0.033) (0.258) (0.264) (0.056)
Fixed Control Variables
RGDP -0.191*** -0.157 -0.151 -0.093 -0.144* -0.249**
(0.005) (0.273) (0.203) (0.300) (0.085) (0.012)
IGP 0.017* 0.026 0.011 0.010 0.004 -0.002
(0.071) (0.454) (0.275) (0.355) (0.724) (0.872)
Schooling 0.205 0.543 0.221 0.018 0.060 0.251
(0.229) (0.189) (0.484) (0.943) (0.806) (0.425)
Openness -0.003 -0.031 -0.033 -0.002 -0.0004 0.008
(0.627) (0.407) (0.307) (0.776) (0.971) (0.449)
Switching Control Variables
Orthodox -0.028* -0.031 -0.028 -0.034 -0.017 -0.031*
(0.057) (0.266) (0.345) (0.308) (0.363) (0.076)
Muslims -0.005 0.007 -0.0001 -0.009 -0.006 -0.013
(0.567) (0.809) (0.989) (0.457) (0.611) (0.231)
Buddhists 0.024 -0.005 -0.017 -0.014 0.101 0.027
(0.417) (0.853) (0.568) (0.675) (0.385) (0.824)
Pseudo R² 0.296 0.312 0.170 0.090 0.219 0.403
11
OLS Q 0.1 Q 0.25 Q 0.50 Q 0.75 Q 0.90
Specification 3
Constant -0.588 0.006 -0.959 -0.177 -0.211 0.717
(0.599) (0.996) (0.425) (0.909) (0.933) (0.865)
Trust 0.055*** 0.038 0.042* 0.032 0.069 0.094**
(0.006) (0.200) (0.097) (0.241) (0.288) (0.030)
Fixed Control Variables
RGDP -0.170** 0.002 0.004 -0.147 -0.292* -0.300
(0.014) (0.977) (0.952) (0.246) (0.090) (0.272)
IGP 0.019* 0.009 0.012 0.025 0.030 0.014
(0.055) (0.400) (0.216) (0.276) (0.370) (0.850)
Schooling 0.143 -0.132 -0.148 0.040 0.208 0.125
(0.380) (0.522) (0.419) (0.866) (0.486) (0.625)
Openness -0.002 -0.024 0.005 0.001 0.003 0.025
(0.772) (0.428) (0.530) (0.867) (0.743) (0.175)
Switching Control Variables
Hindus 0.019 0.038* 0.041*** 0.022 -0.001 -0.013
(0.407) (0.066) (0.008) (0.321) (0.970) (0.437)
Jews 0.300 0.513 0.381 0.669 0.668 0.771
(0.520) (0.146) (0.239) (0.452) (0.476) (0.517)
SSA -1.292 -0.864 -1.339 -1.308 -1.553 -0.890
(0.200) (0.333) (0.212) (0.335) (0.615) (0.898)
Pseudo R² 0.267 0.335 0.210 0.114 0.173 0.390
Observations 63 63 63 63 63 63
OLS Q 0.1 Q 0.25 Q 0.50 Q 0.75 Q 0.90
Specification 4
Constant -1.397 -2.057 -2.011 -0.362 1.152 -0.552
(0.252) (0.436) (0.422) (0.827) (0.560) (0.797)
Trust 0.062*** 0.035 0.072* 0.040 0.054 0.099***
(0.003) (0.477) (0.062) (0.155) (0.109) (0.003)
Fixed Control Variables
RGDP -0.182*** -0.058 -0.081 -0.098 -0.185* -0.304***
(0.007) (0.530) (0.462) (0.322) (0.075) (0.002)
IGP 0.017* 0.019 0.012 0.017 0.011 0.019
(0.064) (0.199) (0.302) (0.180) (0.559) (0.342)
Schooling 0.159 -0.002 -0.164 0.063 0.021 0.053
(0.334) (0.992) (0.506) (0.782) (0.930) (0.818)
Openness 0.001 -0.021 -0.024 0.005 0.006 0.012
(0.889) (0.535) (0.568) (0.603) (0.563) (0.183)
Switching Control Variables
Urban -0.0003 0.010 0.037 -0.013 0.0008 0.019
(0.986) (0.741) (0.325) (0.613) (0.969) (0.354)
EuroL 0.929 0.479 0.219 0.729 0.703 1.108
(0.1387) (0.590) (0.826) (0.413) (0.367) (0.147)
Area -0.000 -0.000 -0.000 -0.000 -0.000 -0.000
(0.151) (0.177) (0.624) (0.401) (0.394) (0.466)
Pseudo R² 0.302 0.328 0.189 0.117 0.179
Observations 63 63 63 63 63 63
12
4. Conclusion
The paper has extended Breggren et al. (2008) on ‘trust and growth: a shaky relationship”
by incorporating recent developments in the trust-growth literature and using a robust
methodological underpinning that accounts for the presence of outliers. The empirical evidence is
based on 63 countries. Two main findings have been established. Firstly, the substantially
documented positive trust-growth nexus is broadly confirmed. Secondly, when initial levels of
growth come into play in determining the relationship, only 0.25 and 0.90 quantiles confirm the
positive nexus. The results suggest that the trust-growth nexus cannot be generalized for all
countries as some previous studies have concluded. Accordingly, blanket trust-growth policies
may not succeed unless they are contingent in existing levels of development and tailored
13 Appendices
Appendix 1: Variable specifications and descriptive statistics (1990-2000)
Variables Definitions Obs Mean S.D Min Max Sources
Growth Annual growth rate in percent of real GDP (chain) per 63 1.751 1.934 -2.58 7.688 Heston et al. (2002) capita, 1990-2000: 100*[(Real GDP per capita2000 /
Real GDP per capita1990)1/10− 1]
Trust
Taiwan: 1990−1998
63 30.46 15.71 5.000 66.10
Inglehart et al. (2000); Zak and Knack (2001); Inglehart et al. (2004); Latinobarómetro (2004)
First value of trust 1990−2000, i.e., the share that
agrees with the statement “most people can be trusted”
Schooling Average years of schooling, 1990 63 6.698 2.624 2.190 12.00 Barro and Lee (2001)
Real GDP per Real GDP (chain) per capita, thousands of USD in 63 10.244 7.606 0.686 26.45 Heston et al. (2002) capita 1996 constant prices, 1990
Investment-good The PPP of investment divided by the exchange rate 63 78.960 33.50 12.46 177.6 Heston et al. (2002)
price times 100, 1990
Openness Exports plus imports divided by real GDP per capita, 63 57.362 28.98 14.99 154.65 Heston et al. (2002) in current prices, 1990
UK colony
Dummy with value 1 if former UK colony and 0
otherwise 63 0.190 0.395 0.000 1.000 Persson and Tabellini (2003); http://www.britishempire.co.uk;
Encyclopaedia Britannica; Nationalencyklopedin [Swedish National Encyclopedia]
Language One minus the Herfindal index of linguistic group 62 0.269 0.257 0.002 0.922 Alesina et al. (2003) fractionalization shares, 2001
Religious One minus the Herfindal index of religious group 63 0.390 0.232 0.004 0.860 Alesina et al. (2003) fractionalization shares, 2001
Orthodox Share of population that is Orthodox Christian, 2000 63 3.881 15.96 0.000 93.76
World Christian Database,
http://www.worldchristiandatabase.org/wcd/; population from Heston et al. (2002), for Taiwan from http://www.census.gov/ipc/www/idbsum.html
Muslim Share of population that is Muslim, 2000 63 11.52 28.03 0.000 98.11 Ditto
Buddhist Share of population that is Buddhist, 2000 63 1.888 7.711 0.000 55.72 Ditto
Hindu Share of population that is Hindu, 2000 63 1.703 10.14 0.000 79.76 Ditto
Jewish Share of population that is Jewish, 2000 62 0.259 0.546 0.000 3.065 Ditto
Sub-Sahara
Dummy with value 1 if African country is located to
the south of the Sahara and 0 otherwise 63 0.063 0.245 0.000 1.000
Urban Share of population in urban areas, 1990 62 60.65 19.10 11.2 96.40 United Nations (2003)
European Fraction of a country's population that speaks English, 63 0.401 0.433 0.00 1.00 Hall and Jones (1999); http://www.ethnologue.com Language French, German, Portuguese or Spanish
Area Million square kilometres 63 1.18 2.40 0.00 10.0 Central Intelligence Agency (2004)
14
Appendix 2: Correlation Matrix and Presentation of Countries
Panel A: Correlation Matrix
Educ. RGDP IGP Open UKcol Lanfrac Relifrac Ortho Muslim Budd. Hindu Jewish SSA Urban EuroL Area Trust Growth
1.000 0.789 0.276 0.216 -0.155 -0.205 0.307 0.146 -0.457 0.163 -0.188 0.271 -0.291 0.640 0.049 0.099 0.537 0.045 Educ. 1.000 0.604 0.169 -0.147 -0.167 0.279 -0.035 -0.326 0.186 -0.168 0.252 -0245 0.603 0.135 0.116 0.624 0.008 RGDP
1.000 0.067 0.110 -0.125 0.035 -0.041 0.012 0.132 -0.127 -0.002 0.022 0.233 0.013 -0.058 0.479 0.184 IGP 1.000 -0.026 -0.064 -0.144 -0.047 -0.021 -0.121 -0.210 -0.211 -0.161 0.198 -0.097 -0.397 0.088 -0.059 Open
1.000 0.380 0.316 -0.061 0.272 -0.089 0.268 -0.040 0.536 -0.274 -0.113 0.183 0.032 0.064 UKcol 1.000 0.323 -0.110 0.102 -0.108 0.283 -0.086 0.471 -0.394 -0.310 0.070 -0.091 -0.126 Lanfrac
1.000 -0.139 -0.336 0.208 -0.035 0.154 0.414 0.055 0.076 0.339 0.182 0.014 Relifrac 1.000 -0.031 -0.058 -0.038 -0.052 -0.062 -0.026 -0.188 -0.067 0.041 -0.158 Ortho
1.000 -0.086 0.072 -0.152 -0.041 -0.317 -0.339 -0.030 -0.110 -0.010 Muslim 1.000 -0.025 -0.084 -0.063 0.016 -0.184 0.014 0.180 0.161 Budd.
1.000 -0.066 -0.020 -0.292 -0.142 0.109 0.031 0.157 Hindu 1.000 -0.062 0.387 0.390 0.396 0.121 0.035 Jewish
1.000 -0.405 -0.218 -0.071 -0.213 -0.147 SSA 1.000 0.426 0.068 0.189 -0.027 Urban
1.000 0.221 -0.177 0.049 EuroL. 1.000 0.206 0.244 Area
1.000 0.346 Trust 1.000 Growth
Panel B: Presentation of Countries (63)
Algeria, Argentina, Australia, Austria, Bangladesh, Belgium, Bolivia, Brazil, Canada, Chile, China, Colombia, Costa Rica, Czech Republic, Denmark, Dominican Republic, Ecuador, Egypt, El Salvador, Finland, France, Germany, Ghana, Guatemala, Honduras, Greece, Iceland, India, Indonesia, Ireland, Italy, Japan, Jordan, Korea, Latvia, Mexico, Netherlands, New Zealand, Nicaragua, Norway, Pakistan, Panama, Paraguay, Peru, Philippines, Poland, Portugal, Romania, Slovakia, Slovenia, South Africa, Spain, Sweden, Switzerland, Taiwan, Turkey, Uganda, United
Kingdom, Uruguay, USA, Venezuela, Zimbabwe.
Educ: Schooling. RGDP: Real GDP per capita in 1996 constant prices (1990). IGP: Investment Good Price. Open: Openness. UKcol: UK Colony. Lanfrac: Language fractionalization. Relifrac: Religious fractionalization. Ortho: Orthodox. Budd: Buddhist. SSA: Sub-Saharan Africa. EuroL: European Language.
15
References
Alesina A., Devleeschauwer A., Easterly W., Kurlat S., & Wacziarg R., (2003)
“Fractionalization”, Journal of Economic Growth, 8, pp. 155–194.
Algan, Y., & Cahuc, P., ( 2010). "Inherited Trust and Growth." American Economic Review, 100(5), pp. 2060-2092.
Asongu, S. A., (2013a). “Fighting corruption in Africa: do existing corruption-control levels matter”. International Journal of Development Issues, 12(1), pp. 36-52.
Asongu, S. A., (2013b). “On the effectiveness of foreign aid in institutional quality”, European Economic Letters, 2(1), pp. 12-19.
Berggren, N., Elinder, M., & Jordahl, H., (2008). “Trust and Growth: A Shaky Relationship”, Empirical Economics, 35(2), pp. 251-274.
Beugelsdijk, S., de Groot, H. L. F., & van Schaik, A. B. T. M., (2004). “Trust and economic growth: a robustness analysis”. Oxford Economic Papers, 56, pp. 118–134.
Billger, S. M., & Goel, R. K., (2009). “Do existing corruption levels matter in controlling corruption? Cross-country quantile regression estimates”, Journal of Development Economics, 90, pp. 299-305.
Cahuc, P., (2013). Trust, Institutions and Economic Development, Handbook of Economic Growth, eds Philippe Aghion and Steven Durlauf: Forthcoming.
Central Intelligence Agency (2004). The world factbook 2004. Central Intelligence Agency, Washington, District of Columbia.
Glaeser, E. L., Laibson, D. I, Scheinkman, J. A., & Soutter, C. L., (2000). “Measuring trust”. Quarterly Journal of Economics, 115, pp. 811–846.
Hall, R. E., & Jones, C. I., (1999). “Why some countries produce so much more output per
worker than others”, Quarterly Journal of Economics, 114, pp. 83-116.
Heston A., Summers R., & Aten B., (2002). Penn world table version 6.1. Center for International Comparisons at the University of Pennsylvania (CICUP)
Inglehart R., et al. (2000) “World values surveys and European values surveys, 1981−1984, 1990−1993, and 1995−1997”. ICPSR study 2790, Inter-University Consortium for Political and Social Research, Institute for Social Research, Ann Arbor, Michigan.
16
Knack, S., & Keefer, P., (1997). “Does social capital an economic payoff? A cross country
investigation”, The Quarterly Journal of Economics, 112, pp. 1251–1288.
Kodila-Tedika, O., & Agbor, J. A., (2013). “Does trust matter for entrepreneurship: evidence
from a cross section of countries”, MPRA Paper No. 46306.
Koenker, R., & Bassett, Jr. G., (1978). “Regression quantiles”, Econometrica, 46, pp. 33-50.
Koenker, R., & Hallock, F. K., (2001). “Quantile regression”. Journal of Economic Perspectives. 15, pp. 143-156.
La Porta, R., Lopez-de-Silanes, F., Schleifer, A., & Vishny, R. W., (1997). “Trust in large organizations”. American Economic Review, 87, pp. 333−338
Latinobarómetro (2004). http://www.latinobarometro.org
Okada, K., & Samreth, S., (2012). “The effect of foreign aid on corruption: A quantile regression approach”,Economic Letters, 11, pp. 240-243.
Peiró-Palomino, J., & Tortosa-Ausina, E., (2012). “Can trust on development be generalized? A
response by quintile”, Department of Economics, Universitat Jaume I, Castellon, Spain.
Persson T., & Tabellini G., (2003). The economic effects of constitutions. The MIT Press, Cambridge, Massachusetts.
Roth, F., (2009). “Does too much trust hamper economic growth?”Kyklos, 62(1), pp. 103–128
Tabellini, G., (2008). “The scope of cooperation: Values and incentives”. The Quarterly Journal of Economics, 123(3), pp. 905–950.
United Nations (2003). World urbanization prospects: the 2003 revision. United Nation, New York.
Uslaner, E. M., (2008). “Where you stand depends upon where your grandparents sat”, Public Opinion Quarterly, 72(4), pp. 725–740.