Chinese statistics: classification systems
and data sources
Holz, Carsten A
7 January 2013
Online at
https://mpra.ub.uni-muenchen.de/43869/
Chinese Statistics: Classification Systems and Data Sources
China has become a popular geographic area of research. Researchers make extensive use of Chinese official statistics, but these statistics are often not well understood. This article first clarifies three major issues that affect a wide range of Chinese statistics—from output and employment data to industry profitability—and then elaborates on data sources. The three data issues are changes over time to the sectoral classification system, changes to the ownership classification system, and changes to the coverage of the industry sector. Many of these changes have gone unnoticed or remain poorly understood, leaving the researcher puzzled about varying labels, apparently inconsistent data, and discontinued time series. The second part of the paper offers a gateway to a wealth of Chinese statistics whose existence is not widely known. It also points out the limitations of some of these sources and provides an overview of the secondary literature that discusses the meaning and quality of particular Chinese statistics.
Journal of Economic Literature classification codes. all China:
C82 Data Collection and Data Estimation Methodology; Computer Programs — Methodology for Collecting, Estimating, and Organizing Macroeconomic Data
R1 General Regional Economics
P27 Socialist Systems and Transitional Economies — Performance and Prospects O53 Economywide Country Studies — Asia including Middle East
Keywords (all: China): national income accounting, national statistical system, China Standard Industrial Classification System, industrial statistics coverage, ownership classification system, national statistical data sources/limitations/explanations
Carsten A. Holz [email protected]
Stanford Center for International Development Stanford University
366 Galvez Street Stanford, CA 94305-6015
Chinese Statistics: Classification Systems and Data Sources
1.
INTRODUCTION
China researchers frequently draw on Chinese official statistics for their analysis. These statistics are used for a wide range of purposes, from academic research to policy analysis and the
evaluation of business opportunities.
Two commonly used sources of Chinese official statistics are the CEIC China Premium Database (http://www.ceicdata.com/China.html) and the National Bureau of Statistics’ website (http://www.stats.gov.cn). However, one soon finds that while the CEIC database reports a large number of datasets, many series run for only a limited amount of time, and precise definitions as well as details on the coverage of statistics units are hard to come by. Similarly, on the NBS website one is either led to an online copy of the Statistical Yearbook—which all too often leaves one to one’s own devices in figuring out what exactly a particular series means, why it was discontinued, or what the implications of a change in label are—or to a database with limited time series data.
A short journal article cannot explain “all” Chinese statistics. What this article does is to clarify three issues that affect almost all Chinese statistics that economists are typically interested in (such as output and employment data), data classified by ownership, and detailed industry statistics. The mystery of discontinued series or changes in labels is often quickly resolved if one is aware that the sectoral classification system changed four times during the reform period, that state ownership can mean something very different at different points in time and depending on the concept used, and that detailed industry data have experienced an extraordinary large number of statistical breaks over the reform period. This is the subject of the first part of this paper.
For China scholars and non-China scholars alike, finding data beyond what is covered in the two databases mentioned above (including the Statistical Yearbook) is often a daunting task, and quickly abandoned in favor of some easily constructed proxy. But an astounding volume of data is regularly compiled and published in China. The legacy of a planned economy (with its need for a large volume of data) combined with a current government actively engaged in economic policy means that official data in China are plentiful, far beyond what one finds in a typical developing economy. While one has to be careful about what the data mean, the abundance of statistics is an economist’s paradise. The second part of this paper provides a list of key data sources, provides comments on the limitations of some of the sources, and points out secondary literature that explains particular Chinese data.
2.
CLASSIFICATION SYSTEMS
ownership classification system changed in 1998, while in industry the sectoral classification and the enterprise coverage of the DRIEs was revised repeatedly.
2.1 Sectoral classification
At both the national and the provincial levels, data are usually available for the economy as a whole as well as by sector. The main sectoral breakdown of the economy in the national income and product accounts (NIPA) is into primary, secondary, and tertiary sectors.
The primary sector, i.e., agriculture, comprises farming, forestry, animal husbandry, and fisheries. Comprehensive data on all subsectors are typically limited.
The secondary sector comprises industry and construction. For industry, data are available on up to 41 individual industrial sectors, with the precise number depending on the classification system in use at a given point in time. Time series data by industrial sector are available only for the directly reporting industrial enterprises (DRIEs), i.e., those enterprises that report regularly to the statistics xitong (functional bureaucracy), for variables ranging from output to employment, balance sheet, and profit and loss account data. The DRIE data for individual industrial sectors are reported in the industry statistics and are not reported as part of the NIPA.
Tertiary sector data are available in the NIPA and in the employment statistics for an exhaustive set of subsectors (though in the employment statistics not always covering all employees). The most detailed breakdown of the tertiary sector is into 12 to 15 subsectors, depending on classification system.
China’s sectoral classification system changed four times in the reform period:
Prior to 1984, the NBS used a classification system that had not been formally approved by China’s authority in charge of standards.
The first formal classification standard (GB, guobiao) was issued in 1984, labeled GB/T4754-1984 (in the following abbreviated “GB1984”).
GB1984 was revised in 1994 (GB/T4754-1994, or “GB1994”), following a trial revision in 1992.
In 2002, GB2002 was issued (GB/T4754-2002, “GB2002”).
In 2011, GB2011 was issued (GB/T4754-2011, “GB2011”).
An official list of sectoral categories is available for GB1984, GB2002, and GB 2011, not for the pre-1984 classifcation system or for GB 1994.1 A general description of the changes between GB1994 and GB2002 is given in the first through seventh issues of the 2003 edition of the NBS magazine Zhongguo tongji. NBS (2011) shows the correspondence between GB2002 and GB2011 and between GB2011 and the International Standard Industrial Classificataion of All Economic Activities (ISIC/Rev. 3).
The pre-1984 classification system and GB1994 are deduced as follows. The sectoral
employment data in the 1990 population census, as presented in the Population Census 1990, are in perfect accordance with the published GB1984, and the same holds for the 2010 population census and GB2002. This suggests that the available sectoral employment data of the 1982 population census may also match the (unpublished) pre-1984 classification system, and the available sectoral employment data of the 2000 population census may also match the
GB1994 and GB2002 likewise suggests that the classification of employment values in the population census 2000 is in accordance with GB1994.
Appendix 1 through Appendix 5 present the five classification systems at the one- and two-digit level:
pre-1984 as deduced from 1982 population census data,
GB1984 as available in official publications and used in the population census of 1990,
GB1994 as deduced from population census data of 2000,
GB2002 as available in official publications and used in the population census of 2010,
and GB2011 as available in official publications.
The first four appendices include the population census employment values of the corresponding years 1982, 1990, 2000, and 2010 (since 2000 collected for only a subset of the population, in the censuses’ long-form survey) in order to give some indication of the relative size of the different sectors. Employment rather than output values are included because output values are not available at the two-digit level for all sectors.
Appendix 6 presents the International Standard Industrial Classification of All Economic Activities (ISIC), Revision 3.1. China’s domestic classification systems at no point match ISIC 2, 3, 3.1, or 4 (draft version).
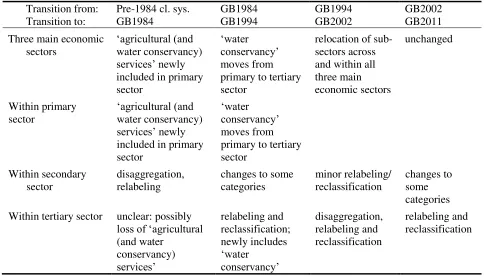
The first and last columns of Appendix 1 through Appendix 5 show the transitions between the different standards. Table 1 summarizes the major changes over time. Thus, (i) GB1984 for the first time separately listed agricultural (and water conservancy) services as subsector of the primary sector (Appendix 2, first column, top rows), (ii) disaggregated and relabeled industrial subsectors (presumably keeping the aggregate of industry unchanged), and (iii) retained the pre-1984 tertiary sector subsector classifications. The two standards appear largely compatible for the three main economic sectors (primary, secondary, and tertiary sectors) and also at the one-digit classification level with 13 (exhaustive) sectors. The only concern is that the subsector ‘agricultural (and water conservancy) services’ in 1984 was newly listed as part of the primary sector; it was not included anywhere in the pre-1984 classification. If it was subsumed in other agricultural subsectors in the pre-1984 classification, then the two standards are compatible at the level of the three main economic sectors. If, however, it was moved from the tertiary sector to the primary sector, then the two standards are not fully compatible at the level of the three main economic sectors—the discrepancy would be small as ‘agriculture (and water conservancy) services’ accounted for only 0.20 percent of economy-wide employment in 1990.
In GB1994, the overall 13-sector one-digit classification turned into a 16-sector classification. Water conservancy moved from the primary to the tertiary sector (to become part of geological prospecting and water management). The effect on the primary and tertiary sector aggregates is likely small, with only 0.07 percent of economywide employment (as captured by the long-form survey of the 2000 population census) in water conservancy. Apart from the switch of water conservancy from the primary to the tertiary sector, the three main economic sectors are
In GB2002, the total number of one-digit sectors increased to 20, with the classification now extending over four levels (menlei, dalei, zhonglei, xiaolei).2 The description of the changes in GB2002 (in comparison to GB1994) provided in the first through seventh issues of the magazine Zhongguo tongji in 2003 suggests a wide range of re-classifications, including across the three economic sectors. For example, in GB2002, one two-digit and one three-digit sector moved from industry into agriculture.3 One lower-level agricultural sector (‘household sideline businesses,’ jiating lianying fuye) is dissolved into the corresponding other (including industrial) sectors. In industry, the main changes are reallocations of three-digit sectors between industrial two-digit sectors. In construction, one significant change is the switch of institutions involved in
preparatory work for construction from the construction sector to the tertiary sector (into
polytechnic services). In the tertiary sector, the one-digit classification is revised and expanded, with reclassifications of lower-level sectors. Overall, the three main economic sectors appear only approximately compatible between GB1994 and GB2002, with minor and bi-directional changes between economic sectors. In addition, the coverage of the tertiary sector may have been extended to economic activities that were previously not included in the calculation of GDP.
GB2011 retains unchanged the three main economic sectors as in the GB2002, as well as the total of 20 one-digit sectors. The innovations are changes in labels, changes in the order of tertiary sector subsectors, and reclassifications within the secondary and tertiary sectors.4 GB 2011 went into effect on 1 November 2011 and first applies to the data of 2012.
[Table 1 about here]
In identifying the data relevant for productivity analysis, the issue of classification systems matters for ensuring consistency over time as well as across variables. Official data often come without an explicit statement as to which classification system is being used and it must then be deduced from the labels of individual sectors. At times, a published time series follows different classification systems in different years, or one table in the Statistical Yearbook reports data following two different classification systems, without this being made explicit.
2.2 Ownership classification
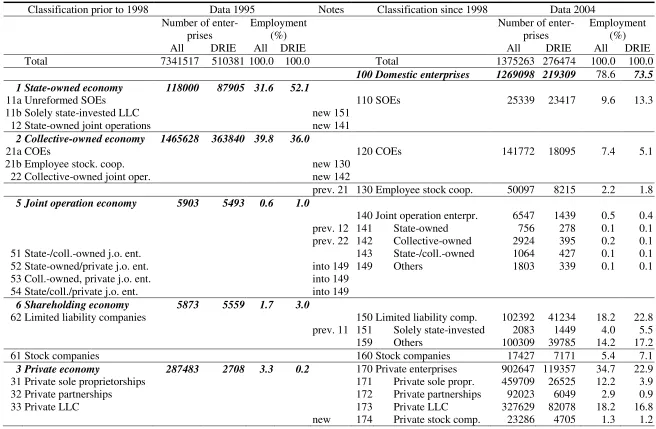
In 1998, the NBS revised its ownership classification. Table 2 compares the ownership
classification in use since 1998 with that in use prior to 1998. The collective-owned employee stock cooperatives are no longer included in a summary statistic on collective-owned enterprises but are now listed separately.5“State-owned enterprises” now refers only to the unreformed, or “traditional,” or “pure” SOEs, i.e., SOEs established or organized under the 1988 SOE Law. The SOE classification now also excludes the 100 percent state-owned limited liability companies as well as the joint operations between two or more state-owned enterprises. A stock company subcategory was added to each of three ownership types: private enterprises, HKMT (Hong Kong, Macao, Taiwan) enterprises and (non-HKMT) foreign-invested enterprises. This implies that the separate “ownership” category called “stock companies” now excludes stock companies in private, HKMT, or foreign ownership. The “ownership” category “limited liability companies” newly includes 100 percent state-owned limited liability companies. It continues to exclude
privately owned limited liability companies (which are included in the private enterprise
category). Presumably, the same pattern holds for HKMT and wholly foreign-owned enterprises in the form of limited liability companies.
comprised the household “enterprises” (or collaborations between household “enterprises”) with fewer than eight persons.
[Table 2 about here]
With the category state-owned enterprises now only covering the unreformed SOEs, a separate, new category of “state-owned and state-controlled enterprises” (SOSCEs) outside the formal ownership classification appeared in many statistics to capture state ownership in the various enterprise forms. The SOSCEs comprise the
pre-1998 definition SOEs, i.e., unreformed (or: pure) SOEs,
SOE-SOE joint operation enterprises, and solely state-owned limited liability companies,
+ all (other) enterprises (including limited liability companies and stock companies) in which the state has a controlling stake.6
The effect of these redefinitions is the existence of three different concepts of state ownership in the official statistics:
the pre-1998 SOE category (unreformed SOEs, solely state-owned limited liability companies, SOE-SOE joint operation enterprises),
the SOE category since 1998 (unreformed SOEs),
and the SOSCEs (since 1998).7
A direct comparison between the three concepts is first possible for 1999. In 1999, the gross output value (GOV) of unreformed SOEs was 2.2 trillion yuan; the GOV of unreformed SOEs, SOE-SOE joint operation enterprises, and solely state-owned limited liability companies (pre-1998 definition of SOEs) was 2.6 trillion yuan; and the GOV of SOSCEs was 3.6 trillion yuan (Statistical Yearbook 2001, p. 401). In 2010, the three values were 5.7, 8.5, and 18.6 trillion yuan (Statistical Yearbook 2011, pp. 499, 510). I.e., SOSCE GOV grew much more rapidly than the output of the unreformed SOEs or the output of the pre-1998 SOE category, and any political interest in a large state share in the economy suggests the use of the new concept of SOSCEs. But compared to an almost ten-fold increase in nominal GOV of all DRIEs in this period, SOEs in all three definitions fell behind with a three-fold, three-fold, and five-fold increase only. The SOSCE share in DRIE GOV over this period fell from 49 percent to 27 percent.
2.3 Industrial sector statistics
The NBS releases annual data on the DRIEs by industrial (two-digit) sector. These data are frequently of interest as they comprise output, balance sheet, and profit and loss account data; since 1998, employment values of the DRIEs are also reported in the same tables. The fact that all data come in one and the same (or a split) table eliminates any compatibility issues between variables.
However, some of the changes to the sectoral classification system over time affect these industrial two-digit sectors. Less obvious is the changing coverage of the DRIEs over time.
estimate to what extent the DRIEs—on which detailed annual data are available—are representative of all industry.
2.3.1 Sectoral classification system and coverage of DRIEs
In NBS publications, consistent classifications are in use for the following periods:
1980-84 (13 industrial sectors, with a very limited number of variables),
1980 and 1984-1992 (30 industrial sectors following GB1984),
1993-1997 (39 industrial sectors following GB1994),
1998-2002 (37 industrial sectors following GB1994),
2003-2011 (39 industrial sectors following GB2002),
and 2012- (41 industrial sectors following GB2011).
For each variable, in each period, the sum across sectors comes close to, or equals, the reported “total” DRIE value. When the sum across sectors does not equal the total, the implicit residual could reflect the (in all years) exclusion of military industry. A sector “weapons and ammunition manufacturing” is included in GB1994 (only), with no data reported. In GB2002 this sector disappears, not to re-appear at any other location of the classification sytem. In 1995, the residual industry sector is relatively small in size, accounting for 3 percent of employment and enterprise numbers and for 2 percent of GOV; however, the typical DRIE in that sector is relatively large in terms of output or employment per enterprise.
The coverage of the DRIEs first changed in 1998.
Through 1997, the DRIEs were defined as “industrial enterprises with independent accounting systems at the township level and above.”
Since 1998, the DRIEs are defined as “industrial state-owned enterprises (de facto
SOSCEs) with (de facto) independent accounting systems and all industrial non-SOSCEs with independent accounting systems and annual sales revenue in excess of 5m yuan.”8
The short-form label of the DRIEs in the Chinese statistics changed correspondingly, from “above-norm” to “enterprises above designated size.”
Subsequently, the coverage of the DRIEs was redefined three times, and the 2004 economic census led to the capture of previously excluded enterprises. These changes are discussed in the following.
Two minor redefinitions occurred in 2005 and in 2007.9In 2005, the term “sales revenue” was changed to “revenue from principal business.”10
In 2007, the separate inclusion of all state-owned enterprises disappeared and only the size criterion was retained. Starting in 2007, thus, the DRIEs comprise “all industrial enterprises with independent accounting systems and annual revenue from principal business in excess of 5m yuan.”
Starting in 2011, the size criterion changed from 5m yuan to 20m yuan.11 Otherwise, the earlier definition was retained.
A statistical break occurred around 2004, following the 2004 economic census, with revisions to some DRIE data. Thus, the Statistical Yearbook 2005 (p. 493)—based on
data of 2004 are incorporated in subsequent issues of the Statistical Yearbook, with the 2007 issue being the first one to report key data on more than just the current year, with a set of data for the years since 1998 (p. 508). The earlier 2004 number of DRIEs is revised to 276,474, a 26.0 percent upward revision. GOV is revised upward by 7.7 percent. Value-added is not revised. Data for the earlier years, 1998 through 2003, are not revised. (Statistical Yearbook 2005, p. 488)
The only explanation that can reconcile the apparent discrepancy between the revision to enterprise numbers and GOV but not value-added in 2004 is if the definition of what constitutes an enterprise changed in 2004. For example, if companies that comprise several factories were previously counted as one enterprise but are now newly counted as several enterprises, the number of enterprises and GOV increases, but value-added remains unchanged. However, the number of employees is also revised (as are profit and loss account data), from a pre-economic census 60.9862m to 66.2209m, an increase of 10.9 percent (Statistical Yearbook 2005, p. 494, 2007, p. 510).
This suggests that the economic census newly captured a significant number of enterprises which, given the proportion of the revision to the enterprise number (+26 percent) vs. GOV (+7.7 percent) and employment (+10.9 percent), are of relatively small size, possibly just barely making the 5m yuan sales revenue mark. That the NBS did not correspondingly revise value-added questions the quality of the output data. The value-value-added data are more likely to be deficient than the GOV data because enterprise accountants have no immediate interest in value-added but in GOV (sales revenue plus changes in inventories). The NBS obtains value-value-added by applying ratios to GOV values.12
Overall, the changes to the coverage of the DRIEs reduces the possibility of consistent time series analysis:
The re-definition of the DRIEs in 1998 creates a severe statistical break.
While the group of DRIEs changes every year in response to the entry or exit of firms, and to changes in the size of existing firms around the size threshold, in 2004 a set of enterprises that previously avoided reporting was newly included. These are likely to be relatively small enterprises. It causes a statistical break in all DRIE-related time series except value-added, where a break, possibly wrongly, does not occur.
The impact of the two redefinitions of 2005 and 2007 on the overall values of the DRIEs should be minor because revenue from principal business is likely to be less than one percentage point different from sales revenue, and because nearly all industrial state-owned enterprises have annual revenue from principal business in excess of 5m yuan.13
The 2011 change in the size criterion will likely have a significant impact.
Together, the changes to the sectoral classification system and the changes to the coverage of the DRIEs imply consistent data for the following periods:
1980-84: 13 industrial sectors, with a very limited number of variables, for the pre-1998 coverage of the DRIEs;
1980 and 1984-1992: 30 industrial sectors following GB1984, for the pre-1998 coverage of the DRIEs;
1998-2002: 37 industrial sectors following GB1994, for the post-1997 coverage of the DRIEs;
2003-2004: 39 industrial sectors following GB2002, for the post-1997 coverage of the DRIEs using pre-economic census 2004 data;
2004-2005 or -2007 or -2010: 39 industrial sectors following GB2002, for the post-1997 coverage of the DRIEs using post-economic census 2004 data, with two minor
re-definitions in 2005 and 2007 (revenue from principal business as criterion rather than sales revenue, and the omission of “all state-owned enterprises” as a separate category from the definition);
2011: 39 industrial sectors following GB2002, for the post-1997 coverage of the DRIEs using post-economic census data and a new size criterion of 20m yuan;
and 2012-: 41 industrial sectors following GB2011, for the post-1997 coverage of the DRIEs using post-economic census data and a new size criterion of 20m yuan.
2.3.2 Representativeness of the DRIEs in the aggregate
Researchers often generalize their findings from DRIE data—the only comprehensive annual industry data available—to all of China’s industrial sector (and may not make explicit that their industry data are limited to the DRIEs). But the production structure of DRIEs could differ significantly from that of other industrial enterprises.
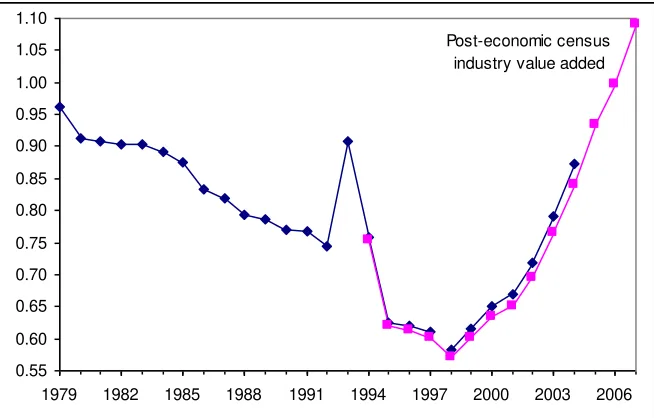
At the aggregate level, a comparison between DRIEs and all industry is possible using output and employment data.The share of DRIEs in industry value-added has fallen continuously from above 95 percent in 1979 to 75 percent in 1992 and reached a low of 61 percent in 1997 (Figure 1, with estimated DRIE value-added through 1992). After the statistical break in the definition of the DRIEs in 1997-1998, their share in industry value-added in the NIPA rose from 58 percent in 1998 to 87 percent in 2004, presumably reflecting the fact that an increasing number of industrial enterprises reached annual sales revenue of 5m yuan. Following the 2004 economic census, industry value-added was retrospectively revised upward, slightly lowering the share of DRIEs (whose value-added was not revised).
Figure 1 suggests two data problems. First, the jump in the share of the DRIEs from 75 percent in 1992 to 91 percent in 1993 and the subsequent equally drastic decline to 76 percent in 1994 (and to 62 percent in 1995) is not plausible. The concept of value-added was newly
introduced in 1993 (with data on value-added of the DRIEs retrospectively available for the years since 1992). The NBS may have experienced difficulty in compiling value-added data in the early years, including the proper handling of the also newly introduced value-added tax.14 Alternatively, the industry value-added data reported in the NIPA could be problematic.15
A second problem are the 2006 and 2007 shares of DRIEs in the value-added of industry, at 99.7 percent and 109.2 percent (and the rapid rise to such high shares over the previous years). The 2006 share seems far too high, given that in the previous year, 2005, the DRIEs accounted for 93 percent of value-added of all industry. The 2007 share, in excess of 100 percent, is
logically not possible. These values question the quality of either the DRIE data or the quality of the NIPA data. Publication of DRIE value-added data was discontinued in 2008.
revenue and GOV on the order of 1 percent only. The NBS can calculate value-added by applying a ratio to the GOV data. This ratio has changed little over time. The average of the years 1990-1999, for all of industry, was 3.50 with a coefficient of variation of 0.03; in 1998-2007, for the DRIEs, the average was 3.45 with a coefficient of variation of also 0.03.17 If the quality of the ratios is poor, then DRIE value-added data may be of poor quality. For industry value-added in the NIPA, the NBS could rely on industry and economic censuses to obtain somewhat reliable measures of value-added for the census years, and fill in the years in between (or since a census) by using the annual changes in DRIE GOV.
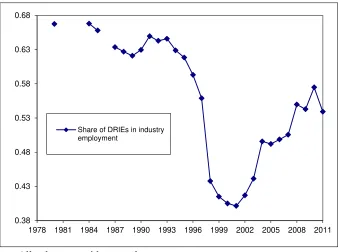
Figure 2 shows a similar trend for the case of employment, but at a lower level throughout. The share of DRIEs in industry employment fell from 0.67 in 1980 to 0.40 in 2001, before rising again, to 0.57, in 2010. With the redefinition of the group of DRIEs in 2011, the share value fell back to 0.54. Thus, while DRIEs consistently account for the bulk of industrial output, their share in employment never exceeded 0.67, fell to values as low as 0.40, and leveled out at a value around 0.54 in recent years.
[Figure 1 and Figure 2 about here]
2.3.3 Representativeness of the DRIEs in individual industries
At the level of individual industrial sectors, representativeness can come in one or both of two ways. The DRIEs could account for a very large share of that sector, in which case the DRIEs constitute (almost) all activities of that sector, or the typical DRIE in that sector could be very similar to the typical non-DRIE in that sector.
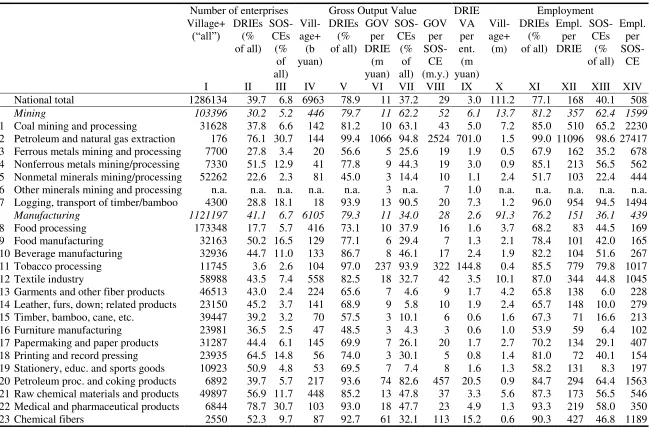
Analysis of the DRIE share in individual industries is possible for 1995, 2004, and 2008 using data from the 1995 industrial census and from the 2004 and 2008 economic censuses. For 1995, data on all enterprises within any one individual industrial sector are not available; what are available by individual industrial sector are data on “industrial enterprises at the village level and above plus private, joint, and individual-owned industrial enterprises with annual sales revenue in excess of 1m yuan,” here abbreviated “village+ enterprises.” The only missing enterprises are private, joint, and individual-owned industrial enterprises with annual sales revenue below1m yuan (“small private+ enterprises”). In the aggregate across industry, the “village+ enterprises” in 1995 accounted for 85 percent of industrial GOV, with data on value-added not available. The DRIEs accounted for 67 percent of industrial GOV and for 62 percent of industrial value-added.18
Table 3 examines the output volume of DRIEs (and SOEs) in comparison to the “village+ enterprises,” (industrial) sector by sector, for the three variables on which data for the “village+ enterprises” are available: enterprise numbers, GOV (no value-added data are available), and employment.19 Five monopolistic sectors stand out, in which the DRIEs account for more than 90 percent of the GOV of the “village+ enterprises:” ‘petroleum and natural gas extraction,’ ‘tobacco processing,’ and the three utilities sectors.
DRIEs (and SOEs) account for a large share in the GOV or in the employment of the “village+ enterprises” in those sectors in which the GOV or the value-added per DRIE (value-added data are available for DRIEs and SOEs) or the number of employees per enterprise is large. This suggests that when the DRIE share in the “village+ enterprises” (in terms of output or
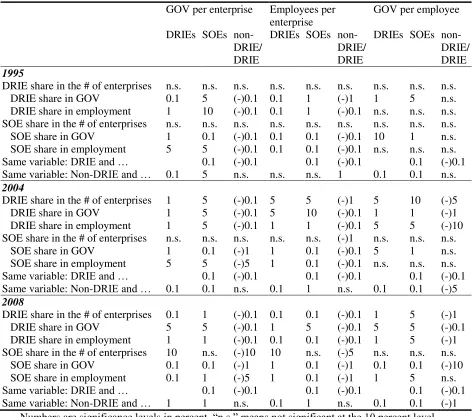
(strong correlates to sales revenue) per enterprise. The degree of representativeness indicated by the DRIE share in “village+ enterprises” thus is likely to exaggerate the DRIE share in all industry more for sectors in which the DRIE share is low than for sectors in which the DRIE share is high. Table 6 reports the significance levels of the core correlation coefficients for all three years, 1995, 2004, and 2008, with 2004 and 2008 discussed below; throughout, the results are reported excluding a small number (3-5) of monopoly sectors, and are mostly identical if these sectors are included.20
In 1995, the DRIEs account for less than 50 percent of “village+ enterprise” GOV in two sectors (5, 16), and for 80 percent or more in 21 sectors. In the latter 21 sectors— which
accounted for 70 percent of DRIE value-added and for 59 percent of “village+ enterprise” GOV —one might consider the DRIEs as relatively representative of that sector since they constitute the bulk of activities of that sector, while in the former two they may not be. Sectors in which the DRIEs’ share in the GOV of “village+ enterprise” is in the 60-70 percent range may have quite a few “small private+ enterprises.” For example, the garments industry, the leather industry, and the timber industry (sectors 13-15) all come with low DRIE value-added per enterprise (and are not known monopoly industries), which suggests they are natural entry industries for the “small private+ enterprises.”
How similar are the DRIEs to the non-DRIEs, especially in those sectors in which DRIEs account for a small share of output or employment? The correlation coefficients between non-DRIE and non-DRIE (or SOSCE) values of GOV per enterprise and GOV per employee are significantly positive (but not those of employment per enterprise). I.e., when GOV per
enterprise in the DRIEs of a particular sector is low, it is also low for the non-DRIEs. Except that for the non-DRIEs, values tend to be lower throughout than for the DRIEs (or SOSCEs). Thus, in 1995, the non-DRIE values as a fraction of the DRIE values, in the aggregate across all sectors, were: GOV per enterprise 0.18, employment per enterprise 0.20, and GOV per employee 0.90. The non-DRIE value of GOV per employee relative to the DRIE value was highest in ‘printing and record pressing’ (sector 18), at 0.64, and second-highest in ‘furniture manufacturing’ (sector 16), at 0.61.
Going a step further, in case the share of DRIEs in output or employment of a particular sector is relatively small, are the non-DRIE characteristics then particularly close to the DRIE characteristics, i.e., is the ratio of non-DRIE to DRIE values high (approaching unity)? If so, then if DRIEs account for only a small share of a sector, they can still be representative of the whole sector if the enterprises on which data are only available in censuses are very similar to the DRIEs (on which annual data are available). For 1995, the answer is to the negative. The non-DRIEs are not similar to the non-DRIEs in sectors in which non-DRIEs have a low share. There is either no correlation (for GOV per enterprise or per employee), or the correlation is positive (for employees per enterprise), in which case DRIEs and non-DRIEs share the same characteristics only in sectors with a large share of DRIEs. I.e., in 1995, in sectors with low DRIE penetration, these DRIEs are not representative of all enterprises. This changes by 2004.
1995. A second caveat are the implausibly high shares of the DRIEs in 2006 and 2007 (Figure 1), possibly also questioning the quality of the earlier data, of 2004.
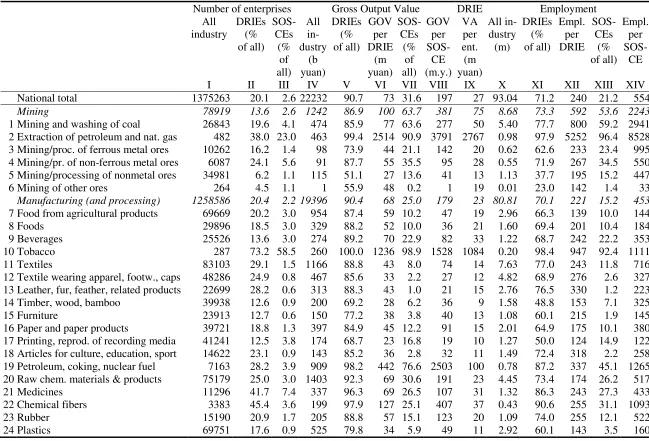
Table 4 provides a breakdown by individual industrial sector of DRIE and “all industry” values reported in the 2004 economic census. The share of DRIEs (SOSCEs) in the number of enterprises, in GOV, or in employment of all industry is positively correlated with the enterprise size measured as DRIE (SOSCE) GOV per enterprise or employment per enterprise, as well as with GOV per employee (with the one exception that the SOSCE share in the number of
industrial enterprises is not correlated with enterprise size values). In other words, as in 1995, in an industry in which the average DRIE (SOSCE) is relatively large, DRIEs (SOSCEs) account for a relatively large share of the output of that industry. Corresponding value-added data are not available by individual industrial sector for the group of all enterprises.22
By 2004, DRIEs accounted for at least 50 percent of GOV in every single industrial sector. They accounted for less than 70 percent of GOV in only four sectors (which, together, accounted for 2.2 percent of aggregate industrial GOV). The DRIE share was higher than 80 percent in 29 out of the 39 sector, with GOV of these sectors accounting for 88.8 percent of aggregate
industrial GOV. The employment picture is slightly different: DRIE shares in sectoral employment are lower, with shares below 50 percent in three sectors, and shares above 80 percent in 11 sectors only. GOV and employment shares, though, are highly correlated, for DRIEs as well as for SOSCEs.
How similar are the DRIEs to the non-DRIEs, especially in those sectors in which DRIEs account for a small share of output or employment? The correlation coefficients between non-DRIE and non-DRIE (or SOSCE) values of the three ratios (GOV per enterprise, employment per enterprise, and GOV per employee) are significantly positive throughout. When GOV per enterprise (etc.) in the DRIEs of a particular sector is low, it is also low for the non-DRIEs, except that for the non-DRIEs, values tend to be lower throughout than for the DRIEs (or
SOSCEs). Thus, in 2004, the non-DRIE values as a fraction of the DRIE values, in the aggregate across all sectors, were: GOV per enterprise 0.03, employment per enterprise 0.10, and GOV per employee 0.25. The non-DRIE value of GOV per employee relative to the DRIE value was highest in water production and distribution (sector 39), at 0.64, and second highest in the manufacture of articles for culture etc. (sector 18) at 0.45.
In contrast to the findings for 1995, if the share of DRIEs in output or employment of a particular sector is small in 2004, then the non-DRIE characteristics consistently come close to the DRIE characteristics. This means that if the share of DRIEs in output or employment of a particular sector is small, the typical DRIE in that sector strongly resembles—or: is
representative of—the typical non-DRIE in that sector. In contrast, when the DRIEs account for a very large share of output or employment in a sector, the typical DRIE in that sector is unlikely to have the same characteristics as the typical non-DRIEs in that sector, but given that the DRIEs account for a very large share of output and employment in that sector, there is little else in this sector besides DRIEs. Thus, by 2004 DRIEs are representative of all enterprises in an industrial sector either because they strongly dominate that sector or—if they don’t strongly dominate the sector—because their characteristics are similar to those of the non-DRIEs.
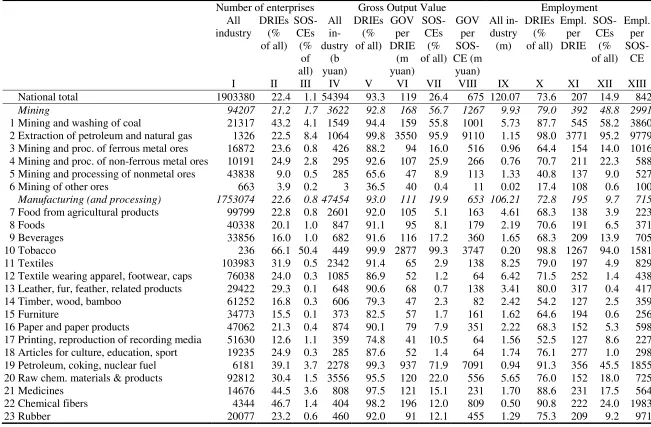
34 out of the 39 industrial sectors, DRIEs accounted for 80 percent or more of output; in terms of employment shares, only two sectors had DRIE shares below 50 percent, while 14 sectors had DRIE shares above 80 percent.
DRIE and SOSCE values for the three ratios (GOV or employment per enterprise, GOV per employee) continue to be highly positively correlated with the non-DRIE values. Compared to 2004, the (double-) ratios of Non-DRIE to DRIE values are even smaller: 0.02, 0.10, and 0.20. For GOV per employee, the highest ratio is 0.46 in water production and distribution, closely followed by relatively high ratios throughout the first half of the manufacturing sectors. Also as in 2004, if the share of DRIEs in output or employment of a sector is low then the characteristics of the typical DRIE in that sector are close to the characteristics of the typical non-DRIE in that sector. The conclusion thus, again, is that in sectors with a relatively small share of DRIEs, non-DRIEs are similar to non-DRIEs, i.e., non-DRIEs are representative of non-non-DRIEs, while in sectors with a relatively large share of DRIEs there is little else besides DRIEs to begin with.
Overall, Figure 1 with aggregate data suggests that the DRIEs are more representative of all industrial enterprises early in the reform period and in the 2000s than in the 1990s. Questions remain about the quality of output data in the late 2000s and about the extent of the individual-owned economy that is missing from the industry totals. The detailed sectoral data suggest that in 2004 and 2008 DRIEs are representative of all industry in virtually all sectors, either by virtue of accounting for much of output and employment in a sector or by virture of having the same characteristics as the non-DRIEs; this is less the case in 1995.
[Table 3, Table 4, Table 5, and Table 6 about here]
3.
SOURCES OF CHINESE STATISTICS
Data availability differs between the pre-reform and the reform period. Statistics going back to the early years of the PRC usually start with the year 1952, some with 1949. Data for the period 1949/52 through 1977 are relatively scarce. The quality of the data of some pre-reform years, such as the years of the “Great Leap Forward” and the “Cultural Revolution,” are likely to be poor as data for these years were assembled retrospectively in later years. Recent statistical publications, when reporting time series data, tend not to report pre-reform period data but to start with the year 1978.
The statistics xitong publishes economic data ranging from NIPA aggregates to price indices and labor market indicators, as well as various socio-demographic data. Some of these data have been collected by the statistics xitong itself, and some are obtained from other government departments. Each government department may also issue its own statistical publication(s). The NBS explains some of the data that it publishes, while a research literature explains Chinese data and examines its quality.
3.1 Data publications
Some statistical publications cover a wide range of variables, comprising different areas of the economy and/or society, typically for a particular year; the key example is the Statistical
focus on a particular topic in a particular year with limited time series data. Some publications are one-off publications, reporting on one particular event, typically a census.
Provincial data are included in some national-level publications and are also published by each province, in the form of provincial statistical yearbooks and occasionally other provincial statistical publications.23 These provide more detail on a particular province than national-level publications do. The statistics departments of some municipalities also publish data compilations, usually in the form of municipal statistical yearbooks. Localities may publish separate
compendia with long-run data for the particular locality or with statistics on a particular sector or topic (such as provincial industry statistics).
Most publications are in Chinese only. Bilingual publications, or English language editions, are explicitly noted below.
Annual yearbooks, which come with a particular year in the title, typically do not contain data for the year given in the title but data for the previous year (and often also for earlier years). The year given in the title tends to be the year in which the book was published.
The data reported in the Statistical Yearbook are available online at the NBS website (at www.stats.gov.cn), with several months’ time lag, free of charge, and starting with the 1996 issue.24 The website further provides quarterly and monthly data on selected indicators since 2001 (2002 in the English version), as well as data on recent censuses. The provision of data via this website appears to be under constant improvement both in terms of the range of data
provided and in terms of the time span covered. The English language version of the website tends to be lagging behind.25
The NBS website (in the Chinese version) also provides links to the statistics webpages of other government organizations and of provincial statistics departments. Some provincial
statistics departments—and a few municipal/prefectural statistics departments—also provide data online. Many of the recent statistical yearbooks come with a data CD that contains all data
printed in the yearbook; some of the data on the CD have more decimals than the data printed in the yearbook (apparent only when one examines the individual cells of a spreadsheet provided on the CD).
Outside China, the CEIC Data “China Premium Database” (http://www.ceicdata.com/) provides a wide range of data. Another source of Chinese statistics is the “China Data Center” at the University of Michigan (http://www.umich.edu/~iinet/chinadata/). It draws on NBS data as well as on data from other Chinese government institutions; some of these are integrated into a geographic information system.
3.1.1 Annual data
The NBS publishes annual data in approximately two dozen statistical yearbooks. The primary publication is the Statistical Yearbook (China Statistical Yearbook, Zhongguo tongji nianjian), available starting in October of each year with data through the previous year.
The data from a particular year first appear in a brief “Statistical communiqué on the economic and social development in year XXXX” (also: “Statistical Bulletin;” XXXX nian guomin jingji he shehui fazhan tongji gongbao) published in February of the following year, and then in a more extensive Statistical Abstract (China Statistical Abstract, Zhongguo tongji
comprises 25 sections on topics ranging from the NIPA (primarily GDP-related data) to investment, prices, and culture/sports/public health.27
The first Chinese language issue of the Statistical Yearbook series is of 1981 (with “1981” in the title), reporting data through 1981. Starting with the subsequent issue, the year in the title is one year ahead of the data reported; thus, the second Chinese language issue is labeled “1983” and reports data through 1982. The Statistical Yearbook has been bilingual since the 1994 edition. Separate English editions (Statistical Yearbook of China) appear to have been published parallel to the Chinese editions for 1981 through 1993. Since the 1996 issue, the Statistical Yearbook comes with an introductory passage to each of its sections where data and data sources are explained. Definitions of variables are appended at the end ofeach section.
The data coverage of the Statistical Yearbook focuses on the previous year, with occasionally data reported for some or all years since 1978. In the case of GDP, the Statistical Yearbook series usually offers one revision of annual GDP data. Thus, each issue of the Statistical Yearbook contains “first confirmed” GDP data for the most recent year and revised (“second confirmed”) GDP data for the second-most recent year.28
The NBS publishes a number of statistical yearbooks on specialized topics. A list of such yearbooks follows below, with all dates, here and below, referring to the date in the title of the book (which may not be the publication date, but often is), and XXXX/YYYY in this section referring to one yearbook with a period XXXX through YYYY in the title.29 Those statistical yearbooks that have been referenced earlier in this article with an abbreviated title are included in the list below as well as in the bibliography at the end of the article.
China Agricultural Product Price Survey Yearbook (Zhongguo nongchanpin jiage diaocha nianjian); published annually since 2004.
China and Urban Living and Price Yearbook (Zhongguo ji chengshi (zhen) shenghuo yu wujia nianjian); published annually since 2006, bilingual. Successor to the China Price and Urban Citizen and Houshold Income/Expenditure Survey Statistical Yearbook and to the China Price Statistical Yearbook.
China Basic Statistical Unit Statistical Yearbook (Zhongguo jiben danwei tongji nianjian); published annually since 1999.
China City Statistical Yearbook (Zhongguo chengshi tongji nianjian); published annually since 1985, with a combined 1993/1994 volume. Separate English volumes (China Urban Statistics) for each year 1985-88 (and possibly through 1990).
China Commodity Trade Market Statistical Yearbook (Zhongguo shangpin jiaoyi
shichang tongji nianjian); published annually since 2001, with as title of the 2003 volume China Commodity Trade Market Yearbook (Zhongguo shangpin jiaoyi shichang
nianjian).
China Construction Statistical Yearbook (Zhongguo jianzhuye tongji nianjian); published annually since 1996. The predecessor is China Construction Statistical Material
(Zhongguo jianzhuye tongji ziliao), published for 1952/85, 1986/87, 1988/89, and 1990/91.
China Energy Statistical Yearbook (Zhongguo nengyuan tongji nianjian); issues of 1986, 1989, 1991, 1991/1996, 1997/1999, 2000/2002, and then annually since 2004, bilingual since the 1991/1996 issue.
China Foreign Economy Statistical Yearbook (Zhongguo duiwai jingji tongji nianjian); issues of 1994 (with data for 1990-1993), 1996, and then annually starting 1998, bilingual. The successor is the China Trade and Foreign Economy Statistical Yearbook.
China Industrial Economy Statistical Yearbook (Zhongguo gongye jingji tongji nianjian), here abbreviated Industrial Yearbook; issues of (in the title) 1988, 1989, 1990, 1991, 1992, 1993, 1994, 1995, 1998, 2001, 2002, 2003, 2004, and then annually since 2006. Some issues carry detailed data of two previous years (rather than only one). The predecessor is the China Industrial Statistical Material (Zhongguo gongye jingji tongji ziliao), with issues of 1949/1984, 1986, and 1987.
China Investment in Fixed Assets Yearbook (Zhongguo guding zichan touzi tongji nianjian); issues of 1950/95, 1997, 1998, 1999, and then annually since 2003. The predecessor is the China Investment in Fixed Assets Statistical Material (Zhongguo guding zichan touzi tongji ziliao), with issues of 1950/1985, 1986/1987, 1988/1989, and 1990/1991.
China Labor Statistical Yearbook (Zhongguo laodong tongji nianjian); published annually since 1991, bilingual since 1995. A 1989 and a 1990 issue are available as China Labor and Wage Statistical Yearbook (Zhongguo laodong gongzi tongji nianjian).
China Market Statistical Yearbook (Zhongguo shichang tongji nianjian); published annually between 1993 and 2004. The successor is the China Trade and Foreign Economy Statistical Yearbook.
China Markets Yearbook (Zhongguo shichang nianjian); published in 1999 (1996 data), 2000 (1998 data), 2001 (2000 data), 2003 (2001 data), 2004 (2002 data), 2005 (2003 data), and 2006 (2004 data), bilingual. Discontinued with the 2006 volume. The
predecessor is the China Industrial Markets Yearbook, bilingual; it was published in 1997 with 1995 data. The China (/Industrial) Markets Yearbook reports NBS industry data through changing (non-NBS) outlets. The yearbook contains detailed four-digit sectoral data for selected variables on approximately 500 industrial sectors, including a list of the ten largest enterprises in each sector, and including an incomplete ownership
breakdown.30
China Population Statistical Yearbook (Zhongguo renkou tongji nianjian); published annually since 1988, bilingual since 1996.
China Price and Urban Citizen and Houshold Income/Expenditure Survey Statistical Yearbook (Zhongguo jiage ji chengzhen jumin jiating shouzhi diaocha tongji nianjian); published annually between 2000 and 2005; the successor is the China and Urban Living and Price Yearbook. The predecessor is the China Commodity Price and Urban Citizen and Household Income/Expenditure Survey Statistical Yearbook (Zhongguo wujia ji chengzhen jumin jiating shouzhi diaocha tongji nianjian) with issues of 1996, 1997, 1998, and 1999, itself preceded by the China Urban Citizen and Household
Income/Expenditure Survey Material (Zhongguo chengzhen jumin jiating shouzhi diaocha ziliao) with issues of 1988, 1989, 1990, 1991, and 1994.
China Real Estate Statistical Yearbook (Zhongguo fangdichan tongji nianjian); published annually since 1999, with combined volumes 2002/2003 and 2005/2006, bilingual.
China Regional Economy Statistical Yearbook (Zhongguo quyu jingji tongji nianjian); published annually since 2000, bilingual.
China Rural Household Survey Yearbook (Zhongguo nongcun zhuhu diaocha nianjian); published in 1992, and then annually since 2000.
China Rural Statistical Yearbook (Zhongguo nongcun tongji nianjian); published annually since 1985.
China Science and Technology Statistical Yearbook (Zhongguo keji tongji nianjian); published annually since 1991, bilingual since 1998.
China Trade and Foreign Economy Statistical Yearbook (Zhongguo maoyi waijing tongji nianjian); published annually since 2006, bilingual. Successor to the China Foreign Economy Statistical Yearbook and to the China Market Statistical Yearbook.
Compendium of Nationwide Agricultural Product Cost and Income Material (Quanguo nongchanpin chengben shouyi ziliao huibian); published annually since 2002. Two summary volumes for 1953-1997 were published not by the NBS but by the China Price Publishing House (Zhongguo wujia chubanshe), in 2003, with a title Compendium of Nationwide Major Agricultural Product Cost and Income Material Since the Foundation of the Country, 1953-1997 (Jianguo yilai quanguo zhuyao nongchanpin chengben shouyi ziliao huibian 1953-1997).
International Statistical Yearbook (Guoji tongji nianjian); published annually since 1995, bilingual since 2002.
Several statistical yearbooks were initiated in 2006. These include the bilingual China Environment Statistical Yearbook (Zhongguo huanjing tongji nianjian), the Chinese Society Statistical Yearbook (Zhongguo shehui tongji nianjian), the Industrial Enterprise Science and Technology Activities Statistical Material (Gongye qiye keji huodong tongji ziliao), and the China Tertiary Sector Statistical Yearbook (Zhongguo disan chanye tongji nianjian). The first issue of the bilingual China Population and Employment Statistical Yearbook (Zhongguo renkou he jiuye tongji nianjian) appeared in 2007.
Other central government departments also publish statistical yearbooks. Sometimes the particular government department itself publishes the book; at other times a special “editorial committee” is set up with no explicit link to a government department. Such statistical yearbooks include:
China Agricultural Statistical Material (Zhongguo nongye tongji ziliao); published annually since 1987 by the Agriculture Ministry.
China Civil Affairs Statistical Yearbook (Zhongguo minzheng tongji nianjian); published annually since 1990 by the Civil Affairs Ministry.
China Culture and Cultural Relics Statistical Yearbook (Zhongguo wenhua wenwu tongji nianjian); published annually since 1997 by the Culture Ministry.
China Economic Yearbook (Zhongguo jingji nianjian); published annually since 1981 (by an identically named publishing company).
China Education Statistical Yearbook (Zhongguo jiaoyu tongji nianjian); issues of 1987, 1989, 1990, 1991/1992, and then annually since 1998; bilingual since approximately 1989; published as China Education Facilities Statistical Yearbook (Zhongguo jiaoyu shiye tongji nianjian) with annual issues of 1992 through 1997, bilingual. A separate volume China Education Yearbook (Zhongguo jiaoyu nianjian) exists with issues of 1949/1981, 1982/1984, 1985/1986, and then for every year since 1988. Published by the Education Ministry.
China Labor Union Statistical Yearbook (Zhongguo gonghui tongji nianjian); published annually since 1993 by the All-China Labor Federation, with a combined 1995/1996 volume, bilingual since 2000.
China Land and Natural Resources Statistical Yearbook (Zhongguo guotu ziyuan tongji nianjian); published annually since 2005 by the PRC Land and Natural Resource Ministry.
China Rural Finance Statistical Yearbook (Zhongguo nongcun jinrong tongji nianjian); published annually between 1991 and 1996 by the Agricultural Bank of China, with a separate compendium China Rural Finance Statistical Yearbook 1979-1989 (Zhongguo nongcun jinrong tongji 1979-1989).
China Securities and Futures Statistical Yearbook (Zhongguo zhengquan qihuo tongji nianjian); published annually since 1996, bilingual.
China Tourism Statistical Yearbook (Zhongguo lüyou tongji nianjian); published annually since 1985 by the PRC State Tourism Bureau, bilingual (at least since 1992), with supplement (Chinese only).
China Urban Construction Statistical Annual Report (Zhongguo chengshi jianshe tongji nianbao), published for 1997/1998, 1999/2000, and then annually since 2001.31 The predecessor is the China Urban Construction Yearbook (Zhongguo chengshi jianshe nianjian), published for 1986/1987 and 1988/1989.
PRC Customs Statistical Yearbook (Zhonghua renmin gongheguo haiguan tongji nianjian); published annually since 1990 by the PRC Customs Administration (with the 1990 title China Customs Statistical Yearbook, Zhongguo haiguan tongji nianjian). Separate annual volumes in English under the title China Customs Statistics Yearbook.
TVE Yearbook (China Township [and Village] Enterprise Yearbook, Zhongguo xiangzhen qiye nianjian); published annually since 1989 by the Agriculture Ministry, with one compendium for 1978/1987.
Urban Water Supply Statistical Yearbook (Chengshi gongshui tongji nianjian); published in 1986, 1999, and 2006 (and perhaps for other years) by the China Urban Water Supply Association.
Statistical yearbooks are published for numerous sectors of the economy, ranging from coal to cotton. They are usually published by some enterprise association of that sector or some overarching government department or conglomerate. They tend to be in Chinese only.
General yearbooks published by government departments or associations often contain content (including statistics) that is of interest to economists.32 Of particular interest are the following three yearbooks:
China Finance Yearbook (Zhongguo jinrong nianjian); published annually since 1986. Separate (severely abbreviated) English editions are available as Almanac of China’s Finance and Banking for, at least, 1991, 1995, 1996, and then for every year since 1998 (and possibly for every year since 1990).
China Fiscal Yearbook (Zhongguo caizheng nianjian); published annually since 1992 with a bilingual statistics section since 2002.
China Price Yearbook (Zhongguo wujia nianjian); published annually since 1989, with a 2001/2002 combined volume.
Beyond explicitly statistical yearbooks and beyond general yearbooks with significant statistics sections, a wide range of “reports,” “development reports,” “blue books,” and “white books” are published annually, some of these by the NBS.33 The focus is on a specific theme with statistics only offered as supporting documentation.
3.1.2 Monthly and quarterly data
The NBS has been publishing monthly data in a series of magazines. These are:
China Statistics Monthly (Zhongguo tongji yuebao); published (at least) July 1985 through end-1989, in Chinese only.
China Statistics Monthly; published April 1988 (vol. 1, issue 1) through Jan/Feb/March 1992 (vol. 4, issues 10-11-12), in English.
China Monthly Statistics; published since 1992, in English.
In addition, since September 2000 the NBS has been publishing China Monthly Economic Indicators (Zhongguo jingji jingqi yuebao), a bilingual publication that focuses on economic data.34
Some monthly data are available on the NBS website (http://www.stats.gov.cn), as are quarterly data. The NBS does not have a quarterly statistical print publication. However, it occasionally publishes quarterly GDP data in the form of small booklets (Quarterly GDP 1992-2001, Quarterly GDP 1992-2005).
3.1.3 Census and survey data, input-output tables
The NBS has published numerous individual publications in response to specific events,
typically a census or survey. All of these publications are in Chinese. Recent (abbreviated) titles include:
Agricultural Census 1996.
Agricultural Census 2006.
Economic Census 2004. Four volumes.
Economic Census 2008. Five volumes.
Industrial Census 1985.
Industrial Census 1995. Three volumes.
Population Census 1982.
Population Census 1990. Four volumes.
Population Census 2000. Three volumes.
Population Census 2010. Three volumes.
Population Survey 1987.
Population Survey 1995.
Population Survey 2005.
Tertiary Sector Census 1993.
Input-Output Table 1987, and, separately, 1990, 1992, 1995, 1997, 2002, and 2007.
Similar volumes are usually published at the provincial level by each province’s statistics
department; those focusing on input-output tables tend to be considered internal publications. At the national level, additional, more elaborate publications exist internally for some censuses, such as the industrial census in 1985.
NBS survey data are not available to the public. On an individual basis, researchers have negotiated the purchase of data from the NBS, or obtained data through personal connections. This includes, with data for one or more years, the complete set of (individual) enterprise-level data for the DRIEs, datasets on large and medium-sized industrial enterprises (a subset of the DRIEs),35 and population census data.36 The Universities Service Center—the leading China library, located at the Chinese University of Hong Kong—sells a number of datasets, compiled not only by the NBS.37 The China Data Center at the University of Michigan sells some NBS census data.38
Data from a number of other surveys are publicly available. These include the China Household Income Project (CHIP) survey conducted by the Institute of Economics at the
Chinese Academy of Social Sciences,39 and the China Health and Retirement Longitudinal Study (CHARLS) conducted by the National School of Development at the China Center for Economic Research at Peking University.40
3.1.4 Long-run data
China’s Regional Economy in Seventeen Years of Reform and Opening (Gaige kaifang shiqi nian de zhongguo diqu jingji), here abbreviated Seventeen Years of Reform. Bilingual. Covers the years 1978 through 1995.
Comprehensive Statistical Materials on 50 Years of the New China (Xin zhongguo wushi nian tongji ziliao huibian), here abbreviated Fifty Years. Bilingual. Covers the years 1949/1952 through 1998.
Comprehensive Statistical Materials on 55 Years of the New China (Xin zhongguo wushiwu nian tongji ziliao huibian), here abbreviated Fifty-five Years. Bilingual. Covers the years 1949/1952 through 2004.
Comprehensive Statistical Materials on 60 Years of the New China (Xin zhongguo liushi nian tongji ziliao huibian), here abbreviated Sixty Years. Bilingual. Covers the years 1949/1952 through 2008.
For NIPA data, the most recently published volume (Sixty Years) is preferable to the earlier volumes as it incorporates the 2006 benchmark revision to GDP data following the 2004 economic census.
At the provincial level, the data from Guangdong and Hainan, and from Sichuan and Chongqing often require special attention. Hainan was part of Guangdong until it became a separate province in April 1988. The Statistical Yearbook 1989 with data for 1988 reports Hainan data separately for the first time. All four long-run compendiareport Guangdong and Hainan data separately. Chongqing was part of Sichuan until it became a separate province in 1997. The Statistical Yearbook 1998 with data for 1997 reports Chongqing data separately for the first time. In Seventeen Years of Reform, Sichuan includes Chongqing in all years; no separate data on Chonging are included. The Fifty Years, Fifty-five Years, and Sixty Years compendia report Sichuan and Chongqing data separately.41
The NBS has published a number of special publications with GDP data. The first is a retrospective compilation of NIPA data following the System of National Accounts for the pre-reform period and through 1995. The Chinese version is GDP 1952-95 (Historical Data on
China’s Gross Domestic Product 1952-1995, Zhongguo guonei shengchan zongzhi hesuan lishi ziliao 1952-1995), followed by, with one extra year, GDP 1952-96 (abbreviated title). The English version was published by Hsueh Tien-tung and Li Qiang (1999). 42 These compilations cover sectoral value-added in the production approach to the calculation of GDP, as well as expenditure data at the national level and at the provincial level, and income data at the
provincial level only. The data reflect the benchmark revision following the 1993 tertiary sector census, except in the case of Guangdong, whose data are unadjusted data, i.e., they do not incorporate this benchmark revision (GDP 1952-95, preface).
The bilingual GDP 1996-2002 provides data for the subsequent years 1996-2002. It also reproduces and, for some provinces, revises data for 1952, 1978, 1985, 1990, and 1990 (with the coverage not always complete). The National Income Accounts Yearbook 2004 is a one-off publication with national GDP data for 2000-2003 as well as a variety of other NIPA data.
Other publications related to the NIPA include two volumes on flow-of-funds statistics: Flow of Funds 1998-2002 (bilingual) and Flow of Funds 1992-2004 (bilingual). The first reports both national and provincial data; the second reports national data only. More recent national flow of funds data are reported annually in the Statistical Yearbook, though typically with a 2-year time lag.
Besides the comprehensive historical data and the detailed GDP data, the NBS occasionally publishes historical data on a specific topic. Such publications include, with detailed titles provided in the references: Industry, Transport, and Energy 50 Years (covering 1949-1999), Investment 1950-2000 (bilingual), Population Statistics 1949-1985, and Agriculture 1949-2004.
3.2 Explanations of Chinese data
Explanations of Chinese statistics can be found in a number of NBS publications. These range from compendia of rules and regulations to explanations of Chinese statistics offered by NBS staff, usually in Chinese. The explanations are not always sufficient and a research literature has developed, mainly in English, to examine Chinese data.
3.2.1 NBS publications and publications by NBS staff
Each section of the Statistical Yearbook comes with an introduction that explains how the data were obtained and ends with definitions of the variables used in the section. (Both, introduction and definitions are bilingual in the bilingual issues of the Statistical Yearbook.) Other statistical yearbooks often contain variable definitions, with occasionally some further explanations in a preface.
The NBS regularly publishes compendia of rules and regulations (NBS 1988, 1992, 1995, 1996, 2001a, 2004). Some of these compendia offer insights into how specific data are being compiled. The last two volumes no longer carry the stamp “internal” but are still not publicly available. Since 2004, either no further issues have been published, or none has found its way to locations accessible to researchers.
In 1992, 1993, 1995, 1996, 1997, and 1998 the NBS also published an internal Statistical Work Yearbook with details on statistical work and reform of the statistical system in the particular year. It contained a section on rules and regulations issued in that year. Similar to the compendia of rules and regulations, since 1998 either no further issues have been published, none has found its way to locations accessible to researchers.
The compilation of GDP data is explained in great detail in NBS (1997), Xu Xianchun (2000b), OECD (2000), and NBS (2007). The English language OECD (2000) was largely written by Xu Xianchun and Ye Yanfei, both NBS employees. Xu Xianchun (2004) provides a brief overview in English. NBS publications on GDP compilation include NBS (1997) and NBS (2007), in Chinese; NBS (2007) incorporates the changes in the calculation of GDP introduced in the wake of the 2004 economic census.
system (GB2002) for the industry sector. The NBS monthly magazine Zhongguo tongji frequently explains changes to current statistical compilation practices.
3.2.2 Research literature
Since the mid-1990s, researchers have routinely explored the meaning of specific official Chinese data. The large and growing body of literature in English covers every area of Chinese statistics from agricultural labor force data to alternative real growth rates of industry. The following is a list of some of the literature, by topic. If a source covers more than one topic, it is listed under what appears to be the most relevant topic. Complete references are provided in the reference list at the end of the book.
Agriculture: Kenneth Walker (1982), Cao Qingbo (1999).
Agricultural land and irrigation: James Nickum (1995), Vaclav Smil (1999).
Alternative industry/GDP growth estimates: Harry Wu (1993, 2002), Angus Maddison (1998), Carsten Holz (2006a,b).
Capital: Chen Kuan et al. (1988), Carsten Holz (2006c,d), Gregory Chow (2006a).
Data sources: Carsten Herrmann-Pillath, Daniel Kirchert and Pan Jiancheng (2002), Susan Xue (2004).
Employment, unemployment, and migration data: Thomas Rawski and Robert Mead (1998), Dorothy Solinger (2001, 2002), Liu Ta and Chan Kam Wing (2001), Thomas Rawski (2002a), Daniel Goodkind and Loraine West (2002), John Giles, Albert Park, and Zhang Juwei (2005), Cai Fang (2004), John Knight and Xue Jinjun (2006), Shi Zhenhua (2009).
Energy statistics: Jeffrey Logan (2001), Jonathan Sinton (2001), Jonathan Sinton and David Fridley (2000, 2002).
Evaluation of Chinese GDP and GDP growth estimates (occasionally including other variables besides GDP): F. Gerard Adams and Chen Yimin (1996), Harry Wu (2000, 2007), Meng Lian and Wang Xiaolu (2000), Thomas Rawski and Xiao Wei (2001), Wang Xiaolu and Meng Lian (2001), Thomas Rawski (2001a, 2001b, 2002b), Albert Keidel (2001b), Oleksandr Movshuk (2002), Lawrence Klein and Suleyman Ozmucur (2002-2003), Nicholas Lardy (2002-2003), Pan Zhenwen and An Yuli (2003), Friedrich Wu (2003), Carsten Holz (2003, 2004a, 2006a, 2006b, 2008a, 2008b), Angus Maddison (2006), Gregory Chow (2006b); in Chinese: Xu Xianchun and Tian Xiaoqing (1997), Xu Xianchun (1999a,b,c, 2000a, 2001, 2002, 2003, 2006), Yue Ximing and Zhang Shuguang (2002), Song Xiaochuan (2007), Aaron Mehrotra and Jenni Pääkkönen (2011), Masahi Hoshino (2011).
Evaluation of early PRC statistics: Choh-Ming Li (1962), Yoshiro Matsuda (1965), Dwight Perkins (1966), R. P. Sinha (1975), Thomas Rawski (1976), S. Lee Travers (1982), Eduard Vermeer (1986), Gregory Chow (1986), Yoshiro Matsuda (1990).