Design and Application of Software for Generating
Simulated Signal Data
Longcong Chen1, Gaiqin Liu2, Bin Gao1, Ping Chen1, Shixiong Deng1, Xingliang Xiong1*
1
Laboratory of Forensic Medicine and Biomedical Information, Chongqing Medical University, Chongqing, China; 2School of Opto-electronic Information, Chongqing University of Technology, Chongqing, China.
Email: *[email protected]
Received August 10th, 2012; revised September 12th, 2012; accepted September 24th, 2012
ABSTRACT
Simulated signal, produced by digital to analog converter, is important and necessary in many fields, such as electronic experiment, equipment debugging and maintenance, especially, in medical area. In this paper, the design and applica-tion of an effective software which may be used to generate simulated signal data by special wave picture obtained by scanner or drawing software are presented. First, we introduce how to realize producing needed data that meet the given conditions including amplitude, samples and resolution by this software. Second, the method and steps of getting the stimulated signal data from wave figure file is given. Third, an example of application about this software to generate simulated physiological signal data is shown. Then, the data are put into use and by digital to analog converter, an idea stimulated signal is produced. Therefore, with full confidence, we could draw a conclusion that it is very convenient and effective to get needed data for digital to analog conversion to generate all kinds simulated signal with a novel method.
Keywords: Digital to Analog Converter; Wave Picture; Simulated Signal
1. Introduction
In many fields, which include electronic experiment and testing, equipment debugging and maintenance, medical teaching, many special stimulated signals are often nee- ded. Take in medical equipment debugging as an exam-ple, the all kinds of normal and abnormal physiologic stimulated signals, such as electrocardiosignal, electro-encephalosignal, pulse wave signal, are often applied to test whether or not the medical equipment work properly.
As is known to all, all sorts of stimulated signals are often achieved by using digital-to-analog converter (DAC) which needs the corresponding signal digital data. With DAC, Lee, W. T., Vasan, B. K., etc. got demanded nals [1-4], and Dajun Tian acquired ECG simulated sig-nals [5], and Quan Zhao gained General Radar RF Signal [6,7]. Moreover, the digital data is acquired through ana-log to digital converter (ADC) or graph paper. For thro- ugh the ADC, we must have corresponding original sig-nal source as its input, while if not, we can get nothing about the digital data of stimulated signal. With this way, we must get original signal and face the problem—how and where to get it. As a result, it is not convenient and the resolution and samples of signals, which are limited by ADC, are fixed. For through the coordinate paper,
getting digital data is inefficient by hand. if only a few signals, this method is possible, but if there are a few dozen signals and each needs hundreds of samples or more, the workload is too big to complete and the effi-ciency is too low.
On the whole, the two ways to obtain simulated signal data (SSD) are not very efficient and convenient. To overcome the disadvantage, we designed this software, which can be used conveniently and easily, to generate automatically SSD with deferent samples, resolution and amplitude.
2. Methods
2.1. Procedure of Getting Digital Data
The procedure of getting needed digital data, which in-clude four steps, is shown in Figure 1. The function of every step is introduced below.
1) The first step is obtaining gray images, which must include wave pattern and can be gained by scanning from book and paper, or by drawing software such as Photo-shop, MSPaint, Coredraw, CAD and so on.
Obtaining gray
image
Digital image
Processing
Converting image
to signal data Data
[image:2.595.58.286.82.213.2]processing
Figure 1. The procedure of getting digital data.
3) Converting image to signal data is the third step and its goal is changing wave pattern to digital data for gen-erating corresponding stimulated signal.
4) The last step, the fourth step, is data processing in order to meet user’s conditions, such as amplitude, sam-ples and so on, and save needed digital data to files.
2.2. Processing Algorithm
The processing algorithm is essential and necessary for us to obtain digital data of simulated signal from an im-age that include needed wave pattern. The algorithm ge- nerally consists of the following five steps:
2.2.1. Linear Spatial Filtering
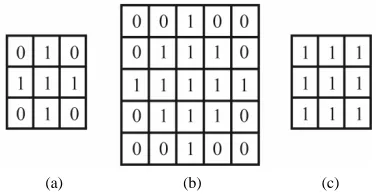
Spatial filtering includes linear and nonlinear ones [7]. In this software, only averaging linear spatial filter, which is simply the average of pixels contained in the neighbor-hood of the filter mask, has been designed. By replacing the value of every pixel in an image by the average of the gray levels in the neighborhood defined by the filter mask, this process results in an image with reduced “sharp” transitions in gray levels. Because random noise typically consists of sharp transitions in gray levels, the obvious result of this filtering is noise reduction, blur edges and reduce irrelevant detail in an image. We designed three kinds of averaging filter masks, and two of which are 3 × 3 (Figure 2(a)) and 5 × 5 (Figure 2(b)). The third is n × n, whose value may be set by input dialogue box.
The basic goal of linear spatial filtering is wiping out noise and reducing irrelevant detail in an image.
2.2.2. Image Binarization
The binarization process involves using a threshold op-eration. Pixels with grey level below the predetermined threshold are assigned a value of “1”, which is of maxi-mum brightness and whose display is pure white in im-age, while all others were designated a value of “0”, whose display is pure black. The essential purpose of this procedure is to erase some pixels which are not needed. The threshold, whose default value is three hundred, may be set by input dialogue box.
2.2.3. Morphonological Binary Image Processing The basic operations of morphonological binary image processing have dilation, erosion, opening and closing. Dilation expands an image and can bridge certain gaps, while erosion shrinks it and can eliminate irrelevant de-tail or isolated small area. Opening generally smoothes the contour of an object, breaks narrow isthmuses, and eliminates thin protrusions. Closing also tends to smooth sections of contours but, as opposed to opening, it gener-ally fuses narrow breaks and long thin gulfs, eliminates small holes, and fills gaps in contour. In this software we designed those four basic operations to be use, and user can choice anyone if image processing is necessary. For each operation, there are three kinds of algorithms, which are small disk (Figure 3(a)), large disk (Figure 3(b)) and rectangle (Figure 3(b)), and whose structuring elements are respectively shown in Figure 3.
Our primary aim of morphonological binary image pro- cessing is that only the needed wave pattern can be kept while other unexpected area and dots must be wiped out in picture by those operations. Certainly, we can erase manually to meet this purpose by drawing software.
2.2.4. Conversion of Changing Wave Pattern to Digital Data
In an image of including wave pattern, X axis is the equ- ivalent of time axis in signal waveform, which corresp- onds to the sampling sequence in digital signal, and Y axis is the size of the equivalent of digital signal. There-fore, we can easily obtained corresponding digital data of
[image:2.595.323.525.455.554.2](a) (b)
Figure 2. The averaging filter mask: (a) Shows 3 × 3 aver-aging filter mask; (b) Shows 5 × 5 averaver-aging filter mask.
(a) (b) (c)
[image:2.595.329.518.592.689.2]each sample by regarding each column as one sample, and the average position of black pixels in each column as one value of corresponding sample or column in digi-tal signal. In the actual conversion, taking into account the graphics that may be scanning, we can obtain three data for every column in an image: the top one which is the minimum coordinate value of Y axis of black pixels in the column; the bottom one which is the maximum coordinate value of Y axis of black pixels in the column; the average one which is the average of the top and the bottom of each column. Moreover, we looked upon the average value of each column as the digital data of cor-responding column or sample. In addition, because the coordinate value of Y axis gradually enlarge from top to bottom in an image while the value of digital data in sig-nal waveform lessen little by little from top to bottom, value of the real digital data should equal to the subtrac-tion of height of the image and the value of the digital data. The equation can be defined as
DHM (1) where D presents the real digital data, H is the height of the image and M presents the value of the digital data.
To each column, we can get real digital data, therefore, a group of digital data sequences (DDS), which may be presented by D [n] and in which n means the total num-ber of data, can be obtained from the whole image.
2.2.5. Digital Data Processing
The DDS, which are produced directly through wave pattern image often can’t meet given conditions; there-fore, it is necessary for the digital filtering and changing to stimulate signal data. In this software, we design an average digital filter, and it’s equation is:
1
0 1 m
l
D k D k l
m
(2)where k presents the order of digital data in sequences, m
is the number of averaging data, which can set by input dialogue box. By this processing, the total number of the data (TMD) is equal to n-m, the unexpected sharp transi-tions can be reduced or eliminated, and an ideal wave pattern digital data may be obtained.
For meeting the user’s requirements, we apply the fol-lowing two steps conversion:
1) Converting the number of DDS to the needed sam-ples
Because the number of DDS usually can’t meet user’s demand, we must covert the number of that to meet the need by the following algorithm. It is
1
j i TMD NN1 (3) where NN is the number of needed data which are equal to samples, it is the order of needed data, which can change from 0 to NN – 1, TMD presents the total number
of the data obtained after digital filtering, j is a float value.
Then, if the value of j isn’t equal to an integer, we can get an integer J, which meets inequality: J < j < J + 1.
We can get the value of TD [i] by using Lagrange’s interpolation formula for four neighbor data, whose order is J – 1, J, J + 1, J + 2. Lagrange’s interpolation formula is
1 1 2 6 [ ] 1 1 2 1 1 2 2 2 1 1 6 D JTD i j J j J j J
D J
j J j J j J
D J
j J j J j J
D J
j J j J j J
2 (4)if the value of J is equal to an integer,we can get TD [i] by the following equation:
TD i D j (5) Finally, the number in sequence of TD [i] is equal to samples.
2) Converting the DDS to the needed ones
The data of meeting given conditions can be gained by the following equation:
Min 2Max Min 2
r
TD i A
NDS i
2
(6)
where NDS [i] is DDS, Max is the maximum value in TD
[i] and Min is the minimum value in TD [i], r presents the number of bits, A is the amplitude of needed data.
Through this digital data processing, we can get all needed data, which meet user’s demand, and save to a file for using.
3. Application
In order to show how to apply the software, we gave examples of generating simulated physiological signal data. The processing generally consists of the following three steps:
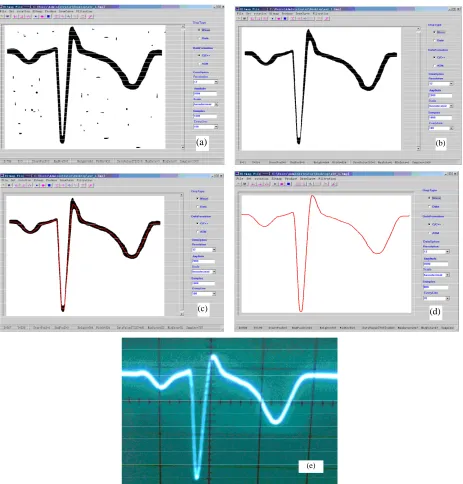
1) By scanning from a book, we obtained a gray image and saved to a file named avr_1.bmp.
unexpected part in an image by drawing software, such as Photoshop, MSPaint and so on.
3) Through “Bitmap Data” in menu of the software, changing wave pattern to digital data was completed, and red curve presents waveform of data sequences (Figure 4(c)). After we choose resolution, data formation (in-cluding C/C++ and ASM langue) and set the value of amplitude (2000), samples (1000), resolution (12 bits), the needed simulated signal data sequences could be ob-tained by clicking “Needed Data” in menu. Finally we
had obtained the needed data sequences, whose wave-form was shown in Figure 4(d), and saved correspond-ing data to a file for DAC.
The last, we show the result (Figure 4(e)) of output after DAC and low pass filter. There has little difference between the wave pattern in image and the waveform of output after DAC and low pass filter. Therefore, with full confidence, we could draw a conclusion that it is very convenient and effective to get needed data for digital to analog conversion to generate all kinds of SSD.
(a)
(b)
(c)
(d)
[image:4.595.68.531.209.693.2](e)
4. Discussions and Conclusions
In this paper, the method of generating SSD by special wave picture obtained by scanner or drawing software is presented. At the same time, an example of application about this software to generate simulated physiological signal data has demonstrated that it is very convenient and effective to get needed data for digital to analog conversion to generate all kinds of SSD.
The presented methods can obtain SSD without the corresponding original signal source, we believe that it has a good potential for application for generating signal data by DAC and filter, or for getting data from wave-form.
5. Acknowledgements
This work was supported by Department of Biomedicine Engineering in Chongqing Medical University, and au-thors would like to thank Dr. Fengpeng Jia at the First Affiliated hospital of Chongqing Medical University for his help in affording all kinds of physiological signal waveform.
REFERENCES
[1] E. Korhonen, W. Carsten and J. Kostamovaara, “Com-bining the Standard Histogram Method and a Stimulus Identification Algorithm for A/D Converter INL Testing with a Low-Quality Sine Wave Stimulus,” IEEE
Transac-tions on Circuits and Systems I: Regular Papers, Vol. 57, No. 6, 2010, pp. 66-1174.
[2] W. T. Lee, Y. Z. Liao, J. C. Hsu, Y. S. Hwang and J. J. Chen, “A High Precision Ramp Generator for Low Cost ADC Test,” Proceedings of 9th International Conference on Solid-State and Integrated-Circuit Technology, Beijing, 20-23 October 2008, pp. 2103-2106.
[3] B. K. Vasan, J. Duan, C. Zhao, R. Geiger and D. Chen, “Signal Generators for Cost Effective BIST of ADCs,” Proceedings of the European Conference on Circuit The-ory and Design, Antalya, 23-27 August 2009, pp. 113-116. doi:10.1109/ECCTD.2009.5274967
[4] C.-L. Huang, “A Multi-Channel Analog Signal Source Based on FPGA,” Electronic Technology, Vol. 36, No. 6, 2009, pp. 18-19.
[5] D.-J. Tian, Z.-M. Zhang, Y.-Z. Shi, W.-J. Su and T.-L. Yang, “Design of ECG Simulation Waveform Generating System,” Modern Electronics Technique, Vol. 33, No. 9, 2010, pp. 141-144.
[6] Q. Zhao and W. M. Jiang, “Design and Realization of General Radar RF Signal Simulators,” Ship Electronic Engineering, Vo1. 29, No. 9, 2009, pp. 198-201.