Flow field visualization and input waveform
optimization for a linear plasma synthetic jet
actuator
August 2012
Engineering Fluid Dynamics
CTW-EFD
Bachelor thesis
Bachelor of Applied Physics
Bachelor Thesis
Flow field visualization and input waveform
optimization for a linear plasma synthetic jet
actuator
Authors:
Christiaan
van Ommeren
Sebastian
Sterl
Supervisors:
Prof. dr. ir.H.W.M. Hoeijmakers
Dr.C. Sun
Abstract
The performance of a linear plasma synthetic jet actuator (L-PSJA) has been experimentally investigated as a function of the input wave train pulsing frequency and duty cycle. Visualization of the induced velocity profiles has been performed using Particle Image Velocimetry.
The used PSJA design consisted of two horizontally separated, exposed copper electrodes mounted on a plate of Duran glass of 2 mm thickness, with a third, grounded electrode on the other side of this plate. The horizontal gap distance between either of the exposed electrodes and the lower electrode was zero. The input wave train amplitudes were in the range of kilovolts.
Analysis of the velocity profiles reveals that the actuator behaviour shows no dependence on pulsing frequencies in the range 30 Hz to 70 Hz. Furthermore, a significant change in actuator behaviour as a function of duty cycles in the range 20% to 65% has not been observed. The latter indicates an opportunity for reducing energy costs in future industrial applications of PSJA devices.
Maximum values of vertical velocities in the jet, and vertical velocity flux above the actuator, were in almost all cases recorded at distances between 50 mm and 90 mm above the actuator surface. All measured maximum velocities were in the range 0.11 ms−1to 0.25 ms−1. All maximum values of the vertical velocity flux were in the range 0.003 m3s−1to 0.007 m3s−1per meter span. A numerical simulation of PSJA behaviour has been performed, which is able to replicate the order-of-magnitude of the experimentally found velocities, but not the structure of the jets.
Contents
1 Introduction 5
2 Principles of plasma actuation 7
2.1 Cold plasmas . . . 7
2.2 Dielectric barrier discharge . . . 8
2.3 Generation of thrust . . . 10
2.4 Applications and optimization of plasma actuation for flow control . . . 11
2.4.1 Single dielectric barrier discharge actuator . . . 11
2.4.2 Plasma synthetic jet actuator . . . 13
2.5 Numerical methods . . . 15
2.6 Research focus . . . 17
3 Experimental setup 19 3.1 Actuator construction . . . 19
3.2 Hardware . . . 20
3.3 Safety . . . 21
3.4 Particle Image Velocimetry . . . 21
3.5 Measurement series . . . 21
4 Experimental results 23 4.1 Methodology . . . 23
4.2 Results for pulse frequency series . . . 24
4.3 Results for duty cycle series . . . 25
4.4 Jet steadiness . . . 25
5 Numerical results 27 5.1 COMSOL results . . . 27
5.2 Analysis . . . 28
5.3 Validity of the model . . . 30
6 Conclusion and recommendations 33 6.1 Conclusion . . . 33
6.2 Recommendations . . . 33
A Pictures of the experimental setup 37 B Choice of parameters 39 B.1 Pulse frequency . . . 39
B.2 Duty cycle . . . 40
D Experimental protocol 47
E Pictures from PIV analysis 49
F Principles and implementation of the numerical method 53
F.1 Decoupling Eandρc . . . 53
F.2 Solving forρc . . . 54
F.3 Computing the induced velocity field . . . 54
F.4 Computational domains . . . 55
F.5 Boundary and initial conditions . . . 55
F.6 Parameters and constants . . . 55
List of used symbols
Symbol Meaning
Physical constants
0 vacuum permittivity (8.85·10−12Fm−1)
kB Boltzmann constant (1.38·10−23 JK−1)
e unit of charge (1.60·10−19 C)
Geometry
x horizontal coordinate (m)
y vertical coordinate (m)
Electrostatics
E electric field (Vm−1)
D electric displacement field (Cm−2)
r dielectric constant
dielectric permittivity (=0r) (Fm−1)
λD Debye length (m) Φ total potential (V)
φext externally applied potential (V)
φint potential due to internal charge buildup (V)
ρc net charge density (Cm−3)
ρc,ext charge density due toφext(Cm−3)
ρc,int charge density due toφint (Cm−3)
n0 background plasma density (m−3)
ni,e density of ions, electrons (m−3)
Ti,e temperature of ions, electrons (K)
P power (W)
Fluid dynamics
Sr Strouhal number,∼[frequency]·[length] / [velocity]
U∞ freestream velocity (ms−1)
c` lift coefficient
α angle of attack
f volume force density (Nm−3)
u flow velocity vector (ms−1)
ρ fluid density (kg·m−3)
p pressure (Pa)
µ dynamic viscosity (kg·m−1s−1)
u(x, y, t) horizontal velocity component (ms−1)
v(x, y, t) vertical velocity component (ms−1)
vmax average of maximum vertical velocities (ms−1)
v(x, y) time-averaged vertical velocity (ms−1)
vmax(y) maximum alongx-axis ofv(x, y) (ms−1)
Q(y) 2-dimensional vertical velocity flux,Rjetv(x, y)dx(m2s−1)
LABview parameters
A square wave offset for active duty phase (V)
B square wave amplitude for active duty phase (V)
C voltage value for passive duty phase (V)
fdrive driving frequency (Hz)
fpulse pulse train frequency (Hz)
Acknowledgements
The authors wish to express their gratitude to the following persons:
Reinder Heukers, as day-to-day supervisor;
ing. Paul Ni¨el and Herman Stobbe, for helping to design and build the experimental setup; Prof. dr. Harry Hoeijmakers, as main supervisor from the Engineering Fluid Dynamics group; Dr. Chao Sun, as supervisor from the Physics of Fluids group;
Dr. Yoshiyuki Tagawa, for providing access to the PIV setup;
Dr. Bert Bastiaens, for sharing his knowledge on the theory of plasma actuators;
Chapter 1
Introduction
Flow control has long been a focus of interest for scientists and engineers. The ability to manipulate flow patterns and control parameters such as lift and drag coefficients is of great importance in the fields of fluid dynamics and aerodynamics. For example, there exists a large need to increase the maximum lift and the lift-to-drag ratio of airfoils, so that airplanes may have lower stalling speeds and experience less resistance during flight. For wind turbines, control-ling the flow is useful to ensure a predictable power output and a constant blade load even in fluctuating wind conditions.
Flow control can be either passive or active. Tur-bulators, vortex generators, or specific geometric shapes, like mechanical flaps and slats, are known as passive flow control techniques, because no exter-nal energy is added into the flow. Active devices use external energy to add momentum into the flow.
A recent method of active flow control, based on electrohydrodynamical principles, is called plasma actuation. It is based on injecting momentum into a flow through an electric discharge. By applying high voltage waveforms between two electrodes, an ionic wind can be induced which can be used for flow control purposes such as separation control and load control. It is no surprise that plasma actuators have received much attention over the past decade, since an electrically-operated device could have great ad-vantages over mechanically-operated actuators.
Plasma actuators exist in various designs and types, depending on the application. The simplest design consists of two horizontally separated elec-trodes, one exposed to the air and one embedded in the material of the object in question, vertically separated by a dielectric layer. Applying a high-frequency, high-voltage waveform between the elec-trodes can induce a discharge, in which electrons and ionized particles undergo a motion towards one of the electrodes, subject to the influence of the electric
field. Through a mechanism that is not yet fully un-derstood, this induced flow injects momentum into the surrounding fluid, creating a wall jet which can delay boundary layer separation, an important as-pect in lift and drag control.
Different electrode configurations can be used to create other types of jets. For example, by inducing two wall jets headed towards each other, a vertical jet may be generated. This is called plasma synthetic jet actuation, and is the main subject of this report. Much research has gone into the performance and optimization of plasma actuators. Both the influ-ence on actuator performance of input parameters, such as waveform, frequency and voltage, and design parameters, such as electrode width and dielectric material type, have been the subject of a number of studies. Furthermore, much attention has gone into visualizing flow patterns and velocity distributions induced by plasma actuation, both in quiescent air and in crossflow.
This report focuses on the characteristics of syn-thetic jets created by a linear plasma synsyn-thetic jet actuator (L-PSJA), as well as on the optimization of the waveform parameters used to operate the actu-ator. Experiments have been conducted to visualize the jets using Particle Image Velocimetry, at differ-ent pulsing frequencies and duty cycles of the input waveform.
Chapter 2
Principles of plasma actuation
This chapter gives an overview of the theory needed to understand the functioning of plasma ac-tuators, and provides background on research into plasma actuation. First, the principle of gas dis-charge and the specific type of disdis-charge in plasma actuators is explained; then, some important results regarding the characteristics and optimization of two important kinds of plasma actuators are given - the single dielectric barrier discharge (SDBD) and the plasma synthetic jet actuator (PSJA). Lastly, a brief overview of some notable results in numerical simu-lations of plasma actuation is given.
2.1
Cold plasmas
A gas is a state of matter in which a substance has neither a definite volume nor a definite shape. The particles that make up a gas have different veloc-ities. The average velocity of these particles can be predicted using the kinetic theory of gases: in the 19th century, James Clerk Maxwell and Ludwig Boltzmann concluded that temperature is a measure of the average kinetic energy of the particles. If a gas is in a state of high temperature, the average ki-netic energy of the particles is high, and ionization may occur: a particle can split into an ion and free electrons.
The state of matter in which electrons and ions are separated from each other is called plasma. Plasmas can be categorized as either thermal (also known as ‘hot’), or non-thermal (‘cold’) [1]. If particles ion-ize due to high temperatures, the plasma is called thermal. For example, if air is considered at an atmospheric pressure and ambient temperature, its chemical composition is approximately 20 percent O2 and 80 percent N2, by volume. If the temper-ature increases, O2will start to dissociate first, and at higher temperatures, N2 will follow. When most
of the molecules are dissociated, the ionization of both N and O atoms will take place at around 9000 K [2].
A non-thermal plasma, however, is not induced by a very high temperature, but instead by a potential difference across a gas. One of the first measure-ments of the current-voltage characteristics of a gas between two electrodes, operated by a DC voltage, was done by Druyvesteijn & Penning [3]. The trans-formation process of a neutral gas into a conducting self-sustaining discharge is known as plasma break-down or ignition and the corresponding voltage is called the breakdown voltage. For a self-sustaining discharge, a so-called “electron avalanche” is re-quired. This effect is started by free electrons present in the gap between the electrodes, created by exter-nal sources such as the photoelectric effect [4]. If a voltage is applied between the electrodes, these elec-trons experience a body force towards the anode due to the present electric field. If the voltage between the electrodes is high enough, i.e. higher than a cer-tain critical voltage, the electrons that move towards the anode can ionize neutral gas particles on impact, leaving a positive ion and releasing another electron. The electrons will be accelerated further towards the anode and may collide again, causing second ioniza-tions, enhancing the process even more [4]. For more information on electron avalanches, see, for example, Raether [5]. Figure 2.1 displays a schematic repre-sentation of the electron avalanche process.
Figure 2.1: A schematic depiction of the electron avalanche process. From Kuffel et al. [6].
2.2
Dielectric barrier discharge
In this report, plasma actuators are considered. Even though gas discharges are involved in their op-eration, these devices function in a fundamentally different way from the DC gas discharges between two electrodes mentioned in the preceding section. The discharges involved in plasma actuation are di-electric barrier discharges (DBD).
A dielectric barrier discharge (DBD) is a discharge between two electrodes separated by a layer of di-electric material. DBD discharge devices are mostly operated in high-pressure gases. See figure 2.2 for a possible dielectric barrier configuration. The gen-eral purpose of the dielectric barrier is to limit the current and thus prevent the formation of arcs in high-pressure gases.
If such a device is driven by a DC voltage, charge carriers will accumulate on the dielectric surface -which is essentially a capacitance - and the electric field induced by that charge will counter the elec-tric field between the electrodes. If this effect is strong enough, the potential difference across the gap will be reduced to zero, and subsequently, the discharge will cease [8] [9]. It is this self-limiting behavior that characterizes DBDs: a dielectric bar-rier discharge can only be sustained continuously if the applied voltage is constantly increasing, which is, for practical reasons, unrealistic. Usually, therefore,
Figure 2.2: A possible DBD configuration. From Ko-gelschatz et al. [8]
Figure 2.3:Schematic representation of the 2D geometry of an SDBD actuator
AC waveforms are used to operate DBD devices: the applied voltage then switches between positive and negative values and discharges can be started anew during each half-cycle.
The simplest type of plasma actuator is called the Single Dielectric Barrier Discharge actuator (SDBD). This is an asymmetrical dielectric barrier configuration. It consists of two electrodes, one of which is usually grounded, and a dielectric that sep-arates them. The grounded electrode is usually em-bedded in the material across which flow control is required. For a schematic representation of the ge-ometry, see figure 2.3. The idea is to induce a dis-charge between the two electrodes and use it to inject momentum into the surrounding fluid (usually, air). To understand the functioning of this device in flow control, it is necessary to understand what kind of discharge is taking place. As mentioned, the wave-form must realistically be of AC type if discharges are to continue to be created. However, it turns out that the induced discharge is not an AC discharge that follows the voltage, but has its own distinct spatial and temporal characteristics [9] [10].
If the applied voltage is sinusoidal in shape, then on a macroscopic scale, one would expect an SDBD discharge to behave as displayed in figure 2.4. First of all, a discharge can only be created once the voltage is past a certain critical (absolute) thresh-old value. This is displayed as point (a) in the figure. As long as the voltage keeps getting more negative, the counter-electric field induced by the build-up of negative charge on the dielectric will not have a large enough influence to stop the discharge; however, once the voltage is at its minimum, when ∂V
capa-Figure 2.4: Macroscopic prediction of DBD discharge be-haviour, subject to a sinusoidal waveform. From Corke et al. [14]
ble of inducing thrust and generating wall jets when operating in still air.
This kind of “macroscopic” prediction of behavior does not yet say anything about the actual shape of the discharge occurring during periods (a)-(b) and (c)-(d). In order to determine this, Enloe et al. [9] used photomultiplier tubes (PMTs) to measure the light emission from an SDBD plasma actuator, tak-ing this as a measure of the plasma density. The voltage across the discharge was measured as well: see figure 2.5. It can be seen in this graph that, in-deed, the discharge is only active during those parts of the cycle in which the voltage was (in absolute terms) increasing and above a cricital value. It can also be seen that the strength of the PMT signal de-pends heavily on whether the voltage is in its positive or negative half-cycle, i.e. it appears much stronger during the negative half-cycle.
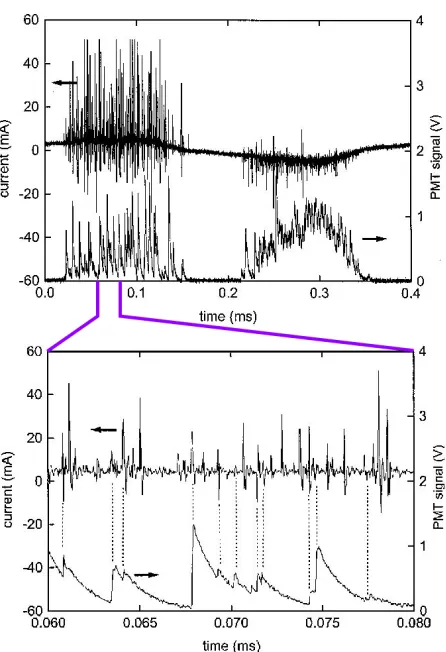
Figure 2.6 displays measurements by Enloe et al. [9] of the PMT signal and the discharge current with sub-microsecond resolution. It can be seen that the current through the discharge consists of a large number of individual short pulses. The time scale of one such current pulse appears to be in the or-der of microseconds or even less. The macroscopic effect, which to the eye might seem like a uniform dis-charge, thus consists of a huge number of individual micro discharges. In the upper graph, an asymme-try between positive half-cycle discharge (left) and negative half-cycle discharge (right) is apparent.
[image:13.612.82.282.92.202.2]Pons et al. [15] measured the discharge current of an SDBD actuator as well. See figure 2.7. These measurements again confirmed that the current con-sists of a large number of individual micro discharges that occur only during certain portions of the wave-form period.
Figure 2.5: PMT signal as a measure of plasma actuator light emission, as well as voltage across the plasma actuator, as measured by Enloe et al. [9]. The voltage frequency was 2.5 kHz. The “bumps” in the voltage, at e.g.t≈0.1 ms, were due to an “impedance mismatch in the driving circuit”, and induced an immediate discharge shutoff: a clear manifesta-tion of the self-limiting behavior.
Orlov [10] also performed light emission and cur-rent measurements on an SDBD actuator. Here, as in the study by Enloe et al. [9], the strength of the current pulses was seen to depend heavily on the cy-cle of the voltage.
Above a certain voltage (much higher than the breakdown voltage), the homogeneous discharges turn into streamers [12]: thin channels of ionized par-ticles reaching from the exposed electrode towards the dielectric. One theory states that these chan-nels grow because of photoionization: photons emit-ted during a local electron avalanche ionize other particles, freeing electrons that join in the initial avalanche. These electrons are able to ionize other particles, both directly and by further photoioniza-tion. These local charge distributions cause high lo-cal electric fields, comparable in magnitude to the external electric field, which make the streamer prop-agate at high speed towards the other electrode [7]. See figure 2.8.
Figure 2.9 displays a spanwise picture of a plasma actuator, taken at the critical voltage for the onset of streamer formation. The emission of light in thin streamers is clearly visible.
Figure 2.6: PMT signal from plasma actuator, and current through the discharge, as measured by Enloe et al. [9] during one period of a 2.5 kHz sine waveform. In the upper plot, the range 0.0-0.2 ms corresponds to the positive voltage half-cycle, and 0.2-0.4 ms to the negative one.
Figure 2.7: Input voltage and discharge current due to op-eration of a plasma actuator, at 20 kV amplitude and a fre-quency of 300 Hz. Measurements from Pons et al. [15].
[image:14.612.73.296.88.414.2]Figure 2.8: A schematic representation of the development of streamers, a phenomenon occurring in plasma actuation. Picture from Raizer [7].
Figure 2.9: Photo of streamer development on a plasma actuator electrode. From Thomas et al. [12].
circuit proposed by Enloe et al. Orlov proposed to add zener diodes to the circuit to simulate the break-down voltage. See figure 2.11.
2.3
Generation of thrust
At this point it is sufficient to note that, somehow, an operating plasma actuator is able to induce thrust and create wall jets in still air. While numerous sim-ulations of plasma actuation have been performed and a number have shown good agreement with ex-perimental results (see the later section on numerical methods), there is, to the authors’ knowledge, cur-rently no generally-accepted theory that completely explains the mechanism behind the thrust generation on a particle scale.
[image:14.612.329.520.294.368.2]de-Figure 2.10: The RC-model proposed by Enloe et al. [9]
Figure 2.11: The more complicated RC-model proposed by Orlov [10].
vice. However, it has been found by a number of studies that the net body force induced by a plasma actuator is always in the same direction: away from the exposed electrode and towards the dielectric [9] [12]. An attempt at modeling and explaining this phenomenon has been reported by Likhanskii et al. [16]. Using the results of their model, they proposed that during positive voltage half cycles, the body force is due to positive ions heading for the dielec-tric, and during negative voltage half cycles it is due to negative ions heading in the direction of the di-electric. These negative ions would be formed in attachment reactions of electrons to neutral gas par-ticles. Likhanskii et al. postulated that, while there is a countercurrent of particles heading for the ex-posed electrode during both half-cycles, reducing the efficiency of the actuator, the net body force is still always in the same direction [16].
2.4
Applications and optimization of
plasma actuation for flow control
There is a wide range of geometrical configurations of electrodes and dielectrics of different materials that are classified as plasma actuator. Each actuator has its own design, depending on the application. In this section, the specific purpose and optimization of two types are described: the single dielectric barrier dis-charge (SDBD) plasma actuator introduced in the preceding section, and the plasma synthetic jet ac-tuator (PSJA).
Figure 2.12: Schematic display of the purpose of a DBD actuator: generating a wall jet
2.4.1
Single
dielectric
barrier
dis-charge actuator
As mentioned, the idea of an SDBD actuator is to induce a discharge between the two electrodes. This discharge injects momentum into the surrounding fluid, creating a wall jet which can delay boundary layer separation, an important aspect in lift and drag control. A schematic displaying the essence of SDBD operation is shown in figure 2.12.
To get an idea of the velocity field induced by a typical SDBD actuator wall jet, see figure 2.13. This figure displays results from Pons et al. [15], who mea-sured actuator-induced velocity profiles above a di-electric flat plate in initially still air, for different horizontal positions (i.e. along the dielectric surface). Typical velocities induced in still air by plasma ac-tuators are in the order of a few ms−1 [11] [17] [18] [19].
The variables which influence the performance of an SDBD can be categorized as follows: 1) the geo-metric parameters; 2) the dielectric material; and 3) the electrical parameters. These are discussed sepa-rately below.
Geometric parameters
The main geometric parameters that determine the performance of the plasma actuator are the size of the upper and lower electrode, the gap between the exposed and grounded electrode, and the thickness of the dielectric. See figure 2.14.
-Figure 2.13: Velocity profiles at different horizontal posi-tions (x=0 at the edge of the upper electrode). A glass plate of thickness 4 mm was used as a dielectric. The input wave-form had a driving frequency of 300 Hz and an amplitude of 20 kV. The highest velocity was seen to occur atx=15 mm. Data from Pons et al. [15].
Figure 2.14: Important geometrical parameters in SDBD actuator operation
depending on the extent of the plasma region - be-yond which, the extra width is only a waste of space. This was also mentioned by Enloe et al. [17]. The optimum width of this electrode was in this case de-termined to be about 20 mm. Thirdly, it was con-cluded that the maximum induced velocity increases when the dielectric thickness decreases, though for very thin dielectric layers the discharge becomes un-stable and filamentary.
Enloe et al. [17] investigated the performance of an actuator for which the exposed electrode was a cylin-drical wire instead of a strip. At dissipated power levels in the order of tens of Watts, it was found that the thinner the wire, the higher the induced thrust for a certain value of the dissipated power. A similar trend was found to apply to flat electrodes: the thin-ner the electrode (normal to the actuator surface), the higher the generated thrust.
Thomas et al. [12] studied the effect of the dielec-tric thickness on the induced body force. It was con-cluded that the body force increases with increasing
dielectric thickness, contradicting the results found by Forte et al. [11] and Pons et al. [15], both of which indicated that decreasing the thickness is beneficial for the maximum induced velocity.
A notable type of plasma actuator is the multiple DBD, studied by Forte et al. [11]. This configura-tion consists of a number of SDBD actuators placed behind one another, so that each actuator can add further momentum to the flow. It was found that, with an actuator spacing of 2 cm, electrode widths of 20 cm and zero gap widths, each subsequent actu-ator added more velocity to the flow. After the third actuator, though, the effect became quite small due to the onset of turbulence. The maximum velocity found was 8 ms−1 at 25 kV amplitude and a driving frequency of 1 kHz.
Dielectric material
One common choice for dielectric material in plasma actuators is Kapton. Separating the two electrodes by Kapton has been applied in a number of stud-ies [17] [19] [20], sometimes in the form of very thin Kapton tape. PMMA has been used by Forte et al. [11] and Balcon et al. [18]. The former used glass as well, comparing the performance of SDBD actuators using either material as dielectric. It was seen that the glass actuator induced higher maximum veloci-ties than the PMMA actuator up to an input voltage of approximately 20 kV in amplitude.
Thomas et al. [12] studied the effect of the dielec-tric material on the induced body force. A compar-ative study between Kapton, Teflon, Delrin, Quartz and Macor was performed. The material which gave the best results was Teflon with a thickness of 6.35 mm. The main advantage of this Teflon over the popular Kapton tape was an increased support of high voltages (order-of-magnitude), which is de-sirable since higher input voltages appear to corre-spond to higher induced velocities [11]. It was also concluded that the body force increases with increas-ing dielectric strength and decreases with increasincreas-ing dielectric constant. Again, this is not in line with the results by Forte et al. [11] and Pons et al. [15], both of which indicated that increasing the dielec-tric constant is beneficial for the maximum induced velocity.
Electrical parameters
Figure 2.15: Pulse train: driving frequency, pulsing fre-quency and duty cycle
actuator are the amplitude, the waveform, the driv-ing frequency, and, in the case of a pulse train, the pulsing frequency and duty cycle. See figure 2.15 for a clarification of what is meant by the driving fre-quency and the pulsing frefre-quency. The duty cycle is the ratio of the duration of the active part of a period and the period itself: Tactive/Tpulse.
Results from Thomas et al. [12] indicate that a sawtooth driving waveform, whether positive or neg-ative, holds benefits over sinusoidal waveforms. At high voltage amplitudes - more than approximately 40 kV peak-to-peak - the thrust generated by a 2 kHz ramp signal was considerably higher than that due to sine waveforms at 1, 2, 4 and 8 kHz. For all wave-forms, typical values for the power dissipation were in the order of hundreds of Watts.
Enloe et al. [9] investigated the importance of the discharge’s asymmetry across the half-cycles by ap-plying two asymmetric sawtooth waveforms between the electrodes, one with a positive ramp and one with a negative ramp. Subsequently, the thrust in-duced by the actuator was measured. It was found that the negative-ramp sawtooth was able to pro-duce a higher thrust than the positive-ramp one, at the same power consumption. This was explained by noting that, from the PMT signal (figure 2.6), the plasma appeared to be much more regular during a negative half-cycle than during a positive one. Since the ramp sawtooth had a higher negative-going duty cycle than the positive-ramp one, the in-duced plasma was more regular for the former, which was thus “more efficient in coupling momentum into the flow” [9].
Balcon et al. [18] also compared the performance of the same two kinds of sawtooth waveforms in in-ducing wall jets. Taking the induced velocity and the homogeneity of this velocity over the surface into ac-count, they concluded that the sawtooth with nega-tive ramp was likely the more appropriate to “induce
homogenous and rapid airflows near the surface of an aerodynamic shape, in the boundary layer region” [18].
Forte et al. [11] found an optimum driving fre-quency of 1200 Hz at a fixed voltage amplitude of 20 kV for a sinusoidal waveform for their actuator. Past this frequency, the induced maximum veloc-ity, of approximately 6 ms−1, was found to display asymptotic behavior, hardly changing any more for higher applied frequencies.
An attempt at pulse frequency optimization was performed by Huang et al. [13]. Plasma actuation was applied on wind turbine blade models to con-trol the spread of the flow separation zone occurring above the trailing edge. Here, a pulse train with a driving frequency of 5 kHz was used. By measuring the pressure distribution at a certain point above the trailing edge, it was found that the pulsing frequency
fpulse was optimal for separation control when the Strouhal number Sr, based on a typical separation lengthLsep and the freestream velocityU∞, was
ap-proximately unity:
Sr= fpulseLsep
U∞
≈1, (2.1)
corresponding in that case tofpulse = 114 Hz. The same study also showed that, at equal pulse frequen-cies, a duty cycle of 10% was as effective as one of 50% in controlling the flow separation.
Little et al. [21] also investigated the effect of the driving frequency. In their study, the performance of an AC-driven SDBD was compared to that of a nanopulse-driven SDBD (ns-DBD). The induced wall jets were measured to be substantially weaker for the nanopulse-driven device.
2.4.2
Plasma synthetic jet actuator
Figure 2.16: Load control illustrated. The entire lift curve can be translated to the left or right, enabling constant lift over a range of angles of attack.
translation of the entire lift curve along theα(angle of attack) axis, thus enabling e.g. the same lift at lower angles of attack (a type of load control). See figure 2.16.
An overview of some methods for synthetic jet generation can be found in [25]. Some other stud-ies focusing on the characteristics and performances of synthetic jets as possible flow control devices are described in [26], [27] and [28].
Synthetic jets can also be created by using the principle of plasma actuation. Therefore, plasma ac-tuation is not only potentially useful for flow sepa-ration control, but also for load control.
The characteristics of SDBD plasma actuators can be used to create flow patterns other than only jets tangential to the wall. Jacob et al. [29] proposed to use two concentric annular electrodes, one exposed and one embedded, in quiescent flow, to produce tan-gential wall jets oriented towards the center of the configuration. See figure 2.17 for a schematic rep-resentation of this process. This kind of actuator results in a 3-dimensional jet normal to the wall [30] and is called a plasma synthetic jet actuator (PSJA). Using the same principle, a 2-dimensional upward jet can be obtained by using two SDBD plasma ac-tuators, consisting of rectangular strip-shaped elec-trodes, oriented oppositely on the same surface and operated simultaneously in quiescent air. See figure 2.18 for a schematic representation. In this case, two wall jets directed towards each other are induced by the respective actuators, which results in a jet
nor-Figure 2.17: Schematic representation of a synthetic jet created by an annular plasma synthetic jet actuator
Figure 2.18: Schematic representation of a 2D PSJA
mal to the wall that is basically 2-dimensional. (Note that a cross-section of the 3-dimensional annular con-figuration would give a similar figure.) Analyzing this kind of 2D-pattern can be more convenient than a 3D jet structure, for instance when using particle image velocimetry (PIV) [30] [31].
Alternatively, the two embedded electrodes can be replaced by a single one as displayed in figure 2.19. These 2D-actuators are sometimes referred to as lin-ear plasma synthetic jet actuators (L-PSJA) [32].
A characteristic streamline plot of the flow pat-tern induced by PSJA operation is given in figure 2.20. It can be seen that the actuation can cause two oppositely rotating vortices to appear above the electrodes, the jet developing in the middle. Next to these main vortices, the development of secondary and even tertiary vortices closer to the actuator sur-face has been observed and explained [30] [33]. The experimentally observed occurrence of distinct vor-tex pairs has also been reproduced in numerical sim-ulations [31].
Figure 2.20: Characteristic vortex pattern above a PSJA. Picture from Santhanakrishnan & Jacob [30].
The main advantage of plasma synthetic jet actua-tion, when compared to other types of synthetic jets, is the extremely fast response time of a PSJA system. Other advantages are the absence of movable parts of any kind, their ease of mechanical construction, and their lack of any jammable opening.
As is the case with SDBD actuation devices, the performance of PSJA configurations depends on a number of parameters. See the earlier section on SDBD optimization. A number of notable results from specific research into PSJA are summarized be-low.
Santhanakrishnan et al. [30] used PIV to analyze the vortex structures and velocity field induced by an L-PSJA on a flat-plate in quiescent air for differ-ent pulsing frequencies of a square wave pulse train at 50% duty cycle, as well as at steady actuation (100% duty cycle). It was found that, for the highest investigated pulse frequencies, at 100 Hz, the charac-teristics of the induced jet started to resemble those caused during steady actuation. Pulse frequencies of 10 Hz were found to induce the highest maximum jet velocities, of the order of 1 ms−1. Furthermore, the performance of the plasma synthetic jets in the presence of crossflow velocities of the same order of magnitude was investigated. The penetration depth of the jets was found to be less than 1 cm in all cases, and to decrease with increasing Reynolds number of the crossflow.
Bolitho & Jacob [33] describe a number of ways of controlling the direction and strength of a plasma synthetic jet. Firstly, applying a difference between the driving frequencies of two oppositely-oriented plasma actuators was seen to induce a difference in performance between the left and right actuator,
re-sulting in a jet inclined towards the weaker actuator. Secondly, a difference in duty cycle also proved to be effective in adapting the jet angle. Values between 10 and 90 degrees relative to the surface normal were observed for duty cycle differences between 0 and 50%.
Bolitho & Jacob also investigated the application of a phase shift of π between the driving wave-forms of each electrode pair. It was shown that, beyond a certain critical pulsing frequency, the in-duced jet was similar in strength to one inin-duced at steady actuation, because the combination of fre-quency and phase shift was such that vortices in-duced by one actuator during the other’s rest pe-riod, pushed upwards the vortex previously induced during the other actuator’s active phase. Below this critical frequency, the induced vortices were unable to push each other upwards, instead cancelling out or not interacting at all, meaning that the induced jet strength was far smaller. All pulsing frequencies were in the range 10-700 Hz. Again, maximum ve-locities were of the order of 1 ms−1.
2.5
Numerical methods
The focus of most modeling approaches to plasma actuation is to compute the body force applied to the charged particles in the flow. From the body force distribution, the induced jet velocities can be calculated. A few notable results are described be-low.
In principle, the force per unit volume acting on (charged) particles due to the operation of a plasma actuator is represented by
f=ρcE (2.2)
wheref is the force density (Nm−3),ρcis the charge density in the plasma (Cm−3), andEis the electric field vector (Vm−1) within the plasma region1 [17] [20]. The modeling of the operation of a plasma ac-tuation device thus generally focuses on computing the (spatial and temporal) charge density and po-tential (and so, the electric fieldE=−∇Φ) induced by the actuator.
To give an example, Enloe et al. [17] provide a derivation of an approximate expression for the lo-cal charge density in the plasma. This formula con-tains the so-called Debye length, λD, which is the
1Here, it is assumed that the Lorentz force term per unit
volumeJ×B, withJthe current density (Am−2) andBthe
characteristic length scale over which charge sepa-ration takes place (for more detailed information on the derivation, see also Appendix F):
ρc=−
0
λ2 D
Φ, (2.3)
where Φ is the electric potential. This formula sug-gests that the electric charge density in the discharge region is linearly proportional to the local value of the electric potential. Then, the body force per unit volume in the discharge region becomes
f=−0 λ2 D
ΦE. (2.4)
When determined, this kind of force term can be added into the Navier-Stokes equations as a momen-tum source term.
Orlov [10] gives a detailed description of both an electrostatic model and an electric circuit-based model, the latter of which represents the plasma ac-tuator operation in the shape of a network of re-sistors and capacitors. A noteworthy fact is that one type of circuit model by Orlov displayed the same correlation between the power dissipated in an SDBD plasma actuator and the applied voltageφext, as has been found experimentally by Enloe et al. [9]: namely,
P ∼φ7ext/2. (2.5)
Also, Enloe et al. [17] and Post [20] experimen-tally found the same correlation between the maxi-mum velocity induced by an SDBD actuator and the applied voltage,
umax∼φ 7/2
[image:20.612.331.520.83.253.2]ext, (2.6) hinting at a linear scaling of the maximum velocity as a function of the power dissipated by the actuator. A less empirical, more physical and chemical model by Boeuf and Pitchford [34] takes into account the interactions between electrons, ions and neutral particles in a plasma discharge and the phenomena of drift, diffusion and recombination, computing the re-sulting forces. The model by Likhanskii [16], which has been mentioned, starts from similar principles and aims to provide a possible explanation of the physical processes taking place during the negative and positive half-cycles of a DBD actuator driven by a sinusoidal voltage, and of the direction of the body force in such a device. Another example of a model based on interactions at the molecular scale
Figure 2.21: An example of streamer development as sim-ulated by the model of Nishida et al. [36]. Shown are the electron number density and equipotential lines.
and mass transfer principles has been described by Jayaraman [35].
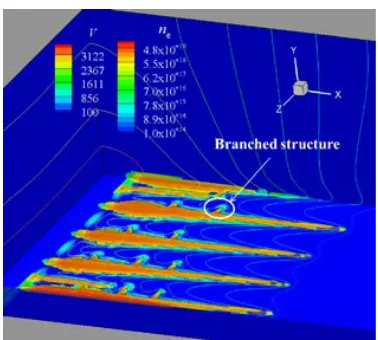
A notable recent model was developed by Nishida et al. [36]. This 3-dimensional simulation models the shape of the microdischarges on an SDBD plasma actuator using molecular-scale relations. The model replicates a branched structure of gas discharges from the exposed electrode on a time scale in the or-der of nanoseconds. When small irregularities were added on the modeled upper electrode surface, this was seen to have an impact on the discharge loca-tions due to strong local potential gradients at these points. See figure 2.21.
Suzen et al. [37] describe a phenomenological model, which was developed for SDBD actuators, but has also been adapted to replicate PSJA behav-ior by Santhanakrishnan et al. [31]. In that study, the streamline and vorticity plots as well as axial velocity distributions obtained from numerical sim-ulations were compared to experimental results ob-tained using PIV. The numerical method was able to “reasonably” replicate velocity and vorticity struc-tures near the actuator.
Another approach by Shyy et al. [38] is based on a linear approximation of the electric field distribu-tion around the electrode configuradistribu-tion of an SDBD actuator. This rather crude model was used by Liu et al. [39] to simulate the jet formation by a PSJA configuration and was able to replicate the formation of primary vortices and the development of a jet in between.
in-duced by the operation of plasma actuators can be found in [14] and in [40].
2.6
Research focus
Chapter 3
Experimental setup
This chapter describes the experimental setup used in this study. Firstly, the plasma synthetic jet actuator designs that have been used are described. Secondly, the operating hardware of the actuator is explained. Thirdly, an overview is given of safety measures taken in the experiments. Fourthly, the method for PIV measurements is described. Finally, the conducted measurement series are detailed.
3.1
Actuator construction
All experiments were performed with linear plasma synthetic jet actuators (L-PSJA, see section 2.4.2). Figure 3.1 shows the dimensions of the actuator de-sign that was used throughout this study, and figure 3.2 shows a photo of one of the used actuators.
In total, three actuators of this design were con-structed.
Dielectric material
As dielectric material, plates of Duran glass with di-mensions 200 mm x 100 mm x 2 mm were used. Du-ran glass has a dielectric constant of approximately
Figure 3.1: The dimensions of the dielectric and the elec-trodes as used in the PSJA construction. The upper elecelec-trodes are displayed in blue, the lower electrode in green.
4.6 and a transformation temperature of 525◦C1. It is beneficial to use a dielectric material that is able to withstand the temperatures that typically occur in a plasma actuator discharge. It has, for exam-ple, been mentioned by Forte et al. [11] that using a too thin actuator can result in strong local heating, and therefore in mechanical damage to the actua-tor. The choice for Duran glass was primarily based on its relative durability at high temperatures when compared to Kapton tape, which has been used in earlier studies in this group but proved unreliable due to heating problems.
Upper electrodes
The attachment of the upper electrodes to the di-electric is crucial in the construction of plasma actu-ators. The difficulty lies in attaching a good conduc-tor (the electrode) to an insulaconduc-tor (the dielectric), which makes welding or a similar process very dif-ficult. For this study, two options of glueing the electrodes to the glass were used.
The first option, used on two of the three actua-tors, was glueing non-adhesive copper strips of size 200 mm x 10 mm to the glass. The second option, applied on the third actuator, was using adhesive Advance AT526 copper tape strips of the same size. UV-Klebstoff MV 760 was used to glue the non-adhesive copper strips, which had a thickness of 0.05 mm, to the glass. This glue hardens in UV-light and can resist temperatures of up to 150◦C. The thickness of the layer of glue is listed as between 0.08-0.5 mm.2
1The data sheet for Duran glass can be found
online at http://www.duran-group.com/en/about-duran/ duran-properties.html
2The data sheet for the glue can be found onhttp://www.
Figure 3.2: Top view of one of the used actuators. Green arrows are used to indicate parts on the upper surface, red ones for the lower surface.
The Advance adhesive copper tape can resist tem-peratures of up to 155oC. One layer has a thickness of 0.035 mm.3 A major advantage of this tape is that it can be replaced easily, making it possible to keep the actuator “in good shape” by replacing the upper electrodes if they turned out to get damaged during measurements.
Two small strips of adhesive copper tape, each connected to one upper electrode, were folded around to the other side of the glass plate. Here, these two strips were connected by another strip of copper tape. In this way, a connection point for ex-ternal wires was provided such that the two elec-trodes could be operated in parallel.
Lower electrode
On the lower side of the plate, an electrode of size
±155 mm x 19 mm, made from adhesive copper tape, was located, so that the horizontal gap distance be-tween the upper and lower electrodes was zero. The lower electrode was encapsulated in dielectric Kap-ton tape to shield it from the environment, thus pre-venting discharges on the lower side of the actua-tor. One small strip of copper tape, connected to the electrode and oriented perpendicularly to it, ex-tended out from under the Kapton tape to act as a connection point for external wires. A small strip of Kapton tape was placed directly above it on the top surface of the glass, to prevent dielectric barrier
dis-3See also http://www.advancetapes.com/products/
markets/52/page1/87.html
charges from an upper electrode to this connection strip.
3.2
Hardware
A PSJA has to ionize the surrounding air in order to induce ionic wind. Typical plasma actuators oper-ate at voltage amplitudes in the order of kilovolts or tens of kilovolts (see paragraph 2.2). In this study, a Minipuls 4 high voltage generator was used to pro-duce the required voltages for inducing discharges in air. The Minipuls 4 can transform low voltage waveforms with a driving frequency in the range of 5-20 kHz to high voltage waveforms with amplitudes of up to 20 kV peak.
A Power Supply Voltcraft PS 3620 was used to provide a DC voltage as input for the Minipuls 4. A self-made LABView program and NI-DAQmx hard-ware were used as external waveform generator to set the waveform characteristics - driving frequency, pulse frequency, amplitude and duty cycle - as a con-trol input for the Minipuls 4. See Appendix B for a more detailed description of the program.
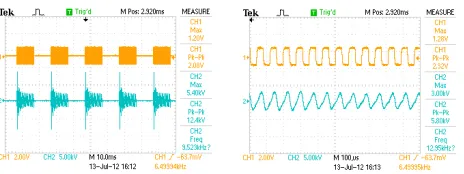
Via the copper strip that connected the two upper PSJA electrodes, and the lower electrode connection strip, the actuator was connected to the Minipuls 4. The lower electrode was grounded. The output wave-form of the Minipuls 4 could be checked using a LeCroy high-voltage probe (1000x attenuation) and a Tektronix TDS 2004B oscilloscope.
Figure 3.3: Schematic drawing of the hardware of the setup
3.3
Safety
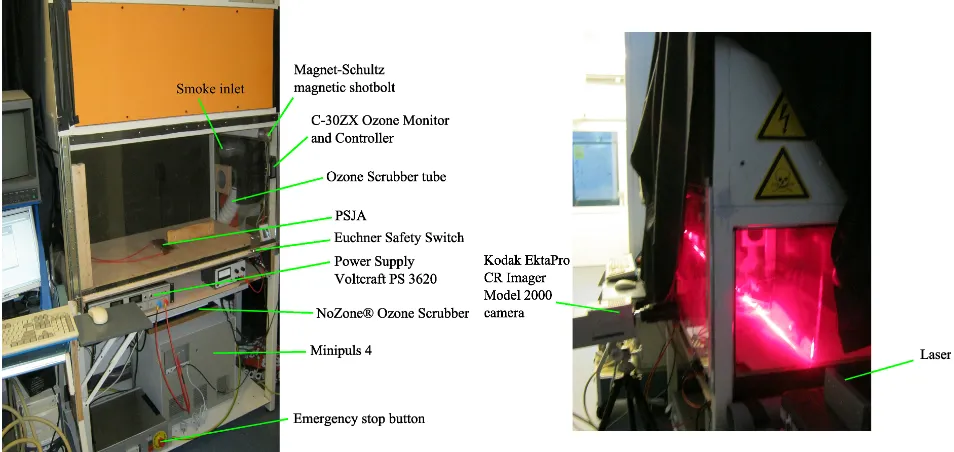
The experiments have been performed inside a cabi-net at ambient temperature and pressure. The cab-inet had a grounded metal frame and transparent plastic windows on all sides, and could be opened on one side with a sliding door. Its dimensions were 0.55 m x 1.19 m x 0.66 m. For the experiments, a PSJA was placed in the cabinet and connected to the output wires of the Minipuls 4.
Operation of a PSJA was found to produce ozone. When a PSJA was operated for a few minutes during preliminary experiments, the ozone concentrations within the cabinet were found to be much higher than the typically allowed limit exposure value4 of 0.05 ppm. To ensure an ozone concentration within safe limits, a NoZoneR Ozone Scrubber was installed
to remove ozone from the air in the cabinet in case of a too high concentration. The scrubber was con-nected to the cabinet by means of two tubes, so that, when operational, it drew air from one side of the cabinet and deposited the scrubbed air on the other side. In this way, air circulation for ozone depletion was ensured. The scrubber was only operated inbe-tween measurements, to ensure that the induced air circulation did not interfere with the velocity field measurements and that no fog, used for PIV mea-surements, was drawn into the scrubber.
In addition to the scrubber, a C-30ZX Ozone Mon-itor and Controller was used to measure the ozone concentration within the cabinet. As soon as the ozone concentration became too high, a signal was provided to a Magnet-Schultz magnetic shotbolt to lock the cabinet’s sliding door.
Through an Euchner Safety Switch, the Power Supply Voltcraft PS 3620 (and with it the Minipuls 4) was automatically shut off as soon as the sliding door was opened.
See also Appendix A for pictures of the setup.
4See, for example, http://www.ozonetech.com.sg/
UploadedImg/File/Safe%20Ozone%20levels.pdf
3.4
Particle Image Velocimetry
To map the velocity fields induced by the plasma synthetic jet actuators, particle image velocimetry (PIV) has been used. In this case, a LasirisTM Class 3B laser of 665 nm was used for producing a 2D laser sheet. The assumption was made that the induced flow fields would have strong 2-dimensional charac-teristics due to the symmetry of the actuator design, and therefore could be adequately visualized using PIV.
As seeding particles, fog droplets created from the fog generator SAFEX Nebelger¨at 2005 were injected into the above-described cabinet through a lockable tube in one of the cabinet walls. The seeding parti-cles, created from Inside Nebelfluid Blitz/Reflex, are water-based droplets and have a size of∼1µm. After injecting the fog, the cabinet was sealed off and the fog was allowed to disperse uniformly in the cabinet before measurements were performed.
Recordings of the flow field directly above an op-erational PSJA have been performed with a Kodak EktaPro CR Imager Model 2000 camera and Motion Central software. The recordings were performed at a rate of 60 fps and a resolution of 512 x 384. Anal-ysis of the raw data was performed with MATLAB and the PIV software PIVlab 1.31.5
See also Appendix A for pictures of the operational setup.
3.5
Measurement series
In the measurements, square waveforms generated in LABview were used as input for the Minipuls 4. The used driving frequency was 13 kHz, which had been found to be the resonance frequency of the system (Minipuls 4 plus actuator), at which the strongest discharge was induced, during earlier studies in this group. The pulse frequency and duty cycle were in-dependently varied to investigate the behaviour of a PSJA as a function of these two parameters.
It turned out that not all combinations of pulse frequency and duty cycle values could be used with the current setup, because of distortions and/or lim-itations induced by the Minipuls 4. See Appendix B for a detailed explanation. Usable values for pulse frequencies were found in the range between 30 Hz and 70 Hz. Usable duty cycle values were found in the range 20% to 65%.
5PIVlab 1.31, by W. Thielicke & E.J. Stamhuis, is available
Due to the TTL logic at the control input of the Minipuls, it was not trivial to keep the average am-plitude of the Minipuls 4 output signal constant dur-ing measurements in which the duty cycle was varied. For these measurements, the amplitude of the signal generated in LABview had to be calibrated in or-der to achieve Minipuls 4 output voltage values that were (approximately) constant across the duty cycle range. For a description of the used procedure, see Appendix B.
Prior to the measurements, the actuators were first tested for durability. The exact same waveform was applied 5 times in sequence, with 30-minute inter-vals, and the induced flow field was recorded with PIV.
The durability of the first actuator, with non-adhesive copper strips, was tested at 30 Hz pulse frequency and 50% duty cycle.
The durability of the second actuator (identical in design to the first) was tested at 30 Hz pulse fre-quency and 20% duty cycle. In this way, the effect of duty cycle on durability could be investigated.
The durability of the third actuator, with Advance adhesive copper tape as upper electrodes, was tested at 30 Hz pulse frequency and 50% duty cycle. In this way, the effect of using adhesive copper tape for the upper electrodes instead of non-adhesive copper strips could be investigated.
It turned out that the actuators with non-adhesive copper strips only lasted for 1 to 2 operations of
∼30 seconds each, after which their performance decreased considerably and the discharges became asymmetrical due to uneven damage to both elec-trodes. More detailed results of the durability tests are given in Appendix C.
The actuator design with adhesive copper tape as upper electrode material lasted for about 5 opera-tions before its performance, too, decreased due to damage to these electrodes. However, the measure-ment series regarding pulse frequency and duty cycle could be performed without problems by replacing the upper electrodes after each measurement. In this way, each measurement was performed with an un-damaged actuator of presumably the same quality.
Chapter 4
Experimental results
This chapter describes the results obtained from the experiments and the subsequent analysis.
Figure 4.1 shows the definition of the coordinate system axes as used here.
4.1
Methodology
Two sets of measurement series have been per-formed. In the first, the PSJA input waveform puls-ing frequency was varied between 30 Hz and 70 Hz at a constant 50% duty cycle. In the second, the duty cycle was varied between 20% and 65% at a constant 50 Hz pulsing frequency.
For each chosen value of the applied waveform pulsing frequency or duty cycle, a 2046-frame record-ing (34.2 seconds) of the flow field directly above the PSJA was made. From the second half of every recording, a set of 100 subsequent frames (spanning 1.67 seconds) was taken for analysis. PIV analysis was then performed with PIVlab 1.31 to compute the distribution of the vertical velocity in the recorded region for every pair of subsequent frames.
From each vertical velocity distribution corre-sponding to one pair of subsequent frames, the
max-Figure 4.1: The coordinate system within a recorded frame (not to scale) as used in the analysis. The vertical coordinate yis zero at the actuator surface; the horizontal coordinatex is zero in the middle of the actuator.
imum upward velocity in the region above the ac-tuator was extracted. The mean of all maximum vertical velocities, here calledvmax, was recorded as a function of the pulsing frequency and of the duty cycle.
The 99 distributions of the vertical velocity,
v(x, y, t), were also averaged to obtain one time-averaged distribution,v(x, y), for every value of puls-ing frequency and duty cycle. From this average dis-tribution, the following data was extracted:
1. The maximum vertical velocity along xin the average distribution, here called vmax(y), as a function of the vertical distancey from the ac-tuator, for all investigated values of pulsing fre-quency and duty cycle;
2. The averaged vertical velocity flux per meter span above the actuator surface, defined as
Q(y) =R
v(x, y)∂x, as a function ofy for all in-vestigated values of pulsing frequency and duty cycle. This quantity gives an indication of the net amount of mass displaced above the PSJA - e.g. flowing towards it (negativeQ) or from it (positiveQ).
The error estimation for vmax was performed by computing the standard deviation of each set of max-imum velocities.
Figure 4.2: vmax as a function of pulsing frequency at 50%
duty cycle.
4.2
Results for pulse frequency series
Pictures of all recorded time-averaged vertical veloc-ity profiles v(x, y) in the pulse frequency series are given in Appendix E.
The plot in figure 4.2 displays the found values of
vmax as a function of pulsing frequency.
The values forvmax are all in the range between 0.11 ms−1 and 0.24 ms−1 (including standard devi-ations). From the graph, it appears that the maxi-mum vertical velocity induced by the actuator shows no significant dependence on the pulsing frequency in the investigated range at 50% duty cycle. It must be noted here that changing the pulsing frequency does not alter the total energy input into the actua-tor, unlike changing the duty cycle.
It is also noteworthy that Santhanakrishnan et al. [30] did find a significant dependence of PSJA per-formance on pulsing frequency in the range 1 Hz to 100 Hz at 50% duty cycle, although it must be men-tioned that the actuator design and other electrical parameters in that study were not identical to those used here.
A plot of the maximum vertical velocity in the av-erage jet along lines of constanty,vmax(y), is given in figure 4.3 for all investigated pulsing frequencies. Here, too, no dependence on pulsing frequency is apparent. It is seen that in all cases except one, the maximum vertical velocity in the time-averaged jet appears in the range between 50 mm and 80 mm above the actuator.
Figure 4.3: Maximum vertical velocity in the time-averaged vertical velocity distribution as a function of distance above the actuator, for all investigated pulsing frequencies. The ac-tuator surface is situated at y =∼0 m.
Figure 4.4: Vertical velocity flux above the actuator, com-puted from the time-averaged vertical velocity distribution, as a function of distance above the actuator, for all inves-tigated pulsing frequencies. The actuator surface is situated at y =∼0 m.
However, the average vertical jet velocities are still seen to vary greatly across the investigated f pulse-range. The average spatial structure of the jets also exhibited significant differences across this range, as can be seen in thev(x, y)-plots in Appendix E. See also section 4.4 and chapter 6 for a further discussion on this matter.
Figure 4.5:vmaxas a function of duty cycle at 50 Hz pulsing
frequency.
4.3
Results for duty cycle series
Pictures of all recorded distributions of the time-averaged vertical velocity v(x, y) in the duty cycle series are given in Appendix E.
The plot in figure 4.5 displays the found values of
vmax as a function of duty cycle.
The values forvmaxare all between 0.13 ms−1and 0.25 ms−1(including standard deviations). No clear dependence on duty cycle appears from this graph; the velocities at high (>55%) duty cycle are in the same range as the velocities at low (< 35%) duty cycles in the plot. This appears to be in agreement with the claim by Huang et al. [13] that a duty cycle of 10% is as effective as one of 50% in controlling flow separation at the trailing edge of a wind turbine blade model with an SDBD plasma actuator.
A plot of the maximum vertical velocity in the av-erage jet at eachy,vmax(y), is given in figure 4.6 for all investigated duty cycles. It is seen that in each case, the largest value is reached between 50 mm and 80 mm above the actuator surface, as in the pulse frequency series. Again, no significant difference be-tween the smallest and the largest duty cycle values is present.
A plot of the upward velocity flux Q(y) for the investigated duty cycle values is given in figure 4.7. The flux attains its maximum value in the range be-tween 50 mm and 80 mm in all cases. All maxi-mum values of Q(y) lie in the range 0.003 m3s−1 to 0.007 m3s−1 per meter span, as in the pulse fre-quency series.
Figure 4.6: Maximum vertical velocity in the time-averaged vertical velocity distribution as a function of distance above the actuator, for all investigated duty cycles. The actuator surface is situated at y =∼0 m.
Figure 4.7: Vertical velocity flux above the actuator, com-puted from the time-averaged vertical velocity distribution, as a function of distance above the actuator, for all investigated duty cycles. The actuator surface is situated at y =∼0 m.
4.4
Jet steadiness
As can be observed from the pictures given in Ap-pendix E, the average spatial structures of the jets differ greatly across the measurements, both in di-rection and in width. To investigate the temporal steadiness of the jets further, scatterplots of the ver-tical velocity as a function ofx, at a constant value ofy, using all 99 velocity distributions belonging to one 100-frame recording, can be constructed.
Figure 4.8: Scatterplot of the vertical velocity above the ac-tuator at they-value corresponding to the maximum velocity in the time-averaged distribution, atfpulse= 50 Hz and 40%
duty cycle.
behaviour observed with respect to steadiness. Here, the constant value ofyhas in each case been chosen to be that at which the maximum value in the time-averaged velocity profile occurred (see figures 4.3 and 4.6 as well as Appendix E).
Figure 4.8 shows the most steady example ob-served, at 40% duty cycle in the duty cycle series. All velocities appear to have remained within a range of about 0.05 ms−1at each value ofx, and it is clearly visible that the location of the jet was at basically the same horizontal position in almost each of the 99 velocity distributions.
Figure 4.9 shows an example in which the veloc-ity at each xhad a larger bandwidth in time. This was observed at 45% duty cycle in the duty cycle se-ries. Occurrences of highly-deviating velocities can be seen on both sides of the jet. However, the lo-cation of the main jet is still clearly visible by the “bump” in the middle.
Figure 4.10 shows an example of the least steady kind of jet observed. This particular example was observed at 30 Hz pulsing frequency in the pulsing frequency series. Here, the location of the main jet is not at all clear; rather, there is a large region within which the jet appears to have shifted in ori-entation during the 1.67 seconds that the analyzed frames represent. Vertical velocities within a band-width of more than 0.20 ms−1 occurred in this re-gion. In cases like this, it seems that the behaviour of the actuator is very unpredictable even within a
Figure 4.9: Scatterplot of the vertical velocity above the ac-tuator at they-value corresponding to the maximum velocity in the time-averaged distribution, atfpulse= 50 Hz and 45%
duty cycle.
Figure 4.10: Scatterplot of the vertical velocity above the actuator at they-value corresponding to the maximum veloc-ity in the time-averaged distribution, atfpulse = 30 Hz and
50% duty cycle.
time scale of 1.67 seconds. This also implies that if 100 different frames had been taken for analysis of this measurement, the average jet would likely have looked markedly different.
Chapter 5
Numerical results
Numerical simulations have been performed to see whether these could replicate the behavior observed in the experiments. The method used here is the one proposed by Suzen et al. [37]. As was mentioned in chapter 2, this is a phenomenological method which does not describe the actual physics behind plasma actuation. However, it has the advantage that it decouples the charge density in the discharge region and the electric field, thus reducing computational time and effort.
The model was initially developed for analysis of SDBD actuators. However, it can be used for mod-eling of PSJA actuators [31]. In essence, the simula-tion procedure is as follows:
• It is assumed that the potential between the electrodes can be separated into an external part (the applied voltage) and an internal part (due to charge separation).
• The externally applied voltage between the ac-tuator electrodes is modeled by setting a finite-value potential as boundary condition on the upper electrodes, and zero potential on the lower one.
• It is assumed that the charge distribution in the region between the electrodes is governed by the value of the internal potential, which is due to the charge on the walls. It is solved for by set-ting a boundary value on the lower electrode and solving Maxwell’s equations.
• The resulting charge density is multiplied with the external electric field (assuming the electric field due to charge on the walls is negligible) to obtain the body force, which is inserted as body-force term into the Navier-Stokes equation.
In this study, the main equations from the model of Suzen et al. have been implemented in
COM-Figure 5.1: The potential close to the actuator electrodes
SOL 4.2a, along with the specific geometric param-eters used in the experimental study described in chapter 3.
A detailed overview of the assumptions in the model, the governing equations, the boundary con-ditions and constants specific for this study, the ge-ometry of the problem, and the specific COMSOL settings can be found in Appendix F.
5.1
COMSOL results
Since the simulations were performed with a DC voltage as boundary condition on the upper elec-trodes (see Appendix F), the resulting potential and electric field are time-independent. The potential in the air and dielectric domain close to the electrodes are presented in figure 5.1. The resulting electric field is displayed in figure 5.2. It can be seen that the electric field is strongest at the edges of the elec-trodes.
Figure 5.2: The electric field close to the actuator electrodes
Figure 5.3: The charge density on the dielectric surface be-tween the upper electrodes
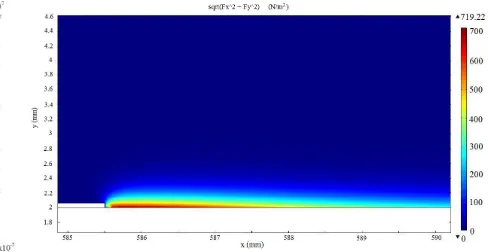
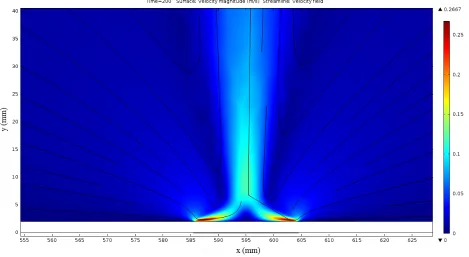
The multiplication of the charge density and the electric field yields the force per unit volume in the air domain. A plot of the volume force density at the left electrode is given in figure 5.4. The maximum value of the volume force density is about 720 Nm−3. The volume force density was implemented in the Navier-Stokes equation. The initial situation was set to be a quiescent environment with zero velocity ev-erywhere. Applying the volume force resulted in a time-dependent flow that eventually becomes steady if the simulation is run for a sufficiently long time. Wall jets formed at both electrodes at t = 0 and met in the middle, creating an upward jet that devel-oped in height until the steady situation was reached. Primary vortices developed on both sides of the jet and moved upwards until the steady situation was reached, in which they occupied most of the air do-main. The pictures hereafter are taken at the final time value of the simulation (t = 200 s), which is representative for the steady situation.
In figure 5.5, the streamlines in the entire air do-main are displayed. The velocity in the bulk of the vortices is in the order of millimeters per second.
Figure 5.4: The volume force next to the left upper electrode
Figure 5.6 shows a close-up of the jet directly above the actuator. The maximum velocity, induced right next to both electrodes, is about 0.27 ms−1. In the vertical jet, the velocity is about 0.1 ms−1.
5.2
Analysis
In order to extract more detailed information from the plots, analysis with MATLAB was performed.
Jet velocity
The upward velocity within the main jet decreases with the vertical distance above the actuatory. Fig-ure 5.7 shows a plot of the maximum vertical veloc-ity inside the central jet versus the vertical distance above the actuator. For low values ofy, this velocity decreases rapidly. At higher y values, this decrease slows down as the sides of the primary vortices start to constitute a part of the jet, as is clear from figure 5.5. At the heights at which the vortices swirl away to the sides, the jet dies out and the vertical velocity reduces to zero.
This velocity profile clearly differs from the exper-imentally found profiles of vmax(y) (see figure 4.3 and 4.6), where velocities were found to attain their largest values at approximately 50 mm to 80 mm above the actuator surface in nearly all cases.
Jet flux
Another quantity in describing the jet characteris-tics is the vertical velocity flux per meter spanQ(y) in the region above the actuator, as introduced in chapter 4.
Figure 5.5: Primary vortices form on both sides of the vertical jet
[image:33.612.73.542.418.675.2]Figure 5.7: Maximum value of vy in the jet as a function
of vertical distance from the actuatory.
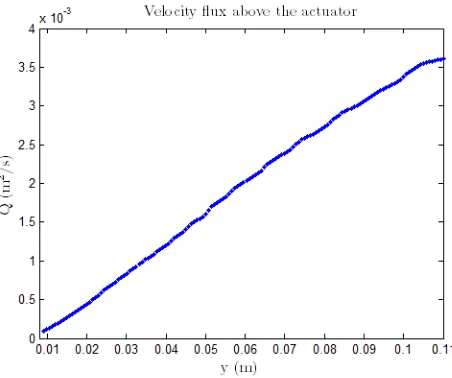
on they-range that was experimentally investigated, limited by the extent of the laser sheet (approxi-mately 100 mm in span). Within the latter range, the flux appears to increase linearly. At 100 mm distance from the actuator, it reaches a value of 0.0036 m3s−1 per meter span, comparable in mag-nitude to the values seen in figure 4.4 and 4.7.
A maximum inQ(y) is found at abouty= 0.3 m, more or less at the horizontal centerline of the sim-ulation’s geometry, at a value of 0.011 m3s−1 per meter span.
5.3
Validity of the model
Physically speaking, this model is not valid because it does not start from first principles and is based on certain unrealistic assumptions. For example, the charge densityρcbetween the electrodes remains un-affected by the external potential in the model and is also time-independent, meaning that the assumption is made that there is no movement of either positive or negative particles. However, it must be kept in mind that the purpose of the model is to keep com-putational time low by decoupling the electric field and the charge density.
[image:34.612.316.542.342.531.2]The outcome of a simulation with this model de-pends on the value of a number of input parameters. Most of these were either taken from literature or taken identical to experimentally used parameters (see table F.1). An exception is the externally ap-plied voltage. This voltage was chosen within the ranges typically found in literature (see chapter 2).
Figure 5.8: 2D velocity flux in the jet as a function of ver-tical distance from the actuator y, for the entire simulated y-range. The actuator surface starts at y = 0.01 m in the simulation.
Figure 5.9: 2D velocity flux in the jet as a function of ver-tical distance from the actuatory, for the range as recorded during the experiments described in Chapter 4. The actuator surface starts at y = 0.01 m in the simulation.
In this case, an applied voltage value of 12 kV was chosen to limit computational time before the simu-lation reached stability, which is almost 10 times the experimentally used average (absolute) value.
this range as a boundary condition in the model. However, no measurements of this kind were per-formed, and for this reason the value of 0.0008 Cm−3 (from [37]) was kept fixed as the charge density on the lower electrode.
Nevertheless, with the 12 kV value, the model suc-ceeds in producing an induced vertical jet with veloc-ities in the same order of magnitude (0.1 ms−1) as found experimentally. The development and order of magnitude of the velocity flux above the actuator
Q(y) also resemble the experimental results, which is important because this value can be used to estimate the net mass displacement by the actuator.
The main difference between the model and the experiments is that the jet in the model attains max-imum velocity directly at the surface of the actua-tor and only decreases in strength with increasing
y. This is in strong contrast to the experiments, in which the velocity was found (on average) to be maximal at a distance of 50 mm to 80 mm above the actuator.

![Figure 2.11: The more complicated RC-model proposed byOrlov [10].](https://thumb-us.123doks.com/thumbv2/123dok_us/9921168.493930/15.612.114.255.85.159/figure-complicated-rc-model-proposed-byorlov.webp)