Artistic Content Representation and Modelling based
on Visual Style Features
A thesis
submitted in partial fulfilment
of the requirements for the Degree
of
Doctor of Philosophy
by
Philip Buchanan
Abstract
Table of Contents
Abstract i
Acknowledgments iv
Chapter 1: Introduction 1
1.1 Introduction . . . 1
1.2 Research Goals . . . 2
1.3 Contributions . . . 3
1.4 Defining Style . . . 4
1.5 Vector Notation . . . 6
1.6 Software Implementation . . . 7
1.7 Rationale . . . 8
1.7.1 Consistency . . . 10
1.7.2 Concept Art . . . 12
1.7.3 User Generated Content . . . 13
Chapter 2: Background Research 16 2.1 Introduction . . . 16
2.2 Cognitive Approaches . . . 16
2.3 Shape Abstraction . . . 19
2.4 Statistical Classification . . . 21
2.5 Animation Style . . . 22
Chapter 3: Line Style Verification 23 3.1 Introduction . . . 23
3.2 Existing Studies . . . 24
3.3 Categorisation . . . 26
3.4 Transfer . . . 30
Chapter 4: Structural Vectorization 37
4.1 Introduction . . . 37
4.2 Existing Studies . . . 38
4.2.1 Thick Line Vectorization . . . 43
4.2.2 Structural Vectorization . . . 48
4.3 Results . . . 57
4.4 Form Preserving Scaling . . . 58
Chapter 5: Characteristic Proportions 62 5.1 Introduction . . . 62
5.2 Existing Studies . . . 63
5.2.1 Geons . . . 64
5.2.2 Image Subdivision . . . 67
5.3 Evaluating Geons . . . 70
5.4 Algorithm Overview . . . 76
5.5 Prototype Subdivision . . . 78
5.6 Image Extraction . . . 81
5.7 Database Analysis . . . 84
5.8 Proportion Transfer . . . 88
5.9 Results . . . 91
5.10 Conclusion . . . 96
Chapter 6: Model Reconstruction 98 6.1 Introduction . . . 98
6.2 Previous Work . . . 100
6.2.1 Overview . . . 100
6.2.2 Core Techniques . . . 102
6.2.3 Artist Assisted Systems . . . 104
6.2.4 CAD-based Systems . . . 110
6.2.5 Rescaled Base Meshes . . . 112
6.2.6 Alternative Approaches . . . 116
6.3 Mesh Rescaling . . . 118
6.3.1 Implementation . . . 119
6.3.3 Rescaling Discussion . . . 129
6.4 Model Generation from Concept Artwork . . . 130
6.4.1 Algorithm Overview . . . 130
6.4.2 Concept Image Preparation . . . 132
6.4.3 Skeletonisation . . . 133
6.4.4 Mesh Construction . . . 141
6.4.5 Mesh Refinement . . . 151
6.5 Results . . . 164
6.6 Evaluation . . . 164
6.6.1 Method Comparison . . . 167
6.6.2 Bredth of Input . . . 168
6.6.3 Discussion . . . 170
6.7 Conclusion . . . 171
Chapter 7: Conclusion 179 7.1 Limitations and Future Work . . . 179
7.2 Conclusion . . . 182
7.3 Attribution . . . 184
7.3.1 Line Art . . . 184
7.3.2 Concept Artwork . . . 184
7.3.3 3D Models . . . 186
Acknowledgments
To Dr. R Mukundan for your support, your insights, and for having the faith to let my research run off at all kinds of tangents. Thank you for proof-reading countless documents and double-checking countless equations. It was a pleasure to work with you.
Thank you to the Lund University Graphics Group for hosting me, I had a wonderful time! Thanks especially to Mike Doggett for such strong support during my stay, your experience and insight into the peer review process was invaluable, and our discussions about my research always helped to keep everything focused. This dissertation subsumes and extends the work that appeared in our two coauthored papers.
To Stickmen Studios, Wil McLellan and Brooklyn Waters; Carly Wheeler and the Foundation for Research, Science and Technology (now the Ministry of Business, Innovation and Employment). Thank you for the funding. I ap-preciate the leeway you gave me when I changed topics, the acceptance when my reports went missing, and for understanding that research doesn’t always go in a straight line. This research would never have happened without the technology fellowship.
To Margaret and Malcolm, who have given me the most amazing support throughout the whole project and are quite simply the world’s best parents. Thank you.
Thank you to the faculty and staff from the Computer Science and Soft-ware Engineering department at Canterbury University. To Richard Green, Andy Cockburn and Tanja Mitrovic for accepting a somewhat unorthodox and open ended research proposal; and to Gillian, Alex, Phil, Pete and Joff for making the department such a wonderful place to work.
Chapter I
Introduction
1.1 Introduction
Content creation in modern entertainment is now one of the most time con-suming components of a project. Extensive commercial toolsets allow artists to streamline this process by assisting with sketching, painting, modelling and animation. While these tools assist with the mechanical tasks of draw-ing, the core of artistic creation – an image’s visual style – remains in the realm of the artist. Style is what makes something appear cute, or creepy; it’s what differentiates two artists who draw using the same media. More con-cisely, style is a mechanism that changes our perception of an object without changing our ability to recognise it. This thesis aims to understand visual style in the context of a computational and algorithmic framework, using these traditionally intangible artistic properties to enhance existing content manipulation algorithms and develop new content creation methods. Suc-cessful research in this area has the potential to facilitate and reduce the workload of content creators.
Specifically, this thesis investigates the properties of visual style, devel-oping metrics that allow stylistic classification, replication and generation of graphics. It also investigates the indirect application of these metrics in developing smarter algorithms. Overall this research was a success, produc-ing viable results that would be applicable in a commercial settproduc-ing. Two self-contained and different approaches were developed, using artistic style features in the context of digital manipulation. Several related research areas also resulted in new algorithms and image processing techniques.
an individual artist’s style and apply those properties to other drawings. In concert with existing line-style techniques, the algorithm can be used to en-sure consistent artistic style across a project by automatically transferring a selected style between hand drawn images. Characteristic proportions can also be used to categorise drawings by different artists, and re-scale unknown input images to match a target style.
Chapter 6 shows the strength of using visual style properties to enhance existing techniques. Single-View Concept Modelling is the second advanced technique developed as part of this research. It allows a single piece of hand drawn 2D character concept artwork to be automatically analysed and converted into a computer generated 3D model without the need for user or artistic guidance. The constructed 3D model includes standard technical properties such as UV texture coordinates and bone influence values that mean this low-to-mid resolution 3D content is especially useful for rapid prototyping or in applications such as mobile games.
The research in this thesis deals primarily with hand-drawn cartoon and concept images. The outcomes provide style manipulation abilities that are missing from modern digital art creation pipelines, and the potential appli-cations reach beyond the scope of video games and electronic entertainment. Understanding and manipulating visual style at the software level could lead to automatic solutions or tools that address this issue, as well as faster and more coherent integration of generic art assets or user generated content. This thesis is an attempt to expand on the complicated and relatively unex-plored area of visual style, and hopefully opens up further opportunities in stylistic manipulation.
1.2 Research Goals
The initial aim of this research is to develop metrics that allow for quanti-tative measurement of style. Such metrics are based upon measurable image properties and should be representative of artistic style as opposed to image content.
style metrics, the goal of this thesis is to use visual style properties to create and enhance software for content creation.
Visual style properties could be used for direct style interaction, includ-ing methods for the understandinclud-ing, categorisation, and manipulation of vi-sual style. Style properties could also be used indirectly to enhance existing software or automate currently manual procedures in the content creation pipeline. The goal of this research is to speed up the development of large digital media projects by making content creation faster, easier, or by putting it in the hands of users.
1.3 Contributions
This thesis makes a number of significant contributions in the areas of visual style manipulation and 3D model generation. Traditionally intangible artistic properties are measured and used throughout this thesis to enhance existing content manipulation algorithms and develop new content creation methods.
Chapter 3 successfully reproduces existing research, and confirms that line metrics can be representative of the artistic style and not only of the content of an image. This research led directly to the development of a vec-torization technique specifically for line based cartoon content. This was published at IVCNZ in 2012:
Buchanan, P., Doggett, M., and Mukundan, R.
Structural vectorization of raster images. In Proceedings of the 27th Conference on Image and Vision Computing New
Zealand (2012), ACM, pp. 319–324
Buchanan, P., Doggett, M., and Mukundan, R.
Transferring characteristic proportions to modify the artis-tic style of cartoons. In Proceedings of the 30th Computer Graphics International Conference (jun 2012)
Two automatic model creation methods are presented for use in rapid prototyping and content generation pipelines. Using image metrics, a single piece of 2D concept artwork is used to produce a fully textured and rigged 3D model without user intervention. This work advances the field of Sketch-Based Interfaces and Modeling:
Buchanan, P., Mukundan, R., and Doggett, M.
Au-tomatic single-view character model reconstruction. In Pro-ceedings of the International Symposium on Sketch-Based
In-terfaces and Modeling (New York, NY, USA, 2013), SBIM ’13, ACM, pp. 5–14
Overall, the research in this thesis provides a number of important con-tributions to the field of visual style and automatic modelling.
1.4 Defining Style
to define the common terms used throughout this thesis.
The Oxford English Dictionary gives two definitions for style:
1. A way of painting, writing, composing, building, etc., characteristic of a particular period, place, person, or movement.
2. A distinctive appearance, typically determined by the principles ac-cording to which something is designed.
These both encompass a wide range of different ideas, and a more concise definition of style is needed. In fact, we want to separate the different types of style that we deal with in the thesis:
In this thesisVisual Stylerefers to the appearance of an object or drawing. Classified under the moniker of visual style are all components and visual features of the image that do not directly contribute to the substance of the image. More precisely, visual style indicates any and all properties of the image that can be changed in a consistent manner without affecting a viewer’s understanding of the image contents themselves. Examples are the type of drawing media, the stroke properties, or the colour palette.
Artistic Style is a subset of visual style, and encompasses image features that have been chosen specifically by and are unique to an artist or school of art. While the appearance of individual features may be shared between artists, the values of multiple features are often unique to an artist. As opposed to emotional style, artistic style is viewer independent and therefore a good candidate for algorithmic representation and manipulation. In the context of this research we focus upon individual artists, because schools of art for example, ”modernism” - are often too broad of a category to classify using statistical methods. It’s worth noting however that individual artists can drift or change their style over time, and in these cases the style may also become too broad to easily classify.
these features are independent of the artist and often occur in groups. ”Cute” or ”creepy” would be examples classifying these emotional style groups, al-though it is worth noting that emotional style classification is viewer depen-dant.
To measure style, an underlying representation must be used. While this is developed as a concept in Chapter 5, the following terms are used throughout the thesis.
A Feature is a meaningful or semantic part of an image. There is no set size, shape or classification, however a feature is always a subset of the object or scene being portrayed. Features have two functions, the first being its contribution to the object so as to increase detail and aid understanding, and the second being the contribution to the visual style of the image.
A Metric is the appearance or measurement of a feature that can be stored as a single, often scale-independent, value. Examples would be the angle of line curve or the size ratio of a Geon. Specifically, the use of ’metric’ in this thesis refers to the common use in Computer Science, where it refers to a measure of some property or specification.
Line Curve and lineCamber are often used interchangeably in literature, however in this thesis they are given distinct meanings. The line curve is a first-order metric, that is to say the average angle of a line defined in Equation 3.1; whilst the line camber is a second-order metric representing the rate of change of the line curve over its length.
1.5 Vector Notation
Single and double pipes are used to find length. This is the absolute value of a scalar and the length of a vector respectively:
|−2| = 2
k(←−−−3,−4)k = 5
The norm of a vector, or vector normalization, is represented by a hat and is performed as following:
ˆ v =
←−v kvk
In cases where this notation would be ambiguous due to formatting, single pipes around a vector term are used to denote the norm:
|v| = ˆv
1.6 Software Implementation
A number of software components were developed for the thesis, ranging from stand-alone programs to a full automatic modelling suite and toolset.
Substitution, Geon Extraction (Brute Force), Expansion & Smart Scaling, Colour Analysis, Artist Classification.
For the 3D components in Chapter 6, a different approach was taken. A single web interface was developed in Javascript and HTML5, using DAT.GUI and WebGL. Because the majority of algorithms are not designed to be in-teractive, the software has a broad array of initial setup and options, followed by a series of steps that can be run automatically or manually to allow the intermediate steps to be seen.
The use of javascript and run-time languages allowed faster and easier implementation of designed methods, and real-time interaction could be used to view changes and improve the methods. The Web interface is designed to allow easy distributed use within a studio or commercial environment.
1.7 Rationale
The aim of this research is to allow classification and replication of style. This has many applications, but due to its basis in an industry partnership through the New Zealand Foundation for Research Science and Technology (now the Ministry of Business, Innovation and Employment), this research focuses primarily on the digital entertainment industry. The ability to manipulate graphical content in new ways has the potential to save a large amount of effort in many projects, as well as opening up new possibilities for content presentation. Sections 1.7.1 to 1.7.3 show the motivation and need for this type of research.
Chapter 2 outlines some of the research that has already been done in this area, and what the authors of that research consider to be potential research targets and ideas for future work. While these give a good idea of knowledge lacking in the technical space, it is also important to ensure the research is solving problems that actually exist in the artistic space. The following section outlines some of the issues faced by content creators.
development cycles with small teams. Consistency within the team is rarely an issue, however content is often sourced from external locations. Providing tools to deal with artistic style will allow easier, faster and more coherent integration of generic art assets or user generated content.
The research in this thesis focuses primarily on the visual style of char-acters – including human forms, monsters, and anthropomorphic objects. While most of the methods can also be applied to other inputs, this focus is important for a number of reasons. Due to the lack of prior research, a con-strained input type provides the best balance between complexity and scope. A standard character is complex enough that the algorithms must be robust and flexible, yet constrained enough that it does not have to deal with input data with an unexpected or unknown context. Characters are usually at the forefront of the user experience in both computer games and animated movies, and provide a high impact for a small computational focus. The ubiquity of characters in animated media also offers a large dataset to draw from and analyse, in comparison to many other object classes. Finally, line style experiments in Chapter 3 found that characters displayed more stylis-tic variety and greater correspondence with unique artists than background objects did.
It is also worth noting that visual style in real-time media can have a significant impact on other areas of the production. In video games, art di-rection can influence the form of the gameplay [124] [63] and vice versa [171]. In animated films the visual style can be a feature of the narrative, or just as easily detract from it [73]. There has even been a case where the artist wanted to change the emotional impact by changing the style of an image while it was being viewed [154]. This introduces complexity to the problem of analysing and understanding visual style, as there may not always be a single technical or artistic reason underpinning it.
well as allowing for more than two stylistic states.
Overall, the ability to categorise and replicate visual style is an invaluable tool in a digital art creation pipeline.
1.7.1 Consistency
Project teams in the entertainment industry often reach into the hundreds of personnel, so that retaining stylistic consistency across all assets is difficult. Artists Hyung-Tae Kim and Saul Machese explain:
“
When we hire people, I try to recruit artists who naturally can understand and draw the kind of image I need. [...] I’ve had everyone practice drawing these characters and images in a certain style. [...] It’s all basically an attempt to maintain a consistent style.”
Hyung-Tae Kim - Lead Artist, Blade & Soul;NCSoft; 29-03-2010 [153]
“
When you have a large group of artists working on a game it can be difficult to achieve a consistent style.”
Saul Marchese - Lead Environment Artist;Climax Studios; 21-03-2007 [116]
into similar problems when outsourcing artwork to save himself time:
“
One time I actually hired some freelancers from India and Japan to color a test page to see if they could match my style and save me precious time. I gave them specific reference of how I wanted it to look and even examples of the color pallet. I even gave them my homemade texture files. When I got the pages back they looked ... well, lets just say I deleted the files even after revisions so that I wouldnt be influenced in any way by what I saw. Dont get me wrong, they did a great job coloring the pages but it wasnt right for my project.”
Jason Brubaker - Writer & Artist, reMIND;23-11-2009 [32]
In the study ’Visual-Style Variation as a Narrative Device in Animated Productions’ [73] a number of modern animated films were analysed for stylis-tic inconsistencies in their art content. Parstylis-ticularly, the study focused upon productions that used different visual styles within a single frame. It at-tempted to draw a link between theoretical cognitive frameworks in terms of an emotive or narrative context and the use of multiple visual styles. A number of features and shorts were analysed, and while in select cases stylis-tic inconsistencies were present for a narrative or storytelling purpose, the conclusion reached was that visual style variation in animated films is often due to technical limitations.
This paper is important because it supports a need for the research out-lined in this thesis. While style variation is desired in some contexts, Gupta found several cases where a technical limitation was the cause of visual style variation. If a technical solution existed to help develop style consistency, several of these media would better have achieved their aims. Gupta also per-forms a depth-first qualitative assessment, quoting several film directors and artists who desire visual style consistency in their work. These people and products would benefit from better style analysis and manipulation tools.
1.7.2 Concept Art
Stylistic inconsistencies can also manifest themselves indirectly. A common content creation pipeline for 3D media has several steps. Initial designs are created by concept artists in 2D, and then passed on to a 3D artist who creates the model. A texture artist paints the details onto the model and if the model is animated, a rigger sets up the internal skeleton and controls for the animator. All together half a dozen people may have influenced the style of the final model, creating a problem where the final 3D artwork often isn’t representative of the initial sketch.
In some cases, this is such a large problem that 3D is avoided altogether:
“
For example if you look at the Pokmon on the package you can really see how cool it looks as a 2D illustration and in the games [...]. If we were able to take that style we have now and have it translate into 3D with no problems; that is definitely something we would be into.”
Junichi Masuda - Producer, Pokmon Blackand White 2; 17-09-2012 [80]
In other cases, this extra workload means that turning 2d concept art into 3d models takes significantly longer than drawing the 2d art in the first place. When developing the Role Playing Game Torchlight, Jason Beck had to balance unique content against a tight schedule:
“
What’s the value in sacrificing our desires to do unique playable character meshes worth the simpler, more schedule-friendly approach? [...] We began to contemplate ways we could create unique meshes for our playable characters without a pipeline that would jeopardise our timetable.”
Jason Beck - Art Director, Runic Games;03-09-2009 [20]
1.7.3 User Generated Content
Rapid and automatic model creation processes are also important in the context of user generated content for video games. To cope with the large content workload and to accommodate user demands for more interaction, user generated content is playing a more important role in modern games. Current approaches to handling the wealth of new data involve numerous trade-offs, and tend to take two main approaches that are outlined below.
1.7.3.1 Free Content Generation
With free content generation, users are given tools that allow them to create whatever they want. Often external modelling packages can be used to export data into the game. Two major problems commonly arise with this method. If the player is not a technically trained game artist the resulting model is often not suitable for use in a real-time game engine. Linden Labs’ Second Life allows users to freely edit the world at any time, however this limits the amount of graphical optimisation that can be performed and there are many locations in the Second Life world where the game exhibits bad lag and stuttering. Second Life content creator Penny Patton explains:
“
Most of Second Life’s problems can be blamed entirely on this disconnect between Linden Lab’s development teams and the realities of how Second Life works. [...] Linden Lab bears the brunt of the responsibility here. They do absolutely nothing to prevent people from creating content this way.”
Penny Patton - Second Life content creator;28-02-2013 [146]
inte-grated into the game.
“
Through the use of standard third party art tools, [users] learn how to develop, design and personalise items of their own. [... They] submit it to SOE for review and possible inclusion in the SOE Market-place.”
Sony Online Entertainment; 2013 [1]1.7.3.2 Restricted Content Generation
One solution to these issues is to allow user content creation within a preset framework. Simple examples are changing the colour of the player’s clothing, and complex examples extend all the way to EA Games’Spore, where players have complete control over creature and structure creation at an abstract level but are limited at the technical level. This allows for a wide variety of content within the given aesthetic:
“
No matter how customised, the whole game has an inescapably Sporish look to it - and its bulbous, cartoony lines won’t be to all tastes - but that’s better than the hideous mishmash that would be born of total aesthetic freedom.”
Oli Welsh - Deputy Editor, EuroGamerMag-azine; 13-02-2008 [179]
This design restriction makes content creation easier for the players, but often means that the tool design is difficult. In the case of Spore, a large programming team was required to research new technologies to implement the system.
“
The editor was more of a design challenge - how do we make something that is as powerful as Maya, but that the average Sims player can use?”
Will Wright - Spore Lead Designer;Changing the visual style or allowing for different aesthetics within this framework requires additional work that the player cannot influence. In the case of Spore, EA Games released extra content packs such as the ’cute and creepy pack’ [2] that were developed by in-house artists. This gives the required level of control over the users interactions so that the produced content remains consistent. This was a concern toLittle Big Planet developer Media Molecule:
“
We wanted players to feel comfortable making constructions in the game, without being put off by talk of level editors and poly-counts. [... It was ] also a stylistic decision - However, we didnt want these avatars to exist as blank canvases; they still needed to live within the same stylised world.”
Rex Crowle - Art Designer, Media Molecule;01-01-2010 [49]
Chapter II
Background Research
2.1 Introduction
This section covers research relevant to the problem of quantifying visual style, covering visual perception and previous attempts at creating entire systems. Existing studies that concern only parts of the subsystem or tech-nical details are discussed in their respective chapters.
Traditionally, visual style research in computer science has fallen into two categories. One common area of research is the recognition of brush strokes and painting styles in traditional media, including methods to classify the renaissance masters [151]. This research rarely transfers across to different types of media. Another common research area is non-photo-realistic ren-dering techniques for 3D models, such as cell shading or pencil hatching [53]. Other papers approach the topic from a psychological perspective, exploring the cognitive processes our brains use in object and style recognition [141]. Little research appears to have been done regarding analysis of artistic style in non-traditional media, nor in regards to an artist’s overall visual style. In this section, the relationship between cognitive models and software systems is explored with the aim of better understanding of the state of the art as well as uncovering relevant and sound principles of cognitive perception upon which to base the research in this thesis.
2.2 Cognitive Approaches
re-mapping.
Palmeri & Gauthier [141] performed an extensive literature review of vi-sual object understanding, summarising and categorising 174 vivi-sual cognition research papers. They found two dominant schools of thought when it comes to designing a perception model: ‘Object Recognition’ and ‘Perceptual Cat-egorisation’. Whilst this paper does not primarily deal with visual style, performing any type of stylistic manipulation requires object recognition to be preserved.
On the other end of the spectrum, psychologists have tried to model the human understanding of art. Works in this area often focus on art as an object of appreciation and the characteristics most prominent in increasing its appeal. Several papers have performed empirical studies in this area, in-cluding Hagtvedt et al. in ‘The Perception and Evaluation of Visual Art’ [74] and the earlier ‘The Psychology of Art Appreciation’ by Funch [66]. These studies found that in general, viewers had distinct scales of appreciation for artistic merits and technical merits. This indicates that it should be possible to change the technical content of a drawing without influencing the viewer’s perception of the artistic components.
As outlined in ’Visual object understanding’ [141], Object Recognition theory assumes that the brain resembles a large database of stored images, from different angles and at different sizes. Recognition comes down to fast visual recall and indexing. On the other hand, Perceptual Categorisation asserts that recognition is achieved through calculation and associative de-cisions, matching the view of an object in a probability space with all other previously seen views of objects. The first stage of image translation and understanding in computer science is fundamentally one of recognition, and from a cognitive approach, one of perception.
(entry level) [50]. Making this link allows us to better understand the ad-vantages and disadad-vantages of each method by increasing the understanding behind how they actually work.
Perceptual Categorisation is farther explored in ‘Multidimensional Mod-els of Perception and Cognition’ [11] and attempts to produce digital modMod-els of this system are often implemented using Geons, small primitives that, combined with their spatial relationship, create a full image. This is a paral-lel to the described context-free image recognition, combined with contextual meta-data. Context free data can be transformed in subordinate style, but context is required to transform basic level style.
The relationship between context-free data structures and the ability to generate contextual information through programming was explored in ‘Structure vs. Style’ [76]. Often, context-free metrics cannot capture enough information to be useful, while contextual metrics are almost unexplored due to their overwhelming complexity. Jupp & Gero [94] attempt to tackle this complexity by implementing a categorisation system based upon self-organising maps (SOMs). The program operates at both the context-free level, via extracted features, and the context level through the SOMs.
Deciding upon which properties of an image are style-based metrics and which are related to the object contents is a difficult task. One approach is to look at how properties are processed by the human perception system, a research area covered by de Beeck et al. [52] who carried out empirical research to confirm theoretical models defining the boundary between shape dimensions. Category learning experiments showed that recognition of high-level objects could be trained, while low-high-level metrics remained independent. Similar results were found by Goldstone [70] who explored the development of high-level models from low-level components. This lends weight to the argu-ment that low-level metrics individually represent style, as changing these is independant and does not adversely affect recognition of higher-level objects.
when developing technical methods in the area of style and perception. While the contents seem too ill-defined to successfully draw parallels between the fields, the importance of using research from the cognitive sciences to sup-port technical developments is well communicated and has influenced the approach taken for many of the techniques outlined in this thesis.
Like Visual Explanations, the paper ‘Perception and Artistic Style’ [145] looks at the relationship between visual perception and traditional art. Parker & Deregowski allege that the fundamental visual processes, such as those out-lined by Ashby et al [11], contribute to and in some cases cause the major stylistic features in works of art. While compelling arguments are made for the strong link between technical perception and artistic style, the lack of quantifiable data to support the link would make it difficult to develop a software system based on these principles.
2.3 Shape Abstraction
These cognitive models are useful when considering papers such as ‘Abstrac-tion of 2D Shapes in Terms of Parts’ [122]. This research describes shape abstraction, ”using a new synthesis of holistic features” which creates sim-plified shapes that retain important features. The holistic features can be explained by the cognitive models which show the importance of corner-invariant detail scaling in relation to the perception of style. The ability of their algorithm to perform context-sensitive part division is important when considering the need for context when creating metrics for subordinate level manipulation of style.
then used to order a large series of input into a modular form, such as a 2D or 3D table. Each dimension represents a property of style and by interpolating or extrapolating on each continuum new style variants can be established. Although limited in scope the results are important because they show that it is possible to automatically separate style and substance with little overlap. This can be improved upon and is an essential step toward achieving the goal of stylistic manipulation.
Both Theobalt et al. [166] and Li et al. [107] present methods for decom-position of complex shapes. Although both have different target applications and apply primarily to 3D meshes, they each develop important structural representations of context.
While much of the literature around object categorisation is based around the idea of geons (defined features that have a spatial relationship to create an object) there are few papers that explore exactly what these features need to be. ‘The development of features in Object Concepts’ [148] looks at the relative importance of each geon within an object. It forms the hypothesis that different object categories have different orders of geon importance, and that geons differ in importance and form between people.
Hummel & Stankiewicz [85] explore a structural description model, where Geons within a shape are identified and stored in a relational pattern. This is implemented in MetriCat, a program designed to model the brain’s object classification approach. Whilst the program also models the debilitating factors our brain introduces into classification, it still proves categorisation via the use of shape abstraction is both possible and effective.
2.4 Statistical Classification
A brief study by Wayner [176] attempts to classify visual style using two descriptors; line length and line camber. It uses these descriptors to create a histogram of an image’s line length, and then match this histogram with a database of authors. It was found that using only a line length classification, 95% accuracy could be achieved in the categorisation of black and white cartoon strips between 7 authors.
This research is important because it shows, definitively, that it is pos-sible to mathematically classify and recognise artistic and visual style based upon simple metrics. Interestingly, the introduction to the paper mentions line camber and curve as classification descriptors. However, the algorithm showcased does not take curve into account, and there is no reference to this descriptor for the rest of the paper. Given a 95% accuracy rate with only one descriptor, this could potentially be increased dramatically with the inclusion of further descriptors.
There are also examples of research into style classification outside of the typical computer graphics arena. Fischer et al. [60] outline a system for classifying film genres based upon editing properties. Attributes such as the length between cuts, the type of camera movement, and the audio can be used to build templates that represent the editing style of each genre. It is interesting and important to note that many of the same underlying principles are used in regards to what makes a style metric and how the classification is performed. This is reinforced by the success of Tenenbaum & Freeman’s multi-use system [165] and suggests that the technical approach to style recognition remains roughly the same irrespective of the style content itself.
Zhang et al. [191] use shape metrics to extract ‘semantically meaningful layers’ from animated cartoon videos. Despite the claim that each layer represents a different motion style the result does not appear significantly different to standard segmentation techniques. This shows the difficulty of separating style from content, and highlights the necessity in both defining these terms and evaluating results in terms of the initial aims.
models to directly generate new Geon configurations that statistically match an existing dataset. The probability model uses relationships between prop-erties of shape components, and assumes that these are related to or caused by the underlying structure within the dataset. Variability within these prop-erties allows generation of new models, and it is this type of database and Geon approach that is taken in Chapter 5 to transform 2D images.
2.5 Animation Style
Chris Hecker [77] describes the procedural animation system used in the computer game Spore. This paper explores an animation system where the action is abstracted from the skeleton. It was found that categorising struc-tural components allowed for much better generalisation of the animation, something that standard animation re-mapping did not do well. Instead of directly re-mapping style, the ability to decompose style into a descriptive structure, and then re-generate the animation using the style descriptors meant that the final result could create context-sensitive actions. This may be necessary when performing style re-mapping, as illustrated with the issues encountered by Freeman et al. [64].
Chapter III
Line Style Verification
3.1 Introduction
Visual style analysis can happen at multiple levels. This thesis focuses pri-marily on high level style features, such as Characteristic Proportions in Chapter 5 and 3D shape in Chapter 6. However these high level features rely on accurate knowledge of low level features such as line properties, and knowledge of how these affect and interact with artistic style.
It is therefore important to explore and validate the results shown by some of the core research in this area. Studies by researchers Freeman et al. [64] and Hertzmann et al. [79] have outlined methods for style transformation at the line level. More importantly, research such as that by Wayner [176] shows that artist identification and categorisation can be performed reliably using only basic line metrics.
Two major verification steps have been performed that validate the results of these papers. This chapter explores stylistic categorisation based upon the properties of lines within an image, which is referred to as the line style. Section 5.9 confirms that stylistic categorisation can also be performed at a higher level by using Geons. The Geon system does not modify properties of the image relating to brush technique. Style perception by the viewer is a complex subject but is based in part on the line style and therefore in addition to Geon techniques, style translation needs to be performed at the line level.
Likewise, with artistic recognition, it should be possible to augment the recog-nition using line style metrics. To this end, a qualitative survey is performed to evaluate line style transfer.
Knowledge of line style was also important when developing the line ex-traction technique, Structural Vectorization, in Chapter 4. The line property research in this chapter is also used in Section 4.4 as the basis of intelligent line scaling.
3.2 Existing Studies
Two comprehensive papers describe techniques for the style translation of lines within 2D drawings.
In ’Learning Style Translation for the Lines of a Drawing’, Freeman et al. [64] outline two similar matching techniques used in transferring line style between a training data-set and a basic line drawing. Line style in this paper refers to the length, width, curvature and corner angles of vector line seg-ments within an image. The authors explore two methods for line-matching
the original drawing with the style database. This is done by comparing the drawn line with every line in the database using a custom matching algo-rithm. They found that the nearest-neighbour match produced the best style translation, but the image became distorted. A linear combination (using a least-squares matching) produced the best image translation, but the style does not transition well. Much of the paper is spent looking at these two methods, and introducing a k-N mapping where the nearest neighbour (N) algorithm is used first, and adjusted by the least-squares combination up to (k) number of lines. This produces a translation algorithm that preserves the image and the visual fidelity of the style.
curve’sinterest value, which is a combination of several line properties. More points cluster around end-points, corners and junctions, but are not exclu-sively restricted to these areas. This allows much better linear interpolation between two lines of similar shape, preserving the interest points.
In contrast to a database system, Hertzmann et al. [79] explore the cre-ation of ’curve analogies’. By using a texture-matching, scale and rotcre-ation invariant transform, their algorithm can analyse a single line, stroke, or im-age, and transfer the style properties from one drawing onto a second draw-ing. A major advancement shown in this paper is the ability to perform this transplant between two very different images.
While the paper talks about style in the context of visual style, this def-inition extends only as far as the shape variations within a single curve. It directly transplants the original image to the secondary image without concern for the underlying structure. This reduces algorithmic complexity, but means that extra drawing information is required for the original image. Two images (the drawing, and the underlying curve structure) are required instead of simply one. One issue not explored or explained in the paper is the case where no corresponding mapping can be found (i.e., the curve for one line cannot be found in the underlying structure of the other, and hence no segment can be found to perform the transfer).
Both papers successfully use re-mapping techniques, with manually cre-ated databases or input. The style mapping examples by Freeman et al. [64] are of high quality and show that this technique works well. However, the limitation of line style re-mapping shows in areas such as the human face where modifications are stylistically consistent, but create unrealistic facial features.
This research is important because it shows that it is possible to math-ematically classify and recognise artistic and visual style based upon simple metrics.
3.3 Categorisation
The Structural Vectorization process outlined in Chapter 4 is used to extract line information from source images. Basic line properties of width, length, and taper are measured. Additionally, the first and second order line angle properties (curve and camber, respectively) are recorded. Curve is measured according to Equation 3.1 which finds the average angle between adjacent points in a line segment. This equation depends on point density and can only be used to compare lines with the same density measure. The vectorization process used to generate the lines in this section produces results with the same densities, and therefore lines can be safely compared between images and artists. Camber represents the rate of change of the line curve over its length. Figure 3.1 shows two input images representative of the two artists analysed in this section. Ten images were analysed from each artist to give around 2,000 line segments. 17 outliers were manually removed and the resulting datapoints used produce the figures in this section.
The fairest method of comparison would be to use the same comic drawn by multiple artists. In practice, this is difficult to obtain because you need a large body of work. Therefore, the images in this section were selected as best as possible to have comparible content. They were selected from webcomics and cartoon strips with similar layouts. In addition, only object-internal measurements are saved, so there is no relation or influence from the background or surrounding objects. While this could potentially be an issue when looking at the visual style of entire scenes, the advantage is that it produces a fairer comparison between characters and objects within the strips.
c= π 2(n−1)
n−1
X
i=1
|(Vi−Vi−1)·(Vi+1−Vi)−1| (3.1)
(a) (b)
Figure 3.1: The two source images used in this section. Girls With Slingshots (a) is hand-drawn by Danielle Corsetto, while YodaBlog (b) is drawn digitally by Thierry Vivien
The statistical analysis by Wayner [176] used only one metric — line length — to classify images. This was successfully repeated with our source images and metrics recorded through the vectorization. Figure 3.2 shows the line lengths where the horizontal axis is the length as a proportion of the image and the vertical axis is the frequency. The difference can be clearly seen, with the lines used to draw YodaBlog consistently longer than those used to draw Girls with Slingshots. Wayner used line length to successfully classify images, and this would be possible in this case. However, there are several other line metrics that produce clearer distinctions between artists.
0 0.04 0.08 0.12 0.16 0.2 0
5 10 15 20 25 30 35
Curve Length
F
requency
[image:36.595.97.408.120.343.2](%)
Figure 3.2: This graph shows the distribution of line lengths in YodaBlog (orange) and Girls with Slingshots (blue). The horizontal axis is the length of the curve relative to image size, where 1 is the length of the image diagonal. The vertical axis shows the frequency of each length (at intervals measuring 2% of the image size).
artwork. This may be due to the artist using different pens or different drawing styles for different elements of the image. Categorisation using this metric is accurate in the case of these two cartoons because the line-width metric has less overlap than line length.
0 0.5 1 1.5 2 2.5 3 3.5 0
5 10 15 20 25
Curve Width (pixel)
F
requency
[image:37.595.118.425.120.345.2](%)
Figure 3.3: This graph shows the distribution of line width in YodaBlog (orange) and Girls with Slingshots (blue). The horizontal axis is the width of the curve in pixels and the vertical axis shows the frequency of each width (grouped to 0.2 pixels). Input image size was normalised before analysis.
widths means that automatic separation for artist classification using this metric would be difficult.
There are several distinguishing characteristics in this dataset worth not-ing. Both sets of image have numerous short lines, which is to be expected as these are fundamental in adding detail and form to any object. However, these short lines differ in their distribution. Below a width of 0.5 pixels the widths are stratified due to the vectorization algorithm and shows the need for a better sub-pixel algorithm for low resolution images. An improved vec-torization algorithm is outlined in Chapter 4. Above 0.5 pixels the line width in YodaBlog is more evenly distributed compared to Girls with Slingshots. This is likely to be a property of the visual style as explained for Figure 3.3.
0 10 20 30 40 50 60 70 80 90 0
0.5 1 1.5 2 2.5 3
Curve Length (pixel)
Curv
e
Width
[image:38.595.97.410.120.344.2](pixel)
Figure 3.4: This plot shows the width and length of individual line segments from YodaBlog (orange) and Girls with Slingshots (blue). The horizontal axis is the length of the curve in pixels and the vertical axis is the width in the same units. Input image size was normalised before analysis. The principal axis (best fit line) for each data source is shown in purple.
Figure 3.5 shows the line curvature, with the angle on the horizontal axis and frequency of occurrence on the vertical. Girls with Slingshots is charac-terised by sweeping curves, which can be seen in the high frequency of curves across the entire range of angles. YodaBlog has in comparison straighter lines with sharper corners, which is clearly reflected in the frequency spike at high angles. As with the line width and length metrics, this provides an opportunity for style recognition.
Data from the line taper showed no clear distinction between artists, primarily because both sets of images have lines with consistent thickness.
3.4 Transfer
0 0.2 0.4 0.6 0.8 1 1.2 1.4 1.6 1.8 0
0.05 0.1 0.15 0.2 0.25 0.3
Curve Angle (Radians)
F
requency
[image:39.595.117.435.116.345.2](%)
Figure 3.5: This graph shows the distribution of curvature in YodaBlog (or-ange) and Girls with Slingshots (blue). The horizontal axis is the average angle of curvature of each line segment in radians. The vertical axis shows the frequency of each angle (grouped to the nearest 0.2 radians). The orange line represents data from YodaBlog, whilst blue is Girls with Slingshots. The sharpest curves in each dataset are 1.2 and 1.6 radians respectively.
the style of an existing image.
A manually-assisted approach is taken to perform line style transfer. An approach is taken based in part upon the database system outlined by Free-man, and the idea of replacing line properties in-place outlined by Hertz-mann. The mechanics of the algorithm are simple. First a target dataset is created from the property distribution histogram with the number of points matching the number of line segments in the source image. The contents of this dataset now contain a set of widths and curve angles that represent the average target image. Lines in the source image are iteratively changed to match the target dataset, starting with the values that have highest spread as these are less likely to find exact matches. A visualisation of this process is shown using a single metric (size) and simplified images in Figure 3.6.
(a)
(b)
(f)
(c)
(d)
source target 0.1 0.1 0.2 0.1 0.3 0.1 0.4 0.1 0.5 0.6 0.6 0.6
(e)
Figure 3.6: A simplified example showing style transfer with a single metric, the size of the square. The source image (a) and a number of target images represented by (b) are used to create frequency charts (c) and (d) respectively. Table (e) shows all size values for the input, and the corresponding target metrics selected from (d). The result (f) retains the image layout but better reflects the spread of sizes in the target style.
gives for example in Figure 3.6(d) 4 points at 0.1 and 2 points at 0.6. For each datapoint the untransformed source metric closest to the target value is selected and assigned the target datapoint. This works well because it preserves relative changes. For example, a line that is more heavily curved in relation to a second line will always remain more curved, even while the global distribution of line curvature is changed.
value=ct
f cs
(3.2)
where f is the frequency, cs and ct are the number of measurements in the
source image and target datasets respectively.
the characters’ sweater in Figure 3.8(c) where the horizontal pattern is mis-aligned. Small gaps and overlaps can also be seen around the forehead and the arms. This is a common problem and is addressed in Chapter 4.4 with the smart scale technique. This preserves detail ratios and line connections while changing line curvature. Line width is easily changed and presents fewer problems, while line camber is not adjusted in this trial.
Additionally in this trail the number of lines in the source image is reduced to match the average in the target images. YodaBlog has significantly less detail than Girls with Slingshots, and this is reflected in the transformed image as the smaller and assumedly less important lines are removed from the input. This works well in the case of the sweater, although causes issues such as around the underarm where line segments are small yet important. Note that this detail reduction would however be difficult to do in reverse if transferring style from Girls with Slingshots to YodaBlog.
(a) (b)
Figure 3.7: The input image (a) from Girls with Slingshots, and an an ex-ample (b) from YodaBlog of the target style.
intervention to fix small alignment issues and ensure line intersection points are correctly labelled. Colours and shading are ignored, and caption text is removed as vectorizing letters creates a style bias and font style translation would require a different approach.
An important point to note is that this transfer is the best alternative of two different approaches, and doesn’t always perform well. Changing line curvature without changing the end points guarantees a correct topology but can disrupt the structure. This was found to perform better than guaran-teeing structure without topology because while each individual part may overlap, the lines are still joined at corners and present a more cohesive picture.
(a) (b) (c)
Figure 3.8: A vectorized version (a) of a character from Girls With Slingshots is divided (b) into segments and has its line curvature changed (c) in an attempt to match that of YodaBlog.
Figure 3.8 (a) shows the vectorized input image, with Figure 3.8 (b) showing the adjusted points that denote line segments. Style translation is performed by changing the distribution of line properties in the source image to equal that of the target style. Because the source image is in a vector format and lines can be represented as spline segments, both the curvature and the width of lines in the image can be easily changed.
YodaBlog. The images in Girls With Slingshots have flowing curves, while YodaBlog has sharper curves and this is most clearly illustrated in the head where the character’s hairstyle now matches that of YodaBlog characters (the hood and the yoda ears).
3.5 Conclusion
The evaluation performed in this section successfully supports the findings of previous researchers. Line style differs between artists, and this property can be both measured and adjusted.
The statistical analysis by Wayner [176] was successfully reproduced, with the distribution of measured line length in a drawing proving to be different between artists and a valid statistic to classify images. Further statistics were evaluated and similar results found in line width as well as curvature. A clear relationship was found between line width and length, with specific characteristics distinguishing each artist. At higher line lengths and widths there is also an obvious stylistic choice that separates artists. Because of this clear distinction, a grouping algorithm such as k-means clustering can be used to categorise images by artist based purely on these two metrics.
Moreover, these distributions are representative of the artistic style and not of the content of the image. When multiple images from the same artist were analysed, the histogram remained similar in each case. An unexpected feature in the analysis was the ability to also make educated guesses about an artist’s drawing media.
With the successful categorisation of artistic style based upon line metrics, modification of line properties was attempted based on these statistics. The qualitative survey performed showed a significant style change was possible. The resulting image contains clearly the same content, yet the lines reflected the nature of the target image.
work as well or at all. To perform a wider ranging survey would require analysis of a high numbers of images and therefore the algorithm would have to be made completely automatic, a research topic that lies outside the scope of this thesis.
Chapter IV
Structural Vectorization
4.1 Introduction
Traditionally, image analysis is performed on raster images based upon global or local features. However some types of algorithm such as the style and stroke analysis outlined in Chapter 3 perform better or must be performed on vector data. Vector data always contains a line topology made from line position and connectivity data, and may also include width, colour, and border properties. While modern tools allow rapid drawing directly into vector formats, many artists and studios still use raster images for cartoon work. Additionally, older artwork only exists in raster format, which must be vectorized before it can be used. Storing image data in a vector format has the added benefit that it is highly efficient in comparison to the source image.
The fidelity of the extracted lines has a direct bearing on the quality of the operations that can be performed using the vector data. When approaching line style evaluation in Chapter 3 several existing vectorization approaches were tried, however difficulties extracting the required data and accuracy problems at low resolutions meant that none of these were ideal. Due to this lack of existing solutions, this chapter deals with the improvement of line-data extraction algorithms.
Figure 4.1: Structural vectorization is performed on the original image (left), with the result (right) showing the image represented as lines of varying width. This structural representation trades loss of visual fidelity with ease of processing due to the clearly defined structure. The loss of visual fidelity is acceptable when performing operations that rely on topological or other structural information.
vector data is unsuitable for.
The Structural Vectorization method outlined in Section 4.2.2 is compu-tationally expensive, but extracts line centres even if the line has an irregular profile or the image has unusual topology.
4.2 Existing Studies
Vectorization is a common analysis problem, and many solutions exist. Early research focused primarily on CAD and technical drawings, while later vec-torization techniques have been tailored to handwriting recognition, skele-tonisation, and more recently digitisation of older artwork. Skeleton data was seen as a better storage format than raster images as early as 1987 [115].
segmentation and image complexity reduction. However, both papers require even line widths and must be tuned for specific line profiles. Hand-drawn cartoon input rarely has even line widths, and so any vectorization algorithm must cope with width variation.
Research released by Huang et al. [84] presents a stroke extraction algo-rithm that does not rely on even line widths. They provide a robust stroke extraction algorithm but unfortunately stop short of vectorization. Our focus upon cartoon imagery means that source imagery already has clearly defined strokes, and unless the range of input images is extended, stroke extraction is not needed. Recent advances by Noris et al. [133] also solve the width variation problem by using gradient-based pixel clustering. As opposed to Cheng and Zhang, the input must be a clean mid- to high-resolution line image, as lower resolutions don’t provide adequate data. A maximum line width is however established to ensure correct joint detection, and so this method does not work for blocks of colour or uncharacteristically wide lines. While the vectorization in this chapter is required to work on low-resolution inputs, the junction-detection techniques in this paper could be incorporated in the algorithm design to better cope with line splits and areas where the lines are ill defined.
As opposed to Huang et al. the research by Houle et al. [82] uses an adapted Freeman Chain to group sections into strokes after vectorization of handwriting. The final strokes have no width data, however this is used as an intermediate step and could potentially be extracted. Zhen et al. [193] also tackle the problem of separating individual pen strokes. Their successful results were enabled by limiting the problem domain to sketched tree and flow diagrams. Given that Structural Vectorization is designed primarily for stylistic manipulation of character artwork, it may be possible to use properties unique to this problem domain to increase the accuracy of the results.
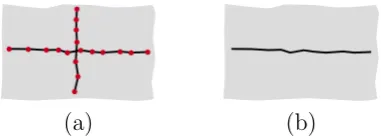
infor-(a) (b) (c)
Figure 4.2: Morphological skletonization operators such as the medial axis transform provide a geometric decomposition (b) of a shape that even when thinned does not always represent the human recognised structure the pro-posed algorithm extracts (c).
mation. These are the two of the most important properties an algorithm requires when processing line style.
In addition to stoke extraction and recognition, many morphological and topological skeletonisation algorithms exist that produce outputs ranging from unconnected point clouds [56] toβ-skeletons [15] that contain the topol-ogy in a connected graph. An algorithm tailored to visual style features should reach a compromise that allows for disconnected elements but strives to join line vertices when possible.
Medial transforms are perhaps the most well established method for skele-tonisation, having been proposed in 1967 [27] and tweaked in various different ways up until the present [103] [126] to solve problems such as the influence of surface noise on branching. Another method with the same result but a different approach is joining the centres of bi-tangent circles or maximal discs within a shape [10]. The medial transform produces geometric skele-tons, however as can be seen in Figure 4.2 even simple shapes can produce a skeleton that does not correspond logically to the underlying structure.
of thinning algorithms are explored by Lam et al. [104] and given that many produce the same results this is a good source for locating simple and effec-tive approaches to problems such as vector creation from centrepoints and junction pruning.
This problem arises even when different approaches are taken [118], while papers that retrieve a clean structural topology do so by limiting images to a specific domain such as handwriting recognition [99]. In addition, Lam, Lee & Suen found that most skeletonisation algorithms do not store width or colour data [104].
High quality vectorization that aims to produce images identical to the input. These often use colour fields or large number of vector patches. Bat-tiato et al. [18] present a technique to convert raster images into a vector format using Data Dependent Triangulation (DDT). DDT approximates lo-cal pixel neighbourhoods by subdividing them into a grid represented by relative triangulation. Xia et al. [185] also use triangulation but allow a greater flexibility in patch size to represent underlying gradients. These high quality methods focus primarily on photorealism, and while they produce reasonable results for monochrome line drawings the data format is not easy to parse for object and line understanding.
Orzan et al. [137] introduce image partitioning diffusion curves, a vector-ization technique that stores different colours on both sides of the curve. In the work, they also describe an algorithm for automatically extracting this representation from a raster image. Much like the triangulation technique described by Xia et al, this extraction technique relies on Canny edge detec-tion and therefore does not work well at small scales and pixel-width lines. Another argument against vision techniques can be inferred from the results by Nguyen et al. [131] who test six popular robotics and vision algorithms for line detection on real-world data. The data is low resolution and noisy, and the results are significantly less accurate than other vectorization techniques evaluated in this section while also lacking any underlying vector data. When developing the vectorization technique outlined in this section, pixel-based vision techniques were avoided and sub-pixel detection techniques explored in greater depth.
outlined by Williams & Green [181] due to the stroke-extraction algorithm, which is based on a triangle-area heuristic. This is mathematically equivalent to the distance-angle metric outlined in this chapter and while the thresholds are calculated differently Williams’ comments in Section III C on improving accuracy and limitations through tuning the Cost Functions were applicable to this system.
One approach to low-resolution vectorization is to bypass the line extrac-tion process and produce a cell-based vector image from the input. Numerous systems have been implemented and improved over time, including Veroni-based solutions and the pixel table look-up system hq4x [157]. A system with high quality results was outlined in ’Depixelizing Pixel Art’ by Kopf, J and Lischinski, D [102] which modifys Veroni cells based upon a number of heuristics. This type of post-processing makes a large difference in the final result, and in the context of line-based extraction it is possible that existing research could be improved solely through a post-processing step if viable heuristics are found. A cell-based system however is infeasible for Struc-tural Vectorization as it does not support the main aim of creating easily understandable data.
Steger [156] outlines a subpixel line detection algorithm for use in aerial photography annotation. The technique is primarily designed for identify-ing borders between different coloured and textured segments, however the subpixel techniques used could potentially be modified to find centrelines in strokes, and outlined techniques such as subpixel stroke biasing could be ap-plied to centreline realignment. Many of the subpixel issues identified in this paper will need to be considered and addressed when designing any future sub-pixel vectorization algorithm.
complex shapes can be found in Active Shape Models [45] [46] [25], and the more advanced Active Appearance Models [44]. These are both based on the principles of Active Contours, and require a manually defined vec-tor template as well as a training step to initialize the template difference tolerances. However, the idea of using morphological gradients to increase accuracy was key to developing the gradient fields used in this chapter.
A more mathematical approach to the vectorization problem was taken by Lin et al. [109] who outline a B-spline fitting algorithm that runs on extracted point-cloud data. A series of rectangles are constructed subdividing the point cloud, with each one containing a spline representing the centreline of the underlying data. While the accuracy of this method is high it does not cope well with line junctions, although the results can be improved by combining line fitting with corner detection [100].
After vectorization, the data must be stored in a form that can be parsed for image reconstruction, the accuracy of the reconstruction is a good in-dicator of the quality of the vectorization. Mestetskii, L [121]. outlines a mathematical representation of so-called ”fat curves” and a rendering tech-nique for converting this to a raster display using a series of positioned discs. Structural Vectorization contains similar data and these techniques were a basis for the reconstruction techniques used in this chapter, substituting the discs with linear cross-sections to be able to better represent sharp corners.
The method outlined in this chapter is computationally expensive, but finds line centres accurately even if the line has an irregular profile and vary-ing width. It is designed primarily for low to medium resolution images and produces usable results for a wide range of input, from long and thin lines to lines that have almost the same width and length.
4.2.1 Thick Line Vectorization
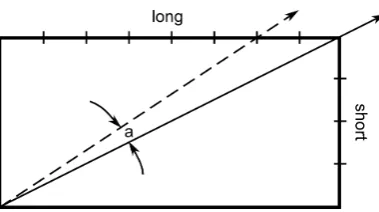
0.3 0.4 0.5 0.6 0
0.2 0.4 0.6 0.8 1
distance along v
pixel
in
tensit
y
(a) (b)
Figure 4.3: Finding a line centre for use in vectorization. Diagram (a) shows how a vector (v) is drawn between each pixel and the closest line edge, after which the intensity values along the vector (b) are used to find the line centre to a sub-pixel accuracy.
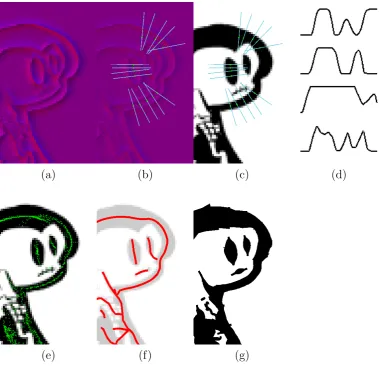
research are those that can subdivide strokes. While most line extraction methods use pixel filters and similar techniques, Huang et al. [84] use a type of circular mask that collects clouds of line centrepoints that can be more easily vectorized. This section is based on their approach.
The circular mask method uses a pixel search algorithm to find points that lie in the middle of the lines. Each point has an associated direction, which is used to recreate the strokes. Additional processing, such as projected rays or angle comparisons, can be used to find sharp corners and junctions.
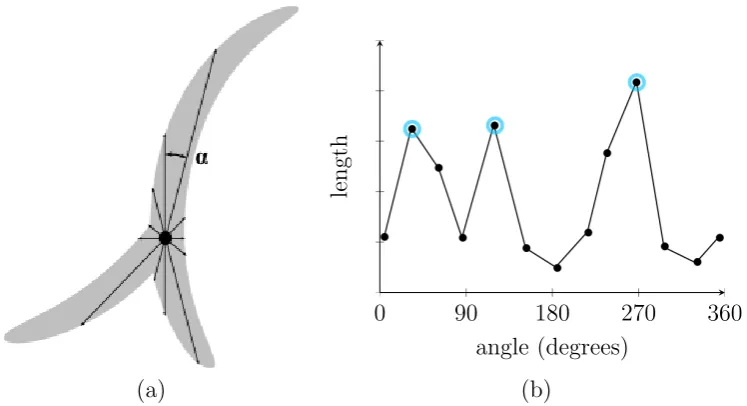
0 90 180 270 360 angle (degrees)
length
[image:53.595.116.490.117.320.2](a) (b)
Figure 4.4: Finding line connectivity information via centrepoint projection. Internal line distances are measured outwards from the centrepoint (a) and plotted by length and angle. The number of descrete maxima (b) show the directions and number of connecting lines.
This normal does not always fall at right angles to the line tangent, which is important later in the process because it results in point clusters with wide angle spreads. This aids continuity when converting to splines.
Finding the centre of the line is possible by using the line normal. Fig-ure 4.3(b) shows a graph of the image intensity along the length of the inter-secting normal. An intensity threshold of 50% is chosen and the centrepoint calculated to be the average of the crossing points. The high number of cre-ated points functions as an antialiasing method because the centrepoints are not aligned to the pixel grid. The width data can also be recorded at this point, calculated as the distance between the crossing points. An additional line property is also the ’definition’ or ’clarity’ of the line. If the line has fuzzy edges and blends with the background, then the cross-section will be round, whereas a well-defined black line on a white background will have an almost square cross-section.


![Figure 4.15: Principally designed for organic and cartoon images, structuralvectorization can also be applied to architectural or engineering drawings (a).Compared with a basic line-based vectorization method (b) [55], structuralvectorization produces comparable structural data (c), and performs betteron curved lines (d).](https://thumb-us.123doks.com/thumbv2/123dok_us/9967973.497720/67.595.120.498.123.353/principally-structuralvectorization-architectural-engineering-vectorization-structuralvectorization-comparable-structural.webp)
