The Effect of unrecognized pension items
on the Company’s Stock Returns
Author: Philipp Zieglowski
University of Twente P.O. Box 217, 7500AE EnschedeThe Netherlands
[email protected]
ABSTRACT:
This paper argues whether the market fully reflects the effect of unrecognized pension related items. Using a large sample of US companies where pension obligations are essentially underfunded. If the unrecognized pension obligation is not correctly incorporated into the share price, the stock return will be lower than those of companies with a healthier pension scheme, due to the fact that this pension deficit will affect the company’s income statement in the coming years. I find that companies with large unrecognized pension obligations earn lower risk adjusted returns. This evidence suggests that the market not fully reflect all pension related items when valuing the share price. Further, investors do not anticipate the effect of unrecognized pension items on future earnings.
Supervisors: Dr. Xiaohong Huang, Henry van Beusichem, Dr. Rez Kabir
Keywords
Unrecognized pension asset, pension benefit obligation, accrued pension cost, FASB 87, mispricing, stock return
Permission to make digital or hard copies of all or part of this work for personal or classroom use is granted without fee provided that copies are not made or distributed for profit or commercial advantage and that copies bear this notice and the full citation on the first page. To copy otherwise, or republish, to post on servers or to redistribute to lists, requires prior specific permission and/or a fee.
3rd IBA Bachelor Thesis Conference, July 3rd, 2014, Enschede, The Netherlands.
1.
INTRODUCTION
We live in a world with permanent changes and challenges, from global warming to terrorism. But nothing is as certain as the global aging of the population and nothing has such a strong impact on sustainability and the economy. Pension planning has therefore been an important issue of discussion. Policy makers as well as private citizens are concerned with the sustainability of pension benefits for the coming years.
Referring on the capital market crisis of recentyears, the pension funds of many companies have generated severe losses. Hence, as the companies have merely undertaken to contribute routine payments into a scheme for the benefit of pension retirements, stated defined-contribution pension schemes, these losses are at the expense of the benefit recipient. However, when pension funds are used to provide extend financing for defined future benefits, stated defined-benefit pension schemes, any deficits are carried by the companies. If the pension fund performs badly and does not hold sufficient assets to cover the pension obligations, the company is responsible to pay additional funds.
If a company sponsors a defined benefit pension scheme, it has to ensure that employees get their retirement benefit and make financial contributions to pension funds1. The present discount value of all future obligations is merely a gross liability for the sponsoring company, in which the company has to perform the retirement benefit for the employees until they reach retirement age. A net liability for the sponsoring company occurs when there is a difference between the present value of obligations and the market value of the assigned asset. This net liability is an expense in the company income statement which is realized in the coming years. A pension funding deficiency, also called a pension funding deficit, means that the funds projected to be available in the future are less than the promised pension payments of retirees. This often generate due to a decline in market value of pension assets as well as a decrease in the rate at which future obligations are discounted, which leads to an increase in the obligations. Nonetheless, the most decisive aspect is an increase in retirement benefit by virtue of a modification to the pension scheme.
These deficits induce the companies to pay extra contributions. If the present value of these obligations exceeds the market value of the assets, the fund is said to be underfunded. An underfunded pension fund therefore is an additional burden on the company, since it has to restore the balance between assets and obligations and so unexpected contributions. Rauh (2006) find evidence that these unexpected contributions along with the expected contribution costs therefore increase the actual costs a company must bear. This effectively reduces the available cash flows, which further has an impact on investment and ultimately the company’s stock price.
1
investment fund within the Pension Scheme which is intended to accumulate during an individual working life from contributions and investment income, with the intention of providing income in retirement from the purchase of an annuity or in the form of a programmed withdrawal, with the possible option of an additional tax free cash lump sum being paid to the individual
Regarding to the accounting standard for the retirement benefits for employees in the US, as well as FAS 87 under U.S. GAAP, a company with a net pension liability can shift its recognition of the deficit in pension obligation to moderate the expense of the pension plan deficit. In other words, if a company has a net pension liability, the sponsoring company is required to offset the deficit over a period between 3-5 years after its emergence, whereas the amount of unrecognized pension obligation is mentioned in the footnotes as unrecognized pension obligation. It is notable that the discretion according to which the company may decide the amount of the amortization as well as the contribution to the scheme, along with the complex set of accounting and fiscal regulations, makes the effect of the pension liability difficult to calculate. However, after the first determination of the deficit in the pension obligation, only a specific amount of that deficit emerges on the balance sheet as well as the income statement.
If investors take into account the effect of unrecognized pension obligations when valuing company’s stock price depends on the interest from the perspective of efficient allocation of resources due to the capital market. If the market fails to completely reflect the effect of pension deficits, the stock prices as well as the company’s value with unrecognized deficits would be overvalued. Due to this failure, the sponsoring company might benefit from these mispricing in order to raise funds at a lower cost of capital.
In extending the analysis of Franzoni and Marin (2006), I divide unfunded pension liabilities into two parts; those which are still recognized on the income statement and those which are still unrecognized in order to examine the effect of unrecognized pension obligations and their impact on the capital market. In addition, it facilitates to disclose whether the market efficiency is neglect by the management discretion of sponsoring companies over the disclosure requirements of pension-related items. If the market does not take into consideration the underfunded liability correctly, the sponsoring company may raise funds at lower cost of capital due to the shift of the recognition of the underfunded pension deficit. As a consequence, this leads to an inefficient allocation of financial resources, thus to a mispricing of the stock price.
In order to understand the effect of additional required funds on corporate pension plan, this research paper aims to expose to what extend does the market fully reflect the information given in the footnotes and if the unrecognized pension items have a significant effect on the stock returns.
2
2.
RELATED LITERATURE
2.1. The institutional background for pension
accounting standard
In December 1985, the Statement of Financial Accounting Standards No. 87 (SFAS 87), Employers’ Accounting for Pensions required that pension cost is made up of several components including Service cost, Interest cost, Expected return on pension investments, Amortization of unrecognized gains and losses, amortization of unrecognized prior service cost and amortization of transition asset or liability.
Figure 1. Diagram of pension expense calculation
Pension expense reported in the income statement consists of:
Service cost is the value of pension benefits that employees will earn during the current year
The interest cost is the increase in the present value of pension benefits that scheme participants have earned in previous years The expected return on plan asset is the investment earnings on the pension plan asset that are expected to be earned during the year
The amortization and deferred of gains and losses is the recognition of cost/income from experience that differs from the assumptions (e.g. earnings from investments are different than actually assumed).
Amortization of prior service costs is the recognition of the cost of benefit amendments the plan sponsor provides for service the employees have already performed.
Amortization of transition asset or liability is the remaining net transition obligation (asset) after the event is to be amortized over the balance of the initial amortization period.
FASB87 requires for the additional minimum pension liability that every balance sheet dates, company must compute their accumulated benefit obligation (ABO) and the market value of pension plan assets. If the pension plan assets are greater than the accumulated benefit obligation, no balance sheet entries are required (the overfunded portion of pension schemes are not recognized as an asset on the balance sheet). If the ABO exceeds the value of pension plan assets, the difference must appear on the balance sheet as an additional unfunded pension liability. The smaller liability represents the degree of underfunding that would exist if the pension scheme were terminated. In addition, FASB 87 specifies that offsetting debits take place in to potentially accounts. First, the intangible pension asset is the account equal to the lesser of either the unfunded pension liability or the unrecognized past service liabilities. Second, the pension charge to shareholders’ equity if the account (which is negative equity account) will be the additional necessary debit/expense required to balance the
journal entry if the unfunded pension liability account exceeds the company’s unrecognized past service liabilities.
[image:3.595.312.530.216.396.2]The reason the intangible asset can be equal to the unrecognized prior service Liability is that the FASB did not want to sentence companies for improving or starting a pension plan. Since FASB 87 requires unrecognized prior service liabilities to be written off over the remaining service life of the employees anyway, there is no need to further sentence a company for having such liabilities. If the underfunding is due to factors other than the existence or prior service liabilities the FASB 87 believed that some punishments should be attached because such shortfalls are caused by underfunding the pension fund or by poor investment performance.
Figure 2. Diagram of pension liabilities
The underlying accounting theory for postretirement benefits changed essentially when the FASB 87 was introduced in 1985. The recognition, measurement, and reporting rules for defined benefit pension plans required in these standards applied accrual basis of accounting when recognizing and measuring the expenses, assets, and liabilities of pension plan. Soroosh and Espahbodi (2007) emphasize that while SFAS 87 required the recognition of pension expense in the income statement, the information underlying that amount was required to be disclosed in the footnotes and not reported in the financial statements. This major change in accounting practice served more useful information to the financial statement analysts. While the FASB 87 recognized that relevant information such as the fair value of plan assets and liabilities were concealed in the footnotes, it decided that entire financial statement
recognition would be too extreme. This lack of entire disclosure led to a lack of transparency concerning the funded status of the plans. Miller and Bahnson (2007) found evidence that this effect became clear when several large bankruptcies earlier this decade demonstrated that the Pension Benefit Guaranty Corporation did not have the needful to cover the deficits in plans.
be lower. This will result in lower funding of the plan. The company is also responsible for estimating the expected return on plan assets. Based on the investment strategy of the plan, the company must examine what long term yield these assets will provide. The higher the expected yield, the less the company will be required to contribute to the plan. Catlin (2004) found evidence that this can also result in underfunding a defined benefit pension plan. Both of these estimates are at risk of manipulation by the company.
However, a shortfall in SFAS 87 is the offsetting of plan assets and liabilities. Soroosh and Espahbody (2007) proved that this process allows the value of the plan assets to be reduced by the liabilities of the plan and shown in the footnotes of the balance sheet as a net number. There is no other asset category on the balance sheet that is shown net of its related liability.
2.2
Share price and unfunded pension liabilities
Companies with defined benefit pension plans must register the amortization of unrecognized pension deficits as well as the current liabilities cost of the pension plan obligation. In the US, according to the account standard for employees’ retirement benefits (FAS 87), companies have to follow regulations with defined benefit pension plans as follows. If the accumulated benefit obligation exceeds the fair value of plan assets, the employer shall recognize in the statement of financial position a liability (including unfunded accrued pension cost) that is at least equal to the unfunded accumulated benefit obligation.
A company with a defined benefit pension plan has to calculate the present value of the future pension benefit obligation. If a company has a deficit, it has to mention it on the balance sheet as liability. However, FAS 87 permits that the effects of certain events, such as plan amendments or actuarial gains and losses, were granted delayed balance-sheet recognition. As a result, a plan’s funded status was rarely reported on the balance sheet and only in footnotes in which the market as well as investors see less attention than on the balance sheet and income statement.
If an investor would directly recognize such pension deficit, it would not has an effect on the future stock return because the increase of in companies net periodic pension cost would compensate a decrease the future net periodic cost. Hence if the market would directly recognize an inequality in the net periodic pension cost, there would be not stock price influence of the company. Conversely, if the market would not recognize such an inequality, pension plans would be overvalued according to companies with a pension plan where no deficit exists. According to this Chen, Yao, Yu and Zhang (2014) also find evidence that the pension underfunding has a negative effect on future earnings. Analysts as well as investors underreact to such information in their forecast. Furthermore analyst learning and incentives mutually reduce stock market mispricing regarding to corporate pension underfunding. In addition, Sloan (1996) emphasizes that the persistent
performance of earnings is driven by the relative dimension of the cash and accrual components of earnings. The stock price is depends on the misinterpretation of the two aforementioned components of earnings by investors. Therefore, the market might neglect detailed information that enters in the footnotes, and companies with underfunded pension plans.
As a result, it is very difficult for investors to grasp all the scheme of the pension accounting standard and the background of pension plans. Due to the fact that the pension accounting rule is too complex for almost all investors, the broad discretion of management decision towards the amount of amortization of deficit in every year and the discount rate underlying present value of future obligations makes it almost impossible for
managers. Furthermore, if there would be more adequate information on pension finances footnotes, investors might be understand and avoid mispricing in order to calculate the stock price more efficient (Coronado, Mitchell, Sharpe and Nesbitt, 2008).
Therefore such misinterpretation plays the most important role of overvaluation of underfunded companies and mispricing of their stock returns.
2.3 EARLIER STUDIES
Many studies examine if the market fully reflect pension-related items that are mentioned in footnotes into the calculation of the stock returns.
Fledstein und Seligman (1981) and Bulow, Morck, Summers (1987) find evidence that the equity market valuation of companies take into consideration the difference between the value of pension plan assets and its liabilities which means that the company value if the pension has a surplus or deficit. Jeremy, Lawrence and Lawrence (1987) also find evidence that investors don’t ignore pension liabilities in valuing companies. In addition, corporate managers will benefit if they fund their plans as fully as possible.
Similarly, Feldstein and Seligmann (1981) insist that the stock prices entirely reflect the value of unfunded pension obligations. The main implication of the stock price response is that the existence of unfunded private pension liabilities does not essentially entail a reduction in total private saving. Since the pension liability reduces the equity value of the firm, shareholders are responsible for maintaining their existence and an incentive to save more themselves. In addition, Feldstein & Seligman (1981) notice that “One potential explanation of such apparently irrational behavior by firms is that they believe that the securities market is irrational: i.e., those investors would recognize debt that appears on the balance sheet but not the unfunded pension liabilities. If that were true, it would be in the interest of current shareholders to leave the pension liability unfunded”. However, Jin, Merton, & Bodie (2006) find evidence that the stock market seems to reflect the available pension information without bias despite the practical difficulties of intricate corporate pension accounts, hence abnormal risk-adjusted returns don’t occur for companies with unrecognized pension deficits due to the fact that the market take into consideration all relevant pension-related items.
On the contrary, many studies claim that investors neglect pension-related items that are mentioned in footnotes and so the market doesn’t reflect all pension-related items in order to calculate the stock returns.
Franzoni and Marin (2006) insist that the market fails to recognize the effect of pension deficits and that surprises occur when the effect of the deficits finally published on the income statement. In addition, they find evidence that the inclusion of the momentum factor2, implying that the mispricing’s associated with pension-related items exist even after the price momentum factor is controlled.
Feldstein und Seligman (1981), Feldstein und Morck (1938) and Bulow, Morck and Summers (1987) claim that the market reflect all pension-related items but nevertheless there exist mispricing which infringe market efficiency. Therefore, it is virtually impossible for investors to value the share price correct due to the fact that pension-related items are only
2
4 mention in footnotes and investors neglect that kind of
information. As a result, the market fails to correctly price the effect of current pension deficits. Especially, Feldstein und Morck (1983) find evidence that the market take into consideration the difference in the discount rate when calculating the present value of future obligations, which convey a higher level of rationality among investors. Nevertheless, even though the discount rate is taken into consideration, it doesn’t change the fact that investors with high level of rationality still neglect the pension-related items which are responsible for the abnormal risk-adjusted returns. Furthermore, Nakajima and Sasaki (2010) find evidence that companies with large unrecognized pension obligations earn lower risk-adjusted returns, hence the markets does not efficiently reflect all pension-related items which are disclosed in the footnotes.Franzoni and Marin (2006) emphasize the overvaluation of companies by investors due to the fact that companies have unrecognized large deficits on their defined benefit plans and earn lower returns when the negative implications related to underfunding status actually materializes on their income or cash flow statement. Franzoni (2009) mention that mandatory contributions to defined benefit plans are linked with negative stock returns. It is notable that these negative stock returns are reinforced due to financing constraints, which reflects the argument of Rauh (2006) that mandatory contributions compound underinvestment.
Castro-González (2011) and Franzoni and Marín (2006) results insist that the market inefficiently incorporates defined benefit pension plan information when disclosed in the footnotes to the financial statements
.
There has long been an important disconnect between the financial impact of a company’s defined benefit pension plan implied by accounting accruals, and the information disclosed in the financial footnotes. Coronado at al. (2008) results suggest that investors still do not correctly perceive how defined benefit pension plans influence corporate valuation. As a result, over the past decade, pension accruals embedded in the financial statements have been particularly poor stand-ins for pension value. Indeed, there were many years when they have been negatively correlated with the value of pension assets.Sloan (1996) investigate whether stock prices reflect information about future earnings enclosed in the accrual and cash flow components of current earnings. The results claim that the persistence of earnings performance is shown to depend on the relative sizes of the cash and accrual components of earnings. The author insist that stock prices act as if investors do not identify correctly the different effects of the cash and accrual components.
To sum up, there are two different views whether stock returns reflect all information currently available on the market or not. On the one hand, there is no evidence whether the pension fund obligations have an effect on the valuing of the stock returns. On the other hand there is adequate evidence that the information in the footnotes is not sufficient enough.
Based on the literature review, the following testable prediction is developed:
H1: US companies with unrecognized pension related items earn abnormal low risk-adjusted returns.
3.
METHODOLOGY
3.1
Portfolio analysis method
In order to test market efficiency in respect to unrecognized pension assets I use Nakajima und Sasaki’s work.
In July of year t, the underfunded companies are allocated to ten portfolios according to the level of FR. These underfunded portfolios are formed by using the decile of the distribution of FR for underfunded companies, where the first portfolio (portfolio 1) is composed of the most underfunded companies and the tenth portfolio (FR<0) is composed of the least underfunded ones. The eleventh portfolio includes companies (FR=0), and the twelfth portfolio consists of firms with overfunded pension plans (FR>0).
Following this portfolio formation, it is now possible to create monthly portfolio return series by equally weighting the excess returns of the companies in each portfolio from July of year t to June of year t+1. To choose the portfolio formation date to be July of year t it is certain that all information which is needed is available on the market. Portfolios are reformed annually, from which average values for the entire period are obtained. I also report average annual values for the funding ratio, B/M ratio and size.
Continuing with the analysis the attention is now focusing to returns. I compute means and standard deviations of excess returns (return minus 1-month T-bill rate) for the portfolios with results for equally weighted portfolios.
In addition, I am going to run time-series regressions based on the three-factor model advocated in Fama and French (1993) in order to determine mispricing due to investors'
misunderstanding of relevant information regarding to pension-related disclosures.
Furthermore, I define risk-adjusted returns (alphas) as the intercepts resulting from regressions as
t t SMB t HML t be FF
t
EXMKT
HML
SMB
EXR
where EXRt is the portfolio excess return. The EXM, HML and SMB factors are constructed as in Fama and French (1993). EXM is the factor that represents the market portfolio minus the risk free rate. The HML factor represents a portfolio long in high book to market (B/M) and short in low B/M firms. The last factor, SMB represents a portfolio long in small and short in large companies.
As some prior studies (Nakajima and Sasaki, 2010) find evidence that the impact of additional momentum factor UMD is not significantly different from zero, hence it is not taking into account for this model
3.2
Variables
going to take the pension benefit obligation and subtract pension assets, accrued/prepaid pension cost and the additional minimum liability in order to get the unrecognized pension liabilities. The fact that the unrecognized pension liabilities are not take into account on the balance sheet, this unrecognized pension liability reduces the amount of pension benefit obligations which is actually designated for the defined pension benefit plan. Quite the reverse, due to the curtailment of the designated pension plan the company owns more assets due to the fact that the company doesn’t have to offset this liability on the balance sheet. Consequently, the company uses the unrecognized pension liability as an asset, which enables the company to use this asset otherwise, e.g. to diminish earlier pension obligations. Hence, I define this additional asset as the unrecognized pension asset. Due to the unrecognized pension assets I calculate the funding ratio with the aid of the book value of equity in order to see if the unrecognized pension asset has an impact on the value of the company’s stock return.
Hence, in the case of underfunding, the numerator of FR is calculated as the product of −1 and unrecognized net pension obligations.
The variable funding ratio (FR) is defined as follows
3
3.3
Sample
The data used for this research embrace accounting data from 2000 – 2006. This sample use for this research consists of US companies listed on the NYSE, AMEX and NASDAQ with ordinary common stock. Therefore, ADR’s REITs and units of beneficial interest are excluded. In addition, this sample is restricted to those companies that sponsor defined benefit pension plan and actually have the above-mentioned accounting data available on their financial reports and have at least two years of accounting data available. Finally, companies whose FR is more than five standard deviations away from the annual mean are also excluded in order to avoid outliers.
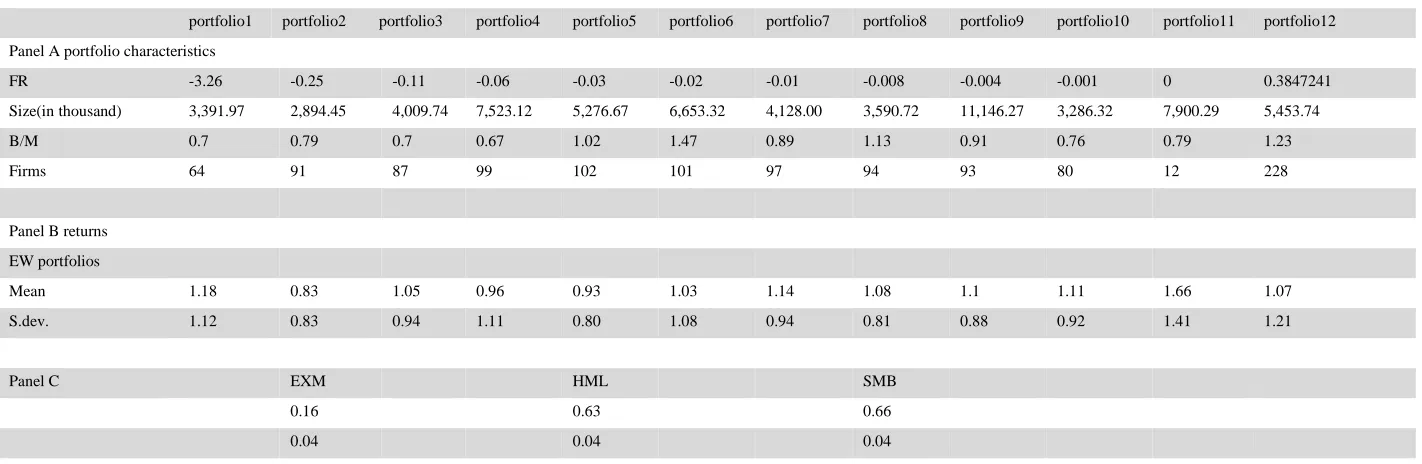
Table 1 reports descriptive statistics on the composition of the 12 portfolios and their returns. The characteristics in Panel A are measured in January of t-1 relatively to their portfolio formation. There is a wide distribution on the average level of FR across the portfolios. For the most underfunded companies (portfolio 1) the average FR is about -3.26% far lower than those of other portfolios, indicating a wider distribution in the magnitude of the effects of unfunded pension liabilities on stock returns. This emphasize that mispricing’s might exist only for companies with huge unrecognized obligations.
For the last underfunded ones (portfolio 10) it is only -0.001%. This portfolio includes companies for which the underfunding is effectively very small.
Panel B presents the means and standard deviations of each portfolio’s monthly returns. It is remarkable that the average return on portfolio 1 is higher than for other portfolios, except
3
Book value is the accounting value of a company. It has two main uses:
i) It is the total value of the company's assets that shareholders would theoretically receive if a company were liquidated. ii) By being compared to the company's market value, the book value can indicate whether a stock is under- or overpriced.
portfolio 11, its mean and standard deviation is essential larger, emphasizing that it risk-adjusted returns is relatively low among portfolios. Obviously, there is non-linearity between funding level and returns, which demonstrate that only at extremely high levels of underfunding exist mispricing’s affected by pension-related accruals. But it is also notable that the results of portfolio 11 (FR=0) demonstrate a very high average return, which indicates that investors take into consideration all relevant pension-items. This result shows similar patterns to what Nakajima and Sasaki (2010) found on their research. It is remarkable that especially for portfolio 11 the mean 1.66% and the standard deviation 1.41% immensely higher than for all other portfolios. On the one hand I assume that this result might be due to the new accounting standard format (FASB 1324 ) which does not change the way how companies have to disclose their funding status but it forces companies to disclose pension related items more adequate. This extra pressure might be a reason why companies in this portfolio earns the highest average returns because investors are more accurate when analyzing pension related items, hence abnormal risk adjusted returns mostly exist in companies, where the funding ratio is neither over nor underfunded.
On the other hand, even though companies, where the funding ratio is neither over nor underfunded, earn the highest risk adjusted returns; there is still an ambiguity why several underfunded companies also earn a high risk adjusted return. Especially portfolio 1 exhibits the highest risk adjusted average return of all underfunded portfolios. This result might be due to the market’s failure to fully reflect the effect of pension deficits for the stock returns of the sponsoring companies.
.
4
6 Table 1
Descriptive statistics of each portfolio.
In July of year t, stocks with negative FR are assigned to 10 groups according to the deciles of the distribution of FR for US companies. The stocks in the first decile are the most underfunded and the stocks in the tenth decile are the least underfunded. The companies with nonnegative FR (FR =0) are assigned to the eleventh group and the companies with a positive FR (FR>0) are assigned to the twelfth portfolio. Panel A reports the annual averages of the FR, the market value of equities in million yen (Size), the B/M ratio, and the number of firms in each portfolio. Panel B reports the averages and standard deviations of each portfolio. Portfolio returns are calculated by equally weighted (EW). The sample covers the formation periods from January 2000 to December 2006. Panel C reports the means and standard deviations for the returns on the three-factor portfolios: EXM, HML and SMB
portfolio1 portfolio2 portfolio3 portfolio4 portfolio5 portfolio6 portfolio7 portfolio8 portfolio9 portfolio10 portfolio11 portfolio12
Panel A portfolio characteristics
FR -3.26 -0.25 -0.11 -0.06 -0.03 -0.02 -0.01 -0.008 -0.004 -0.001 0 0.3847241
Size(in thousand) 3,391.97 2,894.45 4,009.74 7,523.12 5,276.67 6,653.32 4,128.00 3,590.72 11,146.27 3,286.32 7,900.29 5,453.74
B/M 0.7 0.79 0.7 0.67 1.02 1.47 0.89 1.13 0.91 0.76 0.79 1.23
Firms 64 91 87 99 102 101 97 94 93 80 12 228
Panel B returns
EW portfolios
Mean 1.18 0.83 1.05 0.96 0.93 1.03 1.14 1.08 1.1 1.11 1.66 1.07
S.dev. 1.12 0.83 0.94 1.11 0.80 1.08 0.94 0.81 0.88 0.92 1.41 1.21
Panel C EXM HML SMB
0.16 0.63 0.66
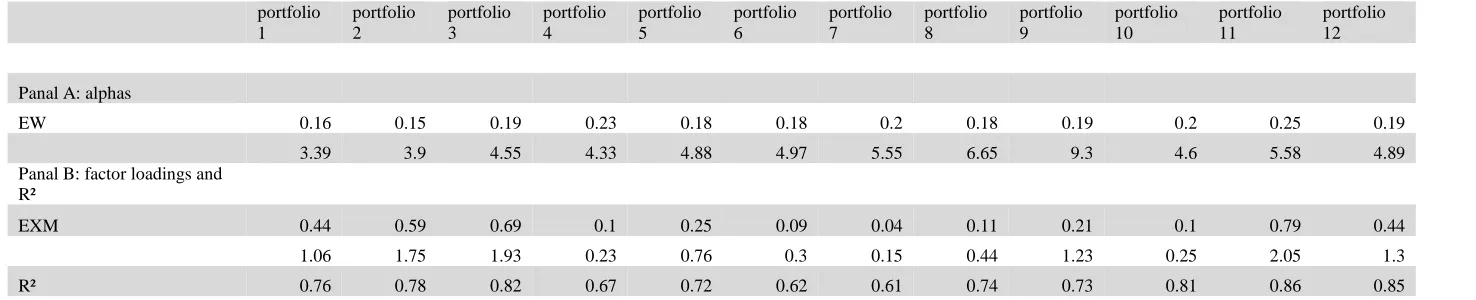
Table 2:
Time-series regression results based on single-factor CAPM model.
portfolio 1
portfolio 2
portfolio 3
portfolio 4
portfolio 5
portfolio 6
portfolio 7
portfolio 8
portfolio 9
portfolio 10
portfolio 11
portfolio 12
Panal A: alphas
EW 0.16 0.15 0.19 0.23 0.18 0.18 0.2 0.18 0.19 0.2 0.25 0.19
3.39 3.9 4.55 4.33 4.88 4.97 5.55 6.65 9.3 4.6 5.58 4.89
Panal B: factor loadings and R²
EXM 0.44 0.59 0.69 0.1 0.25 0.09 0.04 0.11 0.21 0.1 0.79 0.44
1.06 1.75 1.93 0.23 0.76 0.3 0.15 0.44 1.23 0.25 2.05 1.3
R² 0.76 0.78 0.82 0.67 0.72 0.62 0.61 0.74 0.73 0.81 0.86 0.85
8 Table 3
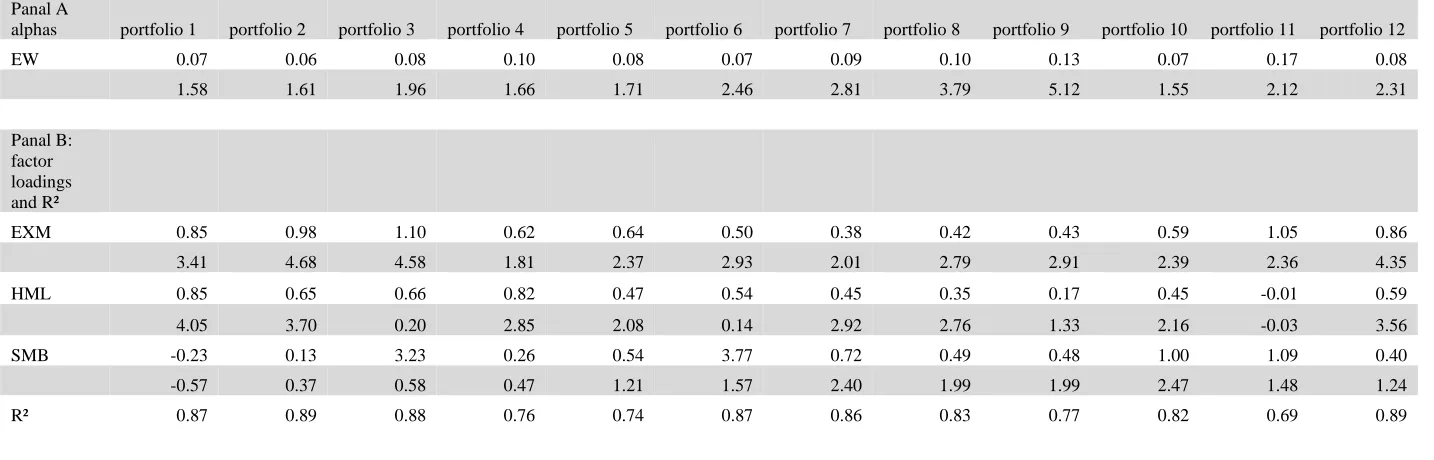
Time-series regression results based on three-factor model.
Panal A
alphas portfolio 1 portfolio 2 portfolio 3 portfolio 4 portfolio 5 portfolio 6 portfolio 7 portfolio 8 portfolio 9 portfolio 10 portfolio 11 portfolio 12
EW 0.07 0.06 0.08 0.10 0.08 0.07 0.09 0.10 0.13 0.07 0.17 0.08
1.58 1.61 1.96 1.66 1.71 2.46 2.81 3.79 5.12 1.55 2.12 2.31
Panal B: factor loadings and R²
EXM 0.85 0.98 1.10 0.62 0.64 0.50 0.38 0.42 0.43 0.59 1.05 0.86
3.41 4.68 4.58 1.81 2.37 2.93 2.01 2.79 2.91 2.39 2.36 4.35
HML 0.85 0.65 0.66 0.82 0.47 0.54 0.45 0.35 0.17 0.45 -0.01 0.59
4.05 3.70 0.20 2.85 2.08 0.14 2.92 2.76 1.33 2.16 -0.03 3.56
SMB -0.23 0.13 3.23 0.26 0.54 3.77 0.72 0.49 0.48 1.00 1.09 0.40
-0.57 0.37 0.58 0.47 1.21 1.57 2.40 1.99 1.99 2.47 1.48 1.24
R² 0.87 0.89 0.88 0.76 0.74 0.87 0.86 0.83 0.77 0.82 0.69 0.89
4. Regression results
Table 2 presents regression results based on the single-factor CAPM model. The alpha (intercept) of portfolio 1 is 0.16%, corresponding to 1.92% annually. This evidence demonstrate that companies with huge unrecognized pension obligations earn lower returns after controlling their higher loadings on the market factor in comparison to companies with less
unrecognized pension obligations e.g. portfolio 4, where the alpha is 0.23%, corresponding to 2.76% annually. This result can be interpret that investors cannot fully analyze the comprehensive information of pension related items, even though it is disclose in the footnotes, which prevent investors from fully incorporating the effect of underfunding when valuing the stock returns. It is worthwhile that the Beta of the first three portfolios is essentially higher than the betas of the other portfolios except portfolio 11 (FR=0), there is the highest beta of all portfolios. This result shows that these portfolios have a higher systematic risk and are more volatile to the market. This also indicates that investors cannot completely analyze the comprehensive information of unrecognized pension items when valuing stock returns. Due to the fact that the intercept might be biased by other factors, such as B/M ratio, validating risk factors are necessary to confirm the findings. Hence, I run a regression analysis in order to take into consideration these factors.
Table 3 presents a time-series regression based on the Fama-French three factor model. Panel A reports estimated alphas and Panel B presents factor loading and R-squares. From Panel B we find that companies with a high underfunded ratio have not only higher betas but also larger factor loadings on HML. On the contrary, the factor loading of the portfolio one is the only statistically insignificant value (-0.23). That indicates that especially high underfunded companies earn bigger returns. Also notable is that portfolio one to three as well as portfolio 11 have high betas. I found this evidence in Table 2, where I only examined the single-factor CAPM model, once before. This proves my hypothesis, with consideration of factors such as B/M, that investors cannot fully analyses the comprehensive information of pension related items. Hence the valuation of the stock returns is not completely incorporate also they are disclosed in the footnotes. The most interesting result in Panel A is that especially the portfolio 11 (FR=0) has a statistically significant intercept of 0.17%, whereas the intercept of other portfolios are not significantly different from zero. When comparing the results with Franzoni and Marin (2006) and Nakajima and Suzuki (2010. I interpret this result as evidence that due to the introduction of FASB 132, companies are more constrained with disclosure relevant pension-related items and investors are more keen on keep into account these relevant items.
On the contrary, the intercept of the portfolio 1 (0.07%), portfolio 2(0.06%), portfolio 3 (0.08%) seems essentially lower than portfolio 11 (0.17%). However, this result emphasize that the market does not fully reflect all relevant pension related items. It seems that there exists mispricing for companies which are underfunded. This is also a pattern similar to the results of Franzoni and Marin (2006) and Nakajima and Suzuki (2010) wherein they report that low returns are found only in companies with particular underfunded pension plans.
It would be interesting to note that the funding status of pension plan might be examined by the sponsoring company’s prior profitability, since companies with low internal cash flow are not able to afford requisite financial contributions to the scheme,
whereas companies with abundant cash flow are able to make the most of favorable tax treatments. In addition, the amount of unrecognized pension obligations is also affected by the profitability of the sponsoring company. Chen at al. (2006) found evidence that this might depends on the fact that the market tends to underreact to swap in business conditions. Hence, lower returns of companies with huge unrecognized pension obligations are induced by lower profitability of sponsoring companies which is not assimilate into the stock returns. As a result, related literature has shown that the impact of negative information on stock returns reveal in kind of delays since the market only take time the assimilate this kind of information into the stock returns. Therefore it might be interesting to include a momentum variable in the regression analysis in order to see the effect of changes in business conditions that are not reflected in the stock price. But Nakajima and Suzuki (2010) as well as Franzoni and Marin (2006) find enough evidence that this has not an essential effect on the impact of the stock price. It is also worthwhile to take into consideration the accounting standard FASB 132, because companies has to disclosure essentially more and so investors would directly recognize this unrecognized pension related items. This might explain which the intercept of portfolio 11 as well as the beta is very large which means that the abnormal excess returns are only at companies where the funding ratio is zero.
5.
CONCLUSION
In this paper I examine if the market fully reflect the information given in the footnotes and if the unrecognized pension items have a significant effect on the stock returns. The empirical evidence seems to confirm that the complexity of pension related information prevents investors from taking into consideration the effect of underfunding.
In particular, I show that the portfolio with the most underfunded companies earns lower risk adjusted returns relative to portfolios of companies with a healthier pension scheme. Furthermore, the systematic risk of the most underfunded companies is significantly higher than those of companies with healthier pension schemes. I interpret this evidence as being due to investors not paying enough attention to the effect of the current underfunding for future earnings and cash flows. The low returns I predict is the logical consequence that investors are systematically surprised by the negative impact of pension underfunding on cash flows. On the other hand, the relatively high return of companies without over and underfunding might be assumed that the new account standard FASB 132 forces companies to disclose more precisely, hence investors analyze the footnotes more accurately. This might lead to a more precise valuation of the stock returns.
In order to draw a conclusion, corresponding to my hypothesis, there is enough evidence that underfunded companies earn lower returns than companies with a healthier pension scheme, but there is not enough evidence that these returns are abnormally lower.
10 risk adjusted returns between over und underfunded companies.
If there would be new regulators in order to understand the comprehensive information of pension related items even better, this would enable the correct market valuation of underfunded companies, and would avoid price adjustments. In summary, I believe that any reform of the current accounting system should aim at allowing pension funding status to be reflected in a company’s income statement without delay or discretion. This adaption may increase the stock returns and perhaps decreases the return volatility as well as the systematic risk. As a consequence, an unequivocal interpretation of the effect on earnings and cash flows of a given level of underfunding might be provided and this would enable the efficient valuation of these companies. Due to the fact that companies with low internal cash flow are not able to afford requisite financial contributions to the scheme, companies with abundant cash flow are able to make the most of favorable tax treatments, in interesting topic for further research would be if companies exploit the effect of mispricing in order to raise funds.
6.
REFERENCES
Bulow, J., Mørck, R., Summers, L., 1987. How does the market value unfunded pension liabilities? In: Bodie, Z., Shoven, J.B., Wise, D. (Eds.), Issues in Pension Economics. University of Chicago Press.
Catlin, B. 2004. The trouble with pension accounting.
http://news.minnesota.publicradio.orglfeaturesI2004/11/08catlin b_nwasec.
Castro-González, K.C, 2011. Portrait of a company: definded benefit pension plan sponsors. Institute for business and Finance research vol. 6
Chen, X., Yao, T., Yu, T., Zhang, T., 2014. Learning and Incentive: A Study on Analyst Response to Pension Underfunding, Journal of Banking & Finance, doi: http://dx.doi.org/10.1016/j.jbankfin.2014.04.001
Coronado, J., Mitchell, O.S., Sharpe, S. A., Nesbitt, S.B., 2008. Footnotes aren't enough: the impact of pension accounting on stock values. Journal of Pension Economics and Finance, 7, pp 257-276 doi:10.1017/S147474720800379X
Fama E.F., French, K.R., 1993, Common risk factors in the return of stock and bonds, Journal of Financial Economics 33
Feldstein, M., & Morck, R. (1983). Pension Funding Decisions,
Interest Rate Assumptions, and Share Prices. In Financial
Aspects of the United States Pension System (pp. 177-210). University of Chicago Press.
Feldstein, M., Seligman, S., 1981. Pension funding, share prices, and national savings. Journal of Finance 36, 801–824. Franzoni, F., 2009. Underinvestment vs. overinvestment: evidence from price reactions to pension contributions.
Financial Economics 92, 491–518.
Franzoni, F., Marín, J., 2006. Pension plan funding and stock market efficiency. Journal of Finance 61, 921–956.
Gopalakrishman, V., Sugrue, T.F., 1995. The determinants of actuarial assumptions under pension accounting disclosures. Journal of Financial and Strategic Decisions 8(1): 35-41
Jeremy I.B., Lawrence H.S., Lawrence H.S., 1987. How Does the Market Value Unfunded Pension Liabilities? Published in 1987 by University of Chicago Press (p. 81 - 110)
Jin L., Merton, R. C., Bodie Z., (2006), Do a firm's equity returns reflect the risk of its pension plan, Journal of Financial Economics 81 (2006) 1–26
Miller, B.W.P., Bahnson, P.R., 2007. Perfect storm prompts changes in pension accounting. Journal of Accountancy, 36-42.
Nakajima, K., Sasaki, T. (2010) Unfunded pension liabilities and stock returns, Pacific-Basin Finance Journal 18 (2010) 47– 63
Rauh, J., 2006. Investment and financing constraints: evidence from funding corporate pension plans. Journal of Finance 61, 33–72.
Sloan, R., 1996. Do stock prices fully reflect the information in accruals and cash flows about future earnings? Accounting Review 71 (3), 289–315.
Soroosh, J., Espahbodi, P., 2007. New accounting rules for postretirement benefits: How SFAS 158 may affect a company's financial statements. The CPA Journal, 28-35.