A thesis
submitted in partial fulfilment of the requirements for the Degree
of
Doctor of Philosophy in Psychology in the
University of Canterbury by
Richard Tan Hong Kwang
University of Canterbury
Dedication
With deepest gratitude and love to my mother
and
It has taken me a number of years to complete this project and I am indebted to many people for their support and assistance throughout the various stages of the
endeavour.
Firstly, I would like to thank all the people who serve as subjects in the various experiments. I am very grateful to my supervisor, Prof. K. T. strongman, and associate
supervisor, Mr. J. Pollard, for their critical guidance
throughout. I would also like to acknowledge the assistance provided by the other academic staff of the Psychology
Department and especially members of the technical staff who have enriched me in more practical areas of life. Special thanks go to JohtiBart6n who always managed to cheer up the situation whatever the circumstances.
Personal support came from the Phelan family without whom the thesis would have been completed a lot earlier but would have meant a l e s s ' full-filling' experience. I must express my deep gratitude to the Phelans, Mike and Maddy Davidson who have made New Zealand a home away from home for me.
Garth Ritchie and Mike Davidson, two of my most admired friends as well as fellow sufferers, have been a constant source of encouragement and their support extend far beyond the academic. My total gratitude goes to Garth who have made a very sUbstantial contribution to the thesis by his
statistical advice, theoretical expositions and inspiring attitude. His sporting association is also acknowledged.
CHAPTER
I.
CONTENTS
ABSTRACT I NTRODUCTI ON.
PERSONALITY CHARACTERISTICS OF PATHOLOGICAL GAMBLERS, SOCI AL GAMBLERS AND NON-GAMBLERS. I NTRODUCTI ON ..
METHOD . . . . 1. Subjects. 2. Tests . . . . 3. Procedure. RESULTS . . . DI SCUSSI ON ..
PAGE 1 9 1 9 24 24 24 25 27 31
III. THE RELATIONSHIP OF GENDER, LOCUS OF
CONTROL, LUCK, REINFORCEMENT AND GAMBLING. 35 I NTROD UCTION . . .
1. Sex differences .. 2. Luck . . . .
35 37
413
3. Locus of control. 43
4. Rationale for the use locus of control scales . . .
METHOD . . . . 1. Subjects.
2. Experimental manipulations. 3. Procedure ..
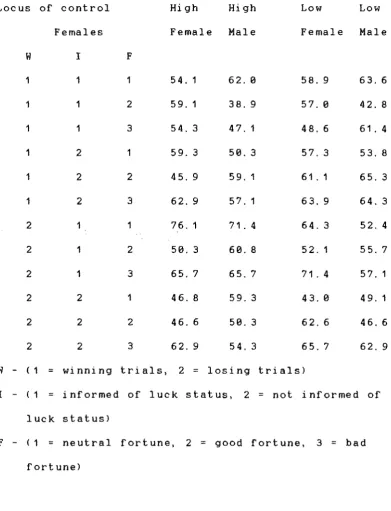
RESULTS . . . . 1. Risk-taking .. 2. RecalL . . . .
a. The numbers chosen by subjects to
48 513 513 513 52 54 54 57 place their bets o n . . . 57 b. The most and least frequently
occurring n u m b e r . . . 59 c. The accuracy of estimation of the
amount of money staked. . . .. . . . . . . . 62 d. The estimation accuracy of the amount
of money won/lost during the
gambling s e s s i o n . . . 63 3. Post-experimental questionnaire survey. 67 DI SCUSSI ON . . . .
1. Ri sk-taki ng .. 2. RecalL . . . .
a. The numbers chosen by subjects to
68 68
713 place their bets o n . . . 713 b. The most and least frequently
occurring n u m b e r . . . 71 c. Estimation accuracy of the amount of
money staked.... . . . .. . .. . . . 73 d. The estimation accuracy of the amount
gambli ng sessi on . . . . 3. The post-experimental survey . . . . 4. A discussion of the hypotheses . . . . IV. GAMBLING AS STIMULUS BOUND BEHAVIOUR? . . .
I NTRODUCTI ON . . . . METHOD . . . . 1. Subjects . . . . 2. Tests . . . . a. Item recall . . . . b. Letter identification . . . . c. Difference detection . . . . 3. Procedure . . . . RESULTS AND DISCUSSION.
VV. THE EFFECTS OF AROUSAL AND ENVIRONMENTAL CUES ON GAMBLI NG . . . . I NTRODUCTI ON . . . .
1. Arousal and gambli ng . . . . 2. Effects of reinforcement history upon
gambl i ng be ha vi our . . . . 3. The importance of gambling cues in
gambli ng behavi our . . . . 4. Chance, skill and risk preferences in
gambling . . . . 5. Rationale and hypotheses . . . . METHOD . . . .
1. Subjects . . . .. 2. Materials . . . . 3. Tests . . . .
4. Procedure . . . . a. Arousal . . . . b. Gambli ng cues. . . . . . c. Rei nforceme nt hi s t or y . . . . RESULTS . . . .
1. Betting . . . . 2. Estimates of the chances of winning and
maki ng correct predi ctions . . . . 3. Choice of payment and skill versus
chance . . . . 4. Luck . . . . DI SCUSSI ON . . . . 1. Betting . . . . 2. The subjective estimates of the chances
of winning and making correct
predictions . . . " . . . . 3. Probability, skill/chance preference,
enjoyment of the game and the belief in 1 uck . . . . 4. The influences of gambling cues,
rei nforcement hi s t or y and arous al . . . . VI. AN APPLICATION OF THE REPERTORY GRID
73 75 77 81 81 84 84 84 84 85 85 85 87 92 92 97 1134 1137 188
1 1 5 11 8
11 8
11 8
119 11 9
1213 1 21 122 125 125 135 1413 143 152 152 157 1613 164
VI I.
I NTRODUCTI ON. . . .. 173 1. A description of the repertory grid
technique . . . 177 2. The relevance of the grid technique in
gambling research.. . . . . 180 METHOD . . . .
1 . 2.
3.
Subjects . . . .
Construction of the grids. Procedure . . .
RESULTS . . . .
1. The STI MULUS GRI D. . . . . . .
2. The gambler STIMULUS GRID . . . .
3. The non gambler STIMULUS GRID .. 4. Significance of the results of the
STIMULUS GRIDS . . . , . . . .
5. A comparison of the self versus the
183 183 183 184 185 185 185 190 194 ideal s e l f . . . 197
6, The AROUSAL GRI D . . . , 203 7. The gambler AROUSAL GRI D. . . 203
8. The non gambler AROUSAL GRID... 211
9. Significance of the results of the
AROUSAL GRI DS. . . 21 5 DI SCUSSI ON . . . :.
THE ASSOCIATION OF LUCK AND SUPERSTITION WI TH GAMBLI NG . . . .
1.
2.
Luck . . . . Superstition ..
21 B
224 225 231 \./ VI I I. OVERALL DI SCUSSI ON . . . , . , .. , . . . 236
IX.
1. Personality characteristics of gamblers. 236 2. The relationship between gambling with
the locus of control, recall, luck and
reinforcement . . . , . . . , . . . . 239 3, The consideration of gambling as
stimulus-bound behaviour... 245 4. The effects of reinforcement history,
gambling cues and arousal on the
gambling behaviour of social gamblers
and non gamblers . . . , . . . 246 a. Probability, skill and chance
perception and preferences, and
recall.. .. . . . . . . . . . .. . . . 24B b. Luck and superstition . . . ,. 251 c. Reinforcement history, gambling cues
and arousaL . . . , . . . 255 5. The repertory grid technique an
alternative method in the study of
social gamblers and gambling.. 270 SUMMARY AND CONCLUSIONS . . . .
1. Personality characteristics of gamblers. 2. Gambling, recall and locus of controL .. 3. Gambling and stimulus-binding . . . . 4. The probability, skill and chance
perception and preferences of gamblers and non-gamblers . . . . 5. Luck and superstition and gambling . . . .
6. Rei nforcement history, gambli ng cues
and a r o u s a l . . . . . . .. 282 7. The repertory grid technique for
studying gamblers and gambling . . . 285 A SKETCH OF THE SOCIAL GAMBLER AND
LIST OF TABLES TABLE
A. The amount of money spent on l o t t e r i e s and nett profit made from the sale of l o t t e r i e s in New
PAGE
Zealand for the last 113 y e a r s . . . 4 B. Amount of money invested in horse- and
dog-racing in New Zealand in the last 113 years and the amount of profit derived from the races by the Totalisator Agency Board over the same period of time ..
1. The mean scores of non-gamblers, gamblers and pathological gamblers on the 16 PF, EPQ and
5
Rotter's I-E S c a l e . . . 28
2. The mean ages of non-gamblers, social gamblers
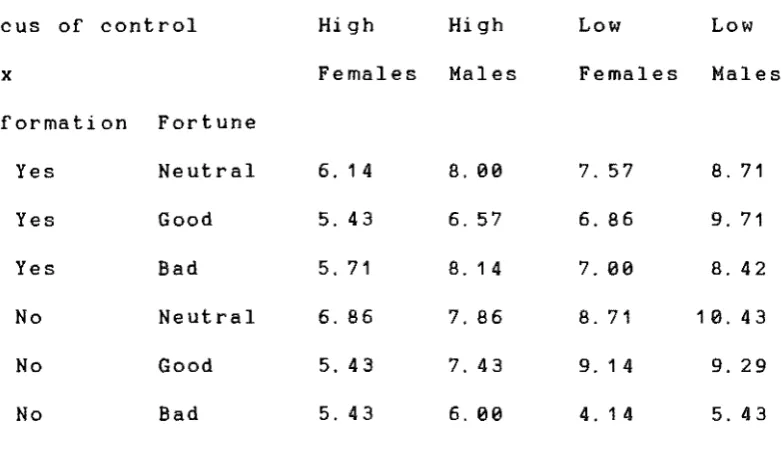
and GA members. . . . . . 313 3. Summary of the experimental manipulations of
the payoffs and the luck information presented. 51 4. Group means of the higher stake s chosen by
subjects unde.r the various experimental
conditions ..
. . . .
.
. . ....
54 5. Group means of the accuracy of recall of thenumbers chosen by subjects to place their bets
on .. 58
6. The mean recall accuracy of the most frequently occurring number... . . . .. 613 7. The mean recall accuracy of the least frequently
occurring number.... 62
8. The mean estimation accuracy of the amount of
money staked. 63
9. The accuracy of subjects· estimation of the amount of money won/lost during the gambling session ..
113. Subjects' mean ratings of being lucky or unlucky during the gambling session . . . .
11. The mean performance of gamblers and
64
67 non-gamblers in the three tests of externality. 87 12. The experimental cells of the independent
variable and experimental manipulations... 1213 13. Responses to the question: What do you think is
the most important factor contributing to your overall win or loss? . . .
1 4. Responses to the question: was fair (not rigged)? . . .
Do you think the game
1 4 5
1 4 5
15. Breakdown of the responses to the question: Were there any cues which may have influenced the way you b e t ? . . . 146 16. The inter-correlations and angular distances
between constructs for the gambler STIMULUS
G R I D . . . . . . 186 17. The inter-correlations and angular distances
between constructs for the non-gambler STIMULUS
GRID... . . . 191 18. A summary of the t tests for the self data for
gamblers and non-gamblers.... . . 198 19. A summary of the t tests for the ideal self
data for gamblers and non-gamblers... 281 28. The relationships between constructs and
elements for gamblers . . . . 285 21 . The relationships between constructs and
LIST OF FIGURES
FIGURE PAGE
1. The scores of non-gamblers, soci al gamblers
and GA members on the N scale of the EPQ.... 29 2. The amount of ri sk taken under neutral, good
and bad payoff conditions when subjects were that they may experience ordinary, good or bad
1 u c k, 0 r w hen not i n for me dab 0 u t the i r 1 u c k. . 5 5 3. The amount of risk taken under neutral, good
and bad payoff conditions by internals and
externals. . . . 56 4. The recall of the numbers chosen when subjects
were informed that they may experience ordi nary, good or bad 1 uck, or when not
informed about their luck... . . . 59 5. Recall of the most frequently occurring number
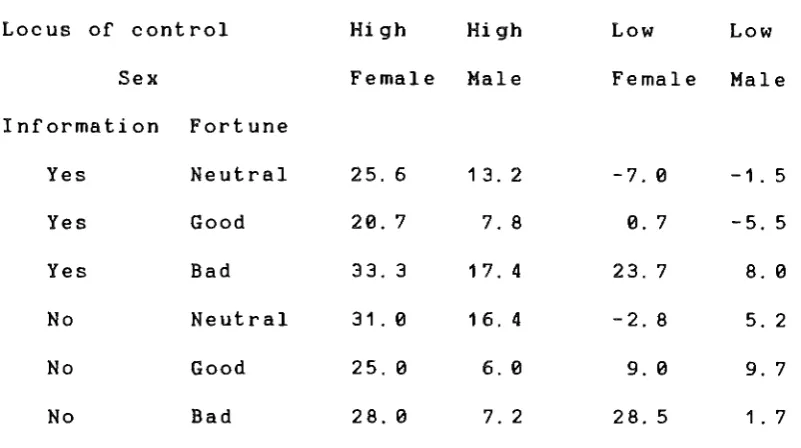
in the gambles by internals and externals when informed of ordi nary, good or bad 1 uck and when they were not informed of their l u c k . . . 61 6. Accuracy of subjects' estimation: The mean of
subjects' actual wins/losses subtracted by their estimated wins/losses recorded after each block of 15 gambles when they were informed of
ordinary, good or bad luck and when they were
not informed of their luck. . . . . .. 65 7. Accuracy of estimation for the 2 sexes: The mean
of the actual wins/losses of males and females subtracted by their estimated wins/losses
recorded after each block of 15 gambles when the 2 sexes were partitioned into internals and
externals ..
8. The effect of gambling cues on the staking
66
behaviour of gamblers and non-gamblers... 125 9. The mean amount of money staked by gamblers and
non-gamblers over the 30 trials. " " , . . . 127 10. The effects of the outcome of the previous
arousal, having good or bad reinforcement schedule first and the influence of cues on amount of money staked,
11. The effect of gambling cues on the betting behaviour of gamblers in terms of the stake following 1, 2 and 3 wins/losses trials combi ned respecti vely. . . . . . 12. The effect of the outcome of bets following
win/loss, 2 wins/losses and 3 wins/losses combined, having good or bad reinforcement schedule first and the influence of cues on amount of money staked by gamblers and
non-gamblers . . . , . . . . , . . . .
13. The effect of having a run of 1, 2 and 3 wins or losses on the amount of money staked when
subjects have a good or poor reinforcement
schedule f i r s t . . . . . . . 134 14.
1 5.
16.
17.
18.
The mean combined ratings of the chances of winning and the expectations of making the
correct prediction of gamblers and non-gamblers over the 313 t r i a l s . . . . . . . . .
The mean ratings of the chances of winning and the expectations of making the correct
prediction of gamblers and non-gamblers over the 313 trials . . . .
The number of subjects choosing each form of payment. .. . . . .. . . . .
The effect of arousal and reinforcement history on subjects' perception of being lucky or
unlucky during the game . . . .
The effect of arousal and reinforcement history on the rating of enjoyment of the game by
gamblers and non-gamblers . . . .
19. The effect of arousal and gambling cues on the number of trials wanted by gamblers and
non-gamblers ..
213. The effect of arousal on gamblers and
non-gamblers in terms of their success during
137
139
1 41
144
1 47
149
the gambling session.. . . .. . . . 1513 21. The effect of arousal and reinforcement on the
subjects in terms of the success in the
gambling session. . . .. . . . . . 151 22. Composite diagram for components 1 , 2 and 3 for
the gamblers' STIMULUS GRI D . . . 188 23. Two component graph of the non-gamblers'
STI MULUS GRI D.
· ...
· ...
· ....
192 24. Two component graph of the gamblers' AROUSALGRID . . .
· ...
· ...
· ....
2134 25. Two component graph of the non-gamblers'ABSTRACT
A comparison of the personality profiles of Gamblers
Anonymous (GA) members, Bocial gamblers and non-gamblers on
the 16 PF, EPQ and Rotter's I-E Scale showed only that GA
members scored significantly higher than both social gamblers
and non-gamblers on the Neuroticism Scale of the EPQ.
Other factors considered to be influential in gambling
decisions were investigated. There were no significant
differences in the risk-taking behaviour of high compared to
low locus of control subjects but the risk taken and the
recall of gambling decisions by internals and externals were
sensitive to information on luck. Although gambling was
shown not to be a stimulus-bound activity in the traditional
sense, the presence of gambling cues increased risk-taking in
social gamblers but lowered risk-taking in non-gamblers.
Reinforcement history, especially the ratio of the number of
wins and losses, the immediately preceding outcomes and runs
of wins and losses were shown to be influential in the
staking behaviour and the confidence in gambling of both
social gamblers and non-gamblers.
Personality and situational factors did not adequately
account for the differences in risk-taking decisions.
Physiological variations altered risk-taking within criterion
groups. Moreover, different forms of arousal were shown to
have different effects on risk-taking behaviour of social
gamblers and non-gamblers. Significant interactions between
arousal, gambling cues and reinforcement history suggested
that a diversity of variables are important in determining
gambling decisions rather than simply being under the control
of economic or personality factors. There is some evidence
between social gamblers and non-gamblers.
The repertory grid technique was explored as a research tool departing from the traditional methods of enquiry into gambling. The overall finding was that social gamblers
Note to the reader
In this thesis the terms compulsive gamblers and
pathological gamblers are used interchangeably although i t is acknowledged that the term pathological is preferred since the term compulsive implies a particular abnormality which need not necessarily be present in gamblers (see Moran, 1968; 1970).
Most of the experimental subjects in this study consist of social gamblers and these are people who do not experience problems in their gambling. Some of them may be regular
punters but, generally, gambling constitutes a recreational act i vi ty. When the term gambler is used without
CHAPTER ONE
INTRODUCTION
It is commonly acknowledged that risks exist in many facets of life, While most people are content to cope with the social and physical risks there are others who
deliberately seek out these risks. One interesting form of risk-taking which is not required in the individual's
behavioural repertoire for survival is monetary risk-taking or gambl i ng. The stock market and other business ventures are excluded from this category since these are given the benefit of the doubt that they may be required for income earning purposes. Monetary risk-taking, whether for
recreational purposes or that of need fulfillment, is a very widespread behaviour, even in societies where the activity is not enti rely legal (Herman, 1967; 1976a; Eadi ngton, 1976; Dickerson, 1984).
For those people in whom gambling is a dominant feature of their lives, their persistence in the activity is
impressive, but unfortunately, usually disastrous for the parti ci pant. Numerous studies have been carried out on people who are encountering problems associated with a preoccupation with gambling (see Loren2, 1983). However, those who enjoy gambling for purely recreational reasons are largely ignored. The interest in these people has mainly been concentrated on their decision-making and other
cognitive processes under various measures of risk. More often than not, an average' population (without any
Nevertheless, much information regarding gambling behaviour has been obtained from these laboratory studies and other sociological surveys (Tec, 1964; Downes, Davis, David 8.
stone, 1976; Herman, 1976a).
To begin with, social gamblers come from all walks of li fe. In most societies there are no political, social, religious or racial barriers to social or for that matter pathological gambling, with the exception of certain
religions such as Islam which prohibit the activity, Other religions, in an effort to raise funds, seem to encourage it, the prime example being the Catholic Church. Although
gambling takes place in most societies in some form or
another the Chinese and the Jews have often been singled out as the greatest gamblers. Cohen (1960; 1964; 1972) in his studies on gambling, uncertainty and psychological
probability, often cites interesting historical and mythical instances of strange gambling practices, Herman (1967), Downes et a1., (1976) and Li 8. Smith (1976) have shown that gambling is not restricted to any social class but the type of gambling preferred may be different within each class. On the whole, capitalist societies seem to dominate the world in per capita expenditure on gambling. The annual figures taken around the end of the 70' s show Australia heading the l i s t at A$710, USA at A$440, New Zealand at A$210, UK at A$95 and Canada at A$87. Some of the figures may be misleading in the sense that they represent the 'turnover' (all the money
wagered at a gambling event, including re investments) rather than the actual amount of money spent (Choice, 1979;
Consumer, 1981). Even then the figures are high.
Unfortunately, no figures are available from socialist countries, a comparison with which, would be interesting.
Herman (1976b) hypothesised that competitiveness and chance-taking may be stimulated by the political order,
especially in one where there are grave discrepancies in the distribution of wealth. In summary, the gambler may belong to any political and social stratum and, in many respects, is no different from the next person in the street.
Having decided who social gamblers might be we now turn to the question of where the gambling takes place.
Horse-racing is a very popular 'sport' in many parts of the world. In New Zealand horse-race betting is the most common form of gambling followed by housie (bingo) and lotteries. The figures are very high and lh~ increase in the amount of money invested is rapid. Tables
A
andB
below give the4
Table
A.
The amount of money spent on lotteries and nett profit made from the sale of lotteries in New Zealand for the last 113 years.Year No. of draws Gross proceeds ($) Profi ts ( $ ) 1975 1 4, 8 e e. 13 13 13 1~ 2,96e,eee
1976 2,691, €lee
1977 16,e65,eeen 3,213,131313
1978 65 21,21313, €lee 4,367,eee
1979 813 39,2ee,eee 8,462,eee
19813 86 57,7ee,eee 11,1339,131313
1981 84 62, 25e, €lee 11,932,eee
1982 5 5, 9 3 13, €lee 1~ 11,186,eee
1983 62,215,eeen 12,443, eee
1984 8 7, 9 1 13, 13 13 13 1~ 17,582, €lee
'it. Figures are not available, there were 5e draws in 1974.
The Golden Kiwi Jackpot changed from 5e cents to $1 in 1977 and to $2 in 19813. These were the common ones which were on sal e all the time (a b 0 u t 4 3 i n 1 97 4 , 6 1 i n 1 9 7 8 , 7 1 i n 1 9 7 9
and 72 in 19813) the rest were made up of $5, $113 and $2e
lotteries which probably reached a peak in 1984. Although no figures were available the author estimated that there were about 11313 draws of lottery tickets in the 1983-1984 calender year.
U
The Report of the New Zealand Lottery board did not always include the gross proceeds but from the ones available the profits amounted to between 19.8 to 2e.6 percent of the gross proceeds. These estimated figures were arrived at by taking the profits as constituting 2e percent of the gross proceeds, hence the inconsistencies in years 1981 and 1983 (New Zealand House of Representatives Appendix to the Journals,Table
B.
Amount of money invested in horse- anddog-racing in New Zealand in the last 10 years and
the amount of profit derived from the races by the
Totalisator Agency Board over the same period of time.
Year Total ($) Profits ($)*
(on- and off-course betting)
1975 266,576,000 25,058,000
1976 321,604,000 30,231,000
1977 366,703,000 34,470,000
1978 402,506,000 37,836,000
1979 464,696,000 43,681,000
1980 502,210,000 47,208,000
1981 534,540,000 50,247,000
1982 606, 04 T, 000 56,968,000
1983 671,810,000 63,150,000
1 984 729,534,000 68,576,000
From the above figures i t can be seen that in the last
decade the amount of money invested in gambling increased
from $281,376,000 to $817,444,000, nearly a 3 fold increase.
Looking at it in terms of profits the amount increased from
$28,018,000 to $88,158,000 more than 3 times the amount 10
years ago. Keeping in mind that these figures represent only
the two major gambling outlets the total amount of money
wagered by a population of 3 million New Zealanders is an
imposing figure. For this reason alone the study of gambling
is well justified.
A number of approaches have been taken to the study of
gambling. Gambling has been interpeted in learning terms
(Ferster & Ski nner, 1957; Ski nner, 1953; 1972; Levi tz, 1971;
Knapp, 1976; Dickerson, 1977bi 1979). Most of these accounts
type of gambling activity with some success. The primary emphasis has been given to explaining the reinforcing
attributes of money and identifying the various schedules of reinforcements which control gambling behaviour. An
over-emphasis on monetary concerns may lower the credibility of the behavioural framework since, as will be discussed later, i t is accepted that a number of other non-monetary factors seem to have powerful reinforcing qualities.
As might be expected, psychoanalytical explanations of gambling (Lindner, 19513; Greenson, 1947; Freud, 1953,
Bergler, 1957; Galdston, 19613; Halliday 8. Fuller, 1974), focussed on unresolved childhood conflicts. For many psychoanalytic authors, losing is the punishment that alleviates the guilt feelings associated with infantile
sexual desires. Gambling is also frequently regarded as the functional equivalent of other addictions (Galdston, 1960; Adler, 1966; Adler 8. Coleman, 1969). Freud (1953) suggested that gambling is derived from the primal addiction,
masturbation, while Halliday 8. Fuller (1974) described gambling as one of man's 'universal neuroses'. Need for approval, hence testing fate by taking chances in gambling, constitutes a major part in the psychoanalytic description of gambling (Lindner, 19513; Galdston, 19613). There are two
major objections to these psychoanalytic explanations of gambli ng. Firstly, most of these explanations are
speculative with l i t t l e or no supporting data to back up the hypotheses. Secondly, as with scientific evaluations of psychoanalytic hypotheses, they have been considered to be untestable and irrefutable (Popper, 1963).
In more recent times, phenomenological explanations of gambling began to find favour among investigators in the
gambling field (Livingston, 1974; Kusyszyn, 1976; 1977;
Knowles, 1976; Campbell, 1976). Much of the theorising arose
as a result of dissatisfaction with learning, and especially,
clinical approaches towards gambling. The main contention
from these authors is that, instead of viewing gambling as a
sick and/or abnormal behaviour, i t should be considered a
normal activity for most people and that i t provides a
healthy outlet for daily frustrations. Furthermore, i t
serves the function of play and recreation and gives hope for
wealth without the necessity of over-risking. Other
psychological advantages of gambling include an increase in
self-esteem, self-efficacy and self-worth associated with
successful gambling. This author would like to speculate
that through experience in gambling the individual may learn
to have less attachment to money and, from a history of
winning and losing as is typical of sports encounters, the
individual may have an opportunity to acquire a more
realistic attitude to life and greater tolerance towards
failure.
Gambling, like most other phenomena, has also been
interpreted from a sociological perspective (Caillois, 1962;
Devereux, 1968; Oldman, 1974; 1978; Herman, 1976a). Most of
these accounts discussed the sociological functions provided
by gambling in society (Herman, 1976a, b) or a subset of
society (Zola, 1963). Similar to the phenomenological
approach, these explanations have generally avoided labelling
gambling activity as 'sick' but instead generally argue that
gambling fulfills some form of social need for those who
gamble.
No single approach has been entirely satisfactory in
Learning theories have generally ignored cognitive aspects involved in gambling and the individual differences in
motivation for gambling but emphasised mainly the situational determinants of the initiation and maintenance of the
gambling activity. All the remaining orientations tend to suffer from an over-inclusion of too many forms of gambling in the explanations, thus making unreasonable
generalisations. Another major problem with most approaches is the difficulty in testing the hypothesis implied by the theories. This author asserts that most researchers would agree that different forms of gambling have different
characteristics and require diverse strategies for success. Bearing this in mind, and the fact that factors initiating gambling activity need not necessarily be the same as those maintaining gambling acti vi ty (Cornish, 197B), any all
encompassing theory of gambling behaviour will be likely to involve more than one causal factor. The present trend of research into gambling seems to suggest that a more eclectic approach is most frui tful (Anderson & Brown, 1984; Smi th &
Preston, 1984; Wagenaar, Keren & Plei t-Kui per, 1984). There are, nevertheless, s t i l l many problems to overcome, the most obvious of which, pertains to the how, how much and why of the contribution of the various 'forces' influencing gambling behaviour.
A number of researchers in gambling have concentrated more on the empirical demonstration of the 'risk-taking' propensity of individuals under conditions of varying
probabilities of winning and losing and the amount of money to be won or lost. The simplest model for decision-making under risk is t h e ' expected value' model where i t is assumed that the decision-maker will choose between bets andwhether
to bet at all, by uBing the maximisation of expected gain as the cri terion (Edwards, 1955). The expected values for each alternative bet are calculated by multiplying the value of each of its outcomes by its probability of occurrence and summing these products over all the outcomes (Pruitt, 1962),
The model is useful where the individual involved is
primarily motivated by rational economic concerns and where all the objective values of the probabilities and payoffs are known, but these gambling parameters are frequently absent. Other weaknesses of the model include individuals accepting bets with a negative expected value even if this is the alternative to not gambling at all and subjects have been shown to ignore information on expected value even when given the opportunity and encouraged to use such information
(Lichtenstein, Slovic & Zink, 1969). Prui t t (1962) showed that when expected value is held constant subjects may display preference for one bet over another.
Mosteller & Hogee (1951) presented some evidence for an 'expected utility' model which explained some of the
discrepancies not dealt with by a simple expected value model. The monetary values of payoffs are replaced by the individual's evaluation of their utility. In traditional economic theory, successive increments of money take on a diminishing utility which implies that even in the case of ' f a i r ' bets the satisfaction to be gained from winning extra money should by definition be less than the satisfaction to be forfeited should the same amount be lost, emphasising the apparent irrationality of gambling (Cornish, 1978).
Improvements were made to the original models by using subjective estimates of the parameters rather than the
10
was proposed by Edwards (1955) to account for some
inconsistencies in his earlier model. The most sophisticated model was that of the 'subjectively expected utility' model in which the utilities of the probabilities and payoffs were assigned subjective values (Rapoport & Wallsten, 1972).
Overall, expectation theories have not had much success at providing explanations for many types of gambling but are adequate for simple forms of gambling such as lotteries
(Weinstein & Deitch, 1974). The different types of gambling require different gambling behaviour and individual
differences within the same type of gambling will probably make the search for a general rule of gambling quite
difficult. Besides, factors other than economic are likely to playa large part under certain conditions.
A number of investigators have identified some factors which influence the gambler's evaluation of probabilities and payoffs. Tversky & Kahneman (1974) described 3 major
heuristics employed by people to assess and predict values, which under certain circumstances tend to lead to biases; 1. the representativeness heuristic, 2. the availability
heuristic and, 3. t h e ' adjustment from an anchor' heuristic. The perception of the amount of skill or chance involvement in the game has also been shown to have an effect in the assessment of the probabilities and payoffs of the gamble ( And r i e sse n, 1 97 1) and the a mo u n t 0 f r i s k t a ken (L up fer &
Jones, 1971; Littig, 1962>' A related bias appears in the amount of control the individual has on the outcome.
skill-related factors in chance situations may cue or
encourage the individual to have an 'illusion of control'
In gambling situations, the illusion of control which results
misleads the gambler about his/her chances of success, and
the consequences of this deception will depend upon the
extent to which skill (as opposed to chance) does, in fact,
influence the outcomes.
A series of studies in subjective probability by Teigen
(1983a,b,c,d) illustrated some of the errors of human
judgement in uncertain events. His results show that
guessing behaviour is subject to grouping, anchoring and
contextual effects. The major strategy in guessing seems to
be an a voi dance of numbe rs wi t h promi ne nt, 'non- random'
properties, which, at the same time, are highly available to
the subjects, Most subjects prefer to be consistent rather
than being' rational', making the final prediction is
dependent upon the order in which decisions are made. Most
subjects seem to have adopted a non-distributional conception
of probability, that is, when more than 3 alternatives are
available the probablities of all the events do not add up to
uni ty. Confidence is closely related to perceived chance,
but not to the subjective probability of the event in
question, except when all outcomes are judged equally due to
chance. The difference between the terms' chance' and
'probability' used in this context is that, in common
language, outcomes are sometimes sai d to be 'caused' by
chance (Teigen, 1983d) while probability refers to the
likelihood of an event occurring. Subjective and statistical
conceptions of uncertainty have partially opposing
connotations. 'An uncertain future' seems to be subjectively
12
belief, rather than the statistically unreliable future, with
restricted possibilities of prediction. Lichtenstein,
Fischhoff & Phillips (1982) concluded that the general
finding of the 'calibration' of subjective probability
estimates studies is that people tend to be over-confident,
that is, they exaggerate their probabilities of being
correct. These results and others from Kahneman, Slovic &
Tversky (1982) and their associates on judgement under
uncertainty have relevance to the present gambling research.
However, the topic is too vast to be reviewed in this
chapter. Many of these judgemental and statistical biases
have effects on gambling decisions and these will be
discussed along with the appropriate experiment.
Another source of bias which is particularly relevant to
gambling decisions can be referred to as the belief in luck
or superstitions. The bulk of research in the area of luck
has been carried out by Cohen and his associates. For
example, their results show that the belief in the
probability of occurrence of an outcome is increased or
decreased depending on how lucky or unlucky a person feels
respectively, compared to when the individual is feeling
neither lucky nor unlucky. These are further influenced by
the perceived difficulty of the task. In addition, a
preference for relying on skill or chance when gambling is
not absolute but is affected by the probability of success.
Some of the belief in luck is transformed into superstitious
practices gambling. Henslin (1972) described the
superstitious ritual in which crap players engage in
apparently trying to influence the fall of the dice. In
Jahoda's (1970) analysis of superstition, he noted that the
superstition have been so closely associated with gambling in ordinary life that a description of those terms usually
precede any discussion of gambling. Devereux (1968) further noted that in contemporary, rationally oriented societies, gambling appeals particularly to superstitious persons, and i t is one of the few areas in which permissive attitudes
towards superstition are tolerated. In spite of that, l i t t l e attention has been given by the scientific community to those 'forces' operating on the individual under conditions of
r i s k, e s p e cia 11 y mo net a r y r i s k - t a kin g .
In general, relatively l i t t l e effort has been given to investigations concerning non-economic factors influencing decision-making under risk or other gambling situations. There have been two major theoretical approaches; one, a learning theory perspective, and secondly, an emphasis on personality characteristics. I n t e r ms 0 f per son ali t y, the bulk of the research has concentrated on compulsive or pathological gamblers. Locus of control, extraversion, neuroticism and impulsivity are some of the most common
traits that have been investigated individually. The highest agreement, thus far, has been that compulsi ve gamblers are more external and score higher on the neuroticism scale. Other studies have yielded more conflicting or, at least, non-replicated results. The few learning theory
interpretations of gambling have been consistent, which is expected since most accounts have been post hoc assignments of behavioural units to the different components of the
14.
(Barker 8. Hiller, 1966; Goorney, 1968) other less physically
painful methods have been employed with success (Fitchett 8.
Sandford, 1976). Althoug~ the behavioural approach seems to
be a more profitable one to take, the existence of individual
i
i
differences and their inf~uences on gambling cannot be denied
(Cornish, 1978) and as Williams (1977) pointed out, the
potential influence of such personality variables has yet to
be investigated.
The other maj or a pproac h to gambl i ng, whi c h probabl y
belongs more to the study of decision-making, is the
information processing model. These models seem able to
integrate results from a wide variety of experiments
(Lichtenstein et aI., 1969; Slovic 8. Lichtenstein, 1968a;
Payne 8. Braunstein, 1971), The information processing model
is relevant to gambling behaviour because of the emphasis on
the importance of correctly identifying the sources of
information actually used by the decision-maker. Quite often
only restricted information is available and in many
instances the gambler maY,be persuaded or misled into paying
attention to one dimension rather than another. Information
may also be presented in many ways, aurally versus visually
or sequentially versus simultaneously. The inclusion of
selective attention to particular risk dimensions and other
stimuli will improve the descriptive and predictive power of
the models. The study of the actual strategies employed by
gamblers throws light on their perception and
importance-beliefs. The determinants of these factors and
the methods by which information processing techniques can be
deliberately manipulated will further specify the importance
of certain gambling parameters.
many areas of gambling research. One which is common to most
social investigations is the applicability of laboratory
findings to real life. The bulk of research in monetary
risk-taking has been carried out in the laboratory. In
nearly all cases the stakes for betting and the range of
gambling games that are available are severely limited. The
restriction of stakes is an important constraint since quite
a number of studies use the size of bets placed as a measure
of risk-taking thereby introducing the possibility of biasing
the re~ults. However, Lichtenstein 8. Slovic (1973) showed that the strategies employed by laboratory subjects are
replicable in a casino setting. On the other hand, Anderson
8. Brown (19~4) presented results which cast doubt that
laboratory gambling could be used as a valid analogue of the
real gambling situation.
Are 1 ate d 0 b j e c t ion i s t hat, mo r e o f ten t han not, the
laboratory 'gambling' is treated as an isolated event which
is hardly ever the case in real-life situations. The
motivation for gambling may play an important part in
determining the level of risk taken and the gambling
strategies employed. This is especially serious when i t is
highly unlikely that motives for gambling for volunteer
subjects (largely from a student population) are similar to
those who visit the race-track or the betting office.
Situational factors such as the range of physical and social
cues which are normally present in a gambling scene are
usually absent in laboratory settings. Otherwise,
experimental risk-taking and gambling studies enjoy the same
advantages as other controlled social research in the
laboratory (Lewin, 1979).
16
studies on the characteristics of gamblers have concentrated
on compulsive gamblers, and more often than not those
subjects have been recruited from Gamblers Anonymous (GA).
Dickerson (1984) has argued that no significant differences
have been demonstrated between this group of problematic
gamblers and other equally high frequency gamblers who do not
see k t rea t me n t . Also there has not been any differences
demonstrated between compulsive gamblers and social gamblers
(Malkin, 1981, cited in Dickerson, 1984). As a deviation
from the trend i t was decided that i t may be of theoretical
interest to investigate the characteristics of social
gamblers and people who enjoy gambling but do not
over-indulge in the activity, A number of features have been
ascribed to this group of social gamblers without much
supporting evidence. A comparison of the performance of
social gamblers versus non-gamblers has rarely been carried
out. The most prominent model of the progression from a
'normal' person to that of a compulsive gambler includes a
phase where the individual may be described as a social
gambler (Custer, 1982). Thus i t is rather surprising that
l i t t l e effort has been devoted to research other than the
final stages of compulsive gambling. It has also been quite
fashionable to specify one or two underlying causes of the
proclivity to gamble but in most instances these are merely
speculations and conjectures.
The major aim of the present thesis is to investigate
the characteristics of social gamblers. For the most part,
these gamblers are compared with non-gamblers rather than
compulsive gamblers. A more detailed inquiry is directed
towards a number of contradictory areas and other commonly
To begin with, an assessment of the personality
characteristics is carried out on a group of compulsive
gamblers, social gamblers and non-gamblers taken from an
adult non-student population. The personality measures used
are slightly different from the usual trend of employing
tests of specific traits in that the Cattell 16 Personality
Factors is used which represent a non-clinical measurement of
personali ty. The Eysenck Personality Inventory and the
Rotter's Internal-External Locus of Control Questionnaire are
also included to get a more complete picture and in an
attempt to replicate previous results. A more detailed
investigation of the locus of control construct follows the
personality study. High and low scorers on the locus of
control scale are compared on a number of risk-taking and
gambling related dimensions. One of the main purposes of the
exercise is to test the assumption of the riskiness preferred
by internals and externals.
A frequently stated characteristic of gamblers, that of
their being easily influenced by external stimuli is examined
from the perspective of gambling as a stimulus-bound
behaviour. Gambling activities are rarely carried out in
isolation from social or physical stimuli. One feature which
has received some attention is the influence of the presence
of other gambl ers (Bl ascovi c h, Veach 8. Gi ns burg, 1973;
Blascovich 8. Ginsburg, 1974; Blascovich, Ginsburg 8. Howe,
1976). Another concomitant feature, the importance of
gambling cues in actual monetary risk-taking, is explored.
This aspect of gambling has surprisingly been ignored
considering that commercial enterprises have taken advantage
of its effects for some time. Another inexplicable feature
acknowledge the fact that most gambling activity is sequential and that few people take less than 5 gambles
18
during a gambling bout. There are also contradicting reports on the importance of the outcome of previous bets on the
staking behaviour of the next bet. Related to this, the reinforcement history, a feature that is hypothesised to be influential in determining the staking behaviour is assessed. Finally, as a prelude to testing for arousal as a basis for explaining the participation in gambling activities, two different kinds of arousal are introduced. This also allows a comparison of the potency of such arousal in gambling
situations.
The final empirical section of the thesis is devoted to examining a new technique in the study of gambling behaviour. In order to overcome the deficiencies of laboratory studies and the difficulties of field studies i t is suggested that the cognitive aspects of gambling may be investigated by using the repertory grid technique. The versatility and applicability of the method is explored. Since luck and superstition have commanded such a prominent place in the gambling literature, an attempt is made to analyse their influence in gambling for those participating.
In the concluding chapters the results of the
CHAPTER TWO
PERSONALITY CHARACTERISTICS OF PATHOLOGICAL
GAMBLERS, SOCI AL GAMBLERS AND NON-GAMBLERS
Introduction
The analysis of the gambler has been made the object of
numerous studies by novelists and moralists and has served as
a popular theme for the theatre, but empirical studies have
been relatively scarce. Among the research carried out the
emphasis has been on two aspects of individual differences in
relation to gambling behaviour: 1. a basically
hypothesis-free comparison of gamblers and non gamblers on a
wide variety of personality and attitude measures and, 2. an
examination of traits which might be expected to account for
individual differences in their dispositions to gamble or
decision-making in gambling (Cornish, 1978). While i t is
acknowledged that the attribution of the cause or maintenance
of gambling to personality factors cannot be precisely
determined i t is, nevertheless, a useful starting point for
the investigation of differences among criterion groups.
In what was probably the first empirical study on the
personality characteristics of gamblers, Hunter & Brunner
(1928) administered the Bernreuter Personality Inventory and
the Colgate Introversion-Extraversion Scale to a large number
of avid college gamblers but found no common constellations.
In another psychometric study, McGlothlin (1954) tested women
poker players and showed that the gamblers scored better on
the social, home and emotional sections of the Bell
29
population. Those who scored poorly on the emotional section
also tended to believe in luck and superstitions rather
strongly but did not take more risks than the better adjusted
individuals. Morris (1957) classified 29 avowed college
gamblers into 3 categories; thrill, economic and other, using
Gough, McCloskey and Meehl's Scale for dominance and social
responsibility, the Gough Scale for psychological feminity
and the Maslow, Hirsh, Stein and Honigman Test for
security-insecurity. Gamblers were found to be more secure,
dominant, masculine, but less responsible and exhibited a
greater discrepancy between inner and outer selves.
Probably due to the inception of Gambler's Anonymous
(GA), a self-help organisation for pathological gamblers
modelled after Alcoholics Anonymous, in 1957, later
personality investigations have concentrated on pathological
gamblers who are members of GA. Roston (1961) found that
pathological gamblers are more hostile, aggressive,
rebellious, socially alienated, magical in their thinking,
less able to learn from experience, and show more obsessive
and compulsive thinking on the Minnesota Multiphasic
Personality Inventory (MMPI) and a slightly modified version
of the Rotter Level of Aspiration Board. In addition, Moran
(1979a) showed that pathological gamblers have higher
external and neuroticism scores on the Social Reaction
Inventory and the Eysenck Personality Inventory (EPI)
compared to the norms of the respective tests. More
recently, Dell, RU2icka 8. Palisi (1981> using the Millon
Multiaxial Clinical Inventory (MMCI) revealed that GA
members, in comparison with Millon's normative sample, are
more gregarious, narcissistic, aggressive and drug abusive,
(1980) found that GA members scored high on the extraversion
scale of the EPI and were more external on the Social
Reaction Inventory but were within the normal range for
impulsivity. Malkin (1981, cited in Dickerson, 1984) found
no differences between GA members and social gamblers on any
measure in the Myers-Brigg Locus of Control Scale, Both
Seager (1970) and Blaszczynski, McConaghy. Armstrong &.
Allcock (1982) showed that compulsive gamblers scored higher
than regular off-course bettors on the neuroticism scale of
the EPI.
In a study comparing the personality characteristics of
heavy gamblers, light gamblers, non-gamblers and lottery
players, Kusyszyn &. Rutter (1978) found that the two groups
of gamblers take more risks than both non-gamblers and
lottery players put together. The relationship between
risk-taking and the other attributes measured including;
effectance (Kusyszyn, 1976), hostility and aggression
(Jackson, 1967; 1971) was the same for all the four groups.
Kusyszyn &. Rubenstei n (1971) found that race track
gamblers are significantly more external than the norms of
the Rotter's I-E Scale. Using their Race Track Betting
Behaviour Questionnaire the authors were able to classify the
gamblers into four sub-groups: 1. the rational gambler has a
confident, practical, rational internally-controlled approach
to gambl i ng, 2. the soc i al gambl er is care free and fun
loving, bets on every race, believes in luck, and goes to the
track to enjoy himself, 3, the pathological gambler attends
races regularly, bets on every race, bets more money when
losing in order to recover his losses and feels badly after
having an unsuccessful day and is externally oriented and, 4.
according to a system without regard to luck. Kusyszyn & Rubenstein suggested that three of the four behaviour
patterns are similar to those of the poker players described
22
by Martinez & LaFranchi (1969). The other major study on the personality of race-track gamblers was carried out by Conrad in 1979. A number of tests were used including; the Rotter's I-E Scale, Crowne-Marlowe Social Desirability Scale and the S-R Inventory of Anxiousness. His results indicated that the pathological gambler has a lower level of defensiveness than the social gambler, but exhibited a higher level of anxiety and race-track gamblers are more externally oriented than non- gambl e rs.
The sparse research in this field has produced
inconclusive and, at times, contrary results. The present study attempts to further explore and clarify the personality characteristics of pathological gamblers and social gamblers. As a variation to the usual procedure a standard non-clinical personality test- the Cattell's 16 Personality Factor
Questionnaire (16 PF)- was used. The Eysenck Personality Questionnaire (EPQ) was included to assess its usefulness as a descriptive tool with respect to gamblers and whether
Horan's (1970a) results could be replicated by using a
shorter version of the EPI. The Rotter I-E Scale was used to examine the locus of control of gamblers and non-gamblers. In general, the previous results have indicated that gamblers are more defensive, hostile, aggressive and have a higher level of anxiety than non-gamblers. Gamblers also appear to believe more in luck and superstition and were shown to be externally oriented.
expect the scores on most of the relevant scales to lie on a
continuum with non-gamblers and GA members (pathological
gamblers) situated at the extremes and social gamblers
(social, non-problematic) in between. Thus, in line with
previous research and the Questionnaires used in this study.
GA members, and to a lesser degree social gamblers, were
expected to be more tense (Q4), apprehensive (0), suspicious
(L) and affected by feelings (e) compared with the control
group of non-gamblers, as measured by the 16 PF. GA members
and gamblers were also expected to score higher than
non gamblers on the P (insensitivity and hostility) and N
(worrying) Scales on the EPQ, and on the Rotter I-E Scale the
two groups of gamblers were expected to have a higher
Method
Subjects
Twenty male non-gamblers were recruited randomly from
ten different suburban areas of Christchurch City to serve as
control subjects, selected from every fiftieth home in the
telephone directory. This non-gambler group was defined as
those who bought only raffle or one dollar lottery tickets or
had gambled less than once a year. Individuals who gambled
at least once a week or wagered over an average of 10 percent
of their weekly gross income were defined as gamblers. The
gambler group was made up of 24 volunteers from a total of 32
males, randomly approached during an ordinary race-track
meeting. The third group consisted of a further 12
pathological gamblers who were members of the Christchurch
Gamblers Anonymous (GA members) including three recruited
from members of the GA group in Wellington. This group
consisted of self-admitted compulsive gamblers who had joined
a self-help organisation to alleviate their gambling problem.
Only male subjects were used since there was a notable
absence of females in the GA groups approached and because
the different orientations of gender towards gambling
activities (Downes et al., 1976) might introduce further
variance to the results.
Tests
Each subject was asked to complete five questionnaires.
The Cattell 16 Personality Factors (16 PF) and the Eysenck
Personality Questionnaire (EPQ) were used to explore possible
and the Rotter Internal-External Locus of Control Scale (I-E Scale) was used to determine locus of control. The problems associated with gambling were assessed by the Gamblers
Anonymous Gambl i ng Ques t i onnai re (GAGQ, see A ppe ndi x 1) whi ch consists of a set of 20 questions similar to those in the Michigan Alcohol Screening Test. The extent of gambling participation was measured by a Gambling Behaviour
Questionnaire (GBQ, see Appendix 2). The GA group was not required to f i l l in the GBQ since the major purpose of the questionnaire was to decide the allocation of the subjects into the respective groups and GA members automatically qualify as pathological gamblers. Furthermore, i t was an attempt to avoid embarrassment since members of GA are
required to abstain from gambling as part of their self-help therapy programme.
Procedure
All the non-gambler subjects were approached in their own homes and asked if they would take part in a gambling survey. Although both the gambler and pathological gambler groups were contacted elsewhere they were all tested
individually in their own places of residence. The nature of the tasks was then explained. If the subjects expressed
their willingness to participate they were presented with the two gambling questionnaires (GAGQ and GBQ), followed by the 16 PF, EPQ and I-E Scale. Only about 25 percent of all the people solicited declined to participate. Six subjects completed the EPQ and I-E Scale without the author present and returned them by post. One non-gambler, six social
26
Results
A t-test carried out on the GAGQ data to compare the
extent of the problem experienced by gamblers and GA members
due to their gambling activities was highly significant (t =
6.36, df = 32, P
=
.001). The GAGQ scores were analysedseparately since i t was only relevant to gamblers and GA
members. The mean number of positive responses to the
questions for gamblers was 4.0 and 12.5 for pathological
gamblers (seven positive responses or more to the 20
questions is indicative of problematic gambling according to
Gamblers Anonymous Organisation). As expec ted, GA membe rs
felt that gambling was more problematic to them than
gamblers. It should also be mentioned that in the course of
about one and a half years attendence (fortnightly) at GA
meetings the author observed that GA members, in their
gambling days, gambled more heavily and frequently than the
gamblers in this sample.
A multivariate analysis of variance (MANOVA) was carried
out separately on the four scales (P, E, Nand L) of the EPQ,
the 16 factors of the 16 PF and the Rotter I-E Scale. Each
personality factor or scale was treated as a variable. The
mean scores on each of the variable for the three groups of
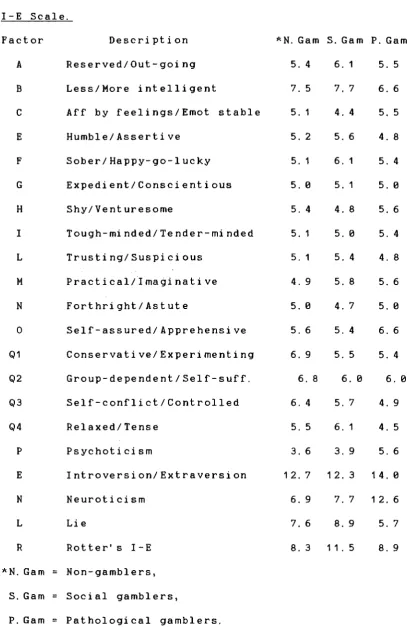
Table 1. The mean scores of non-gamblers, gamblers and pathological gamblers on the 16 PF, EPQ and Rotter's I -E Scale.
Factor A B C E F G H I L M N
o
Q1 Q2 Q3 Q4 P E N L R Description Reserved/Out-going Less/More intelligentAff by feelings/Emot stable Humble/Assertive Sober/Happy-go-lucky Expedient/Conscientious Shy/Venturesome Tough-minded/Tender-minded Trusting/Suspicious Practical/Imaginative Forthright/Astute Self-assured/Apprehensive Conservative/Experimenting Group-dependent/Self-suff. Self-conflict/Controlled Relaxed/Tense Psychoticism Introversion/Extraversion Neuroticism Lie
Rotter's I-E *N. Gam = Non-gamblers,
S. Gam = Social gamblers,
P. Gam = Pathological gamblers.
*N. Gam S. Gam P. Gam 5. 4
7. 5 5. 1 5. 2 5. 1 5.
e
5. 4
5. 1 5. 1
4. 9
5.
e
5. 66. 9
6. 8 6. 4
5. 5 3. 6 12. 7 6. 9
7. 6 8. 3
6. 1
7. 7 4. 4
5. 6 6. 1 5. 1 4. 8 5.
e
5. 4
5. 8
4. 7
5. 4
5. 5 6.
e
5. 7 6. 1 3.9 12. 37. 7 8. 9
11 . 5
5. 5
6. 6
5. 5 4. 8
5. 4
5.
e
5. 65. 4
4. 8 5. 6
5.
e
6. 6
5. 4
6.
e
4. 9 4. 5
5. 6
14.
e
12. 6
5. 7
8. 9
28
[image:42.566.67.475.86.714.2]Wilk's multivariate test of significance, (F (32,54) == 1.19,
p == 13.282 derived from Rao's (1973) formula of F test (Hull &
Nie, 1981>. The overall KANOVA for the EPQ data showed a
near significant result (F (8,88)
=
1.95, p = 8.863) usingthe same criterion (output in Appendix 4). A ONEWAY ANOVA
(Nie, Hull, Jenkins, Steinbrenner & Bent, 1975) of the I-E
data also showed a near significant result F (2,46) == 2.99, P
=
13.136, although not quite in the direction expected (outputin Appendix 4). Non-gamblers and GA members have fairly
similar scores with gamblers having the highest scores rather
than the scores getting progressively higher from
non-gamblers to gamblers to GA members (see Table 1).
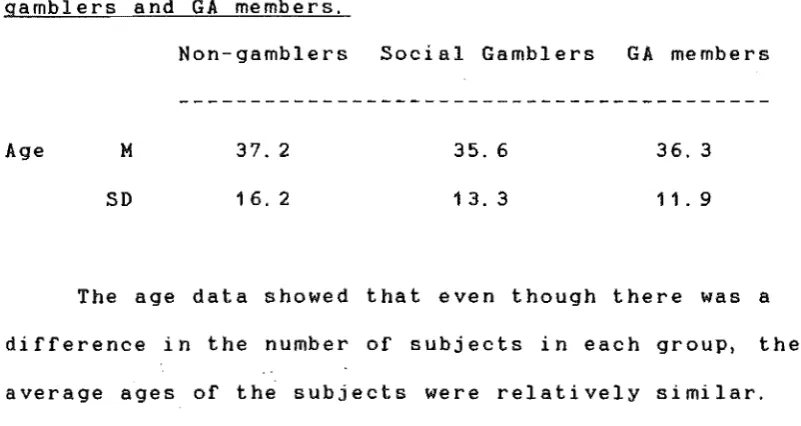
Fig. 1. The scores of non-gamblers, soclel gamblers
lmd
GA
members on the N scale of the EPQ
0'
a..
LIJ Q) .s:::. ,...J-
o Q) ..-(0 (.J (J)z
OJ .s:::. ,...J c: o (J) OJ L o U (J) 15 105
Non-gamblers
Social
gemblers
GA
members
The only significant result in the univariate F-tests
was that GA members scored significantly higher on the N
scale of the EPQ than both the gambler and non-gambler groups
[image:43.566.69.446.367.694.2]An analysis of the mean ages of the three groups of
subjects did not reveal any significant differences as shown
in Table 2.
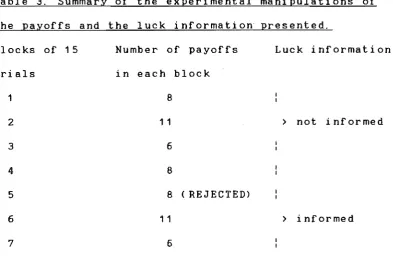
Table 2. The mean ages of non-gamblers, social
gamblers and GA members.
Age M
SD
Non-gamblers Social Gamblers GA members
37.2 16.2
35. 6
13. 3
36.3 11. 9
The age data showed that even though there was a
difference in the number of subjects in each group, the
average ages of the subjects were relatively similar.
[image:44.566.67.468.172.385.2]Discussion
Overall, the three groups did not differ appreciably on
most of the variables investigated, with one measure yielding
a significant difference and another a near significant
di fference. The three groups of GA members, gamblers and
non-gamblers scored relatively similarly on the factors of
the 16 PF in contrast with Carey's (1968) results which
showed that compulsive gamblers can readily be differentiated
from non-gamblers using the 16 PF.
This group of GA members was not a representative sample
of pathological gamblers. These individuals had taken the
initiative to do something about their problem by joining a
self-help group, although the motivation to do so might not
have been entirely voluntary (Livingston, 1974). Most of the
members in this sample had been involved with the GA group,
either in its formation or propagation. Thus, the GA group
consisted of people who were highly motivated to alleviate
their gambling problem. This probably illustrates the bias
when a sample is selected from a population receiving therapy
especially one which is voluntary and autonomous. However,
as long as generalisations are made with caution GA members
are the most readily available source of pathological
gamblers for study.
As expected, GA members experienced significantly more
problems than gamblers. This is hardly surprising given that
the amount of involvement in gambling by GA members is
considerably greater. The increased difficulties in the
lives of GA members may be attributed to the greater
frequency in gambling with high stakes. This inevitably