ΔNp63-driven recruitment of myeloid-derived
suppressor cells promotes metastasis in
triple-negative breast cancer
Sushil Kumar, … , Dmitry Gabrilovich, Rumela Chakrabarti
J Clin Invest.
2018;
128(11)
:5095-5109.
https://doi.org/10.1172/JCI99673
.
Graphical abstract
Research Article
Oncology
Find the latest version:
The Journal of Clinical Investigation
R E S E A R C H A R T I C L EIntroduction
Breast cancer is a devastating disease that, despite significantly advanced treatment options, claims around 50 million lives per year worldwide. Breast cancer is classified into subtypes based on the expression of estrogen receptor (ER), progesterone receptor (PR), and human epidermal growth factor receptor 2 (HER2) (1). Triple-negative breast cancers (TNBCs) that are ER–PR–HER2–
account for about 20% of all breast cancers, and their lack of receptors renders them insensitive to endocrine-targeted therapy (2). Despite an initial response to systemic chemotherapy, patients with TNBC follow an aggressive course of progression and metas-tasis (2, 3). Tumor relapse, resistance to chemotherapy, and metastases are more prevalent in TNBC compared with other sub-types of breast cancer (3, 4), all contributing to the poor prognosis of TNBC patients. In spite of several ongoing studies, the mech-anistic basis for the aggressive phenotype and higher metastatic potential of TNBCs remains unclear.
The progression and metastasis of solid tumors are influenced by the tumor microenvironment (TME), which is composed of tumor cells and other protumor stromal cells (5–7). Myeloid- derived immunosuppressor cells (MDSCs) are a major component of the TME, and their increased number in blood is associated
with poor patient survival (8, 9). In mice, MDSCs are a poorly dif-ferentiated and heterogeneous CD11B+Gr1+ population that can be
further divided into 2 subsets: polymorphonuclear (PMN-MDSCs; Ly6G+) and monocytic (M-MDSCs; Ly6C+) (9–11). In humans,
PMN-MDSCs are defined by immature myeloid markers: PMN-MDSCs are CD14–CD11B+CD33+CD15+LOX-1+ and CD66B+
cells, and M-MDSCs are CD14+HLA-DR–/lo cells (9). MDSCs
pro-mote tumor cell survival, angiogenesis, invasion into healthy tissues, and metastases (8, 9). MDSCs are produced in the bone marrow of tumor-bearing hosts and, in response to tumor-derived chemokines and hypoxia-induced factors, migrate to the primary tumor and metastatic niches to support metastases. While MDSCs in breast cancer have been evaluated in mouse models and circu-lating blood of patients, the distribution, number, and function of MDSCs in the TME of different subtypes of breast cancer are com-pletely unknown. As overrepresentation of MDSCs in aggressive cancers could potentially contribute to their metastatic nature, we set out to determine whether MDSCs increase dissemination and promote colonization of the premetastatic niche to promote metastasis and recurrence of TNBCs.
p63, a transcription factor of the p53/p63/p73 gene family, is transcribed from 2 different promoters, resulting in 2 isoforms: one that possesses a full-length transactivation domain analogous to that of p53 (the TA isoform), and one that possesses a distant activation domain (the ΔN isoform) (12–15). While TAp63 is con-sidered a tumor suppressor (16), ΔNp63 exhibits a predominantly oncogenic function in a number of cancers, including head and neck squamous cell carcinoma, in which it is primarily studied Triple-negative breast cancer (TNBC) is particularly aggressive, with enhanced incidence of tumor relapse, resistance to
chemotherapy, and metastases. As the mechanistic basis for this aggressive phenotype is unclear, treatment options are limited. Here, we showed an increased population of myeloid-derived immunosuppressor cells (MDSCs) in TNBC patients compared with non-TNBC patients. We found that high levels of the transcription factor ΔNp63 correlate with an increased number of MDSCs in basal TNBC patients, and that ΔNp63 promotes tumor growth, progression, and metastasis in human and mouse TNBC cells. Furthermore, we showed that MDSC recruitment to the primary tumor and metastatic sites occurs via direct ΔNp63-dependent activation of the chemokines CXCL2 and CCL22. CXCR2/CCR4 inhibitors reduced MDSC recruitment, angiogenesis, and metastasis, highlighting a novel treatment option for this subset of TNBC patients. Finally, we found that MDSCs secrete prometastatic factors such as MMP9 and chitinase 3–like 1 to promote TNBC cancer stem cell function, thereby identifying a nonimmunologic role for MDSCs in promoting TNBC progression. These findings identify a unique crosstalk between ΔNp63+ TNBC cells and MDSCs that promotes tumor progression and metastasis, which could be exploited in future
combined immunotherapy/chemotherapy strategies for TNBC patients.
Δ
Np63-driven recruitment of myeloid-derived suppressor
cells promotes metastasis in triple-negative breast cancer
Sushil Kumar,1 David W. Wilkes,1 Nina Samuel,1 Mario Andres Blanco,1 Anupma Nayak,2 Kevin Alicea-Torres,3 Christian Gluck,4
Satrajit Sinha,4 Dmitry Gabrilovich,3 and Rumela Chakrabarti1
1Department of Biomedical Sciences, School of Veterinary Medicine, University of Pennsylvania, Philadelphia, Pennsylvania, USA. 2Department of Pathology and Laboratory Medicine at the Hospital of the
University of Pennsylvania, University of Pennsylvania Perelman School of Medicine, Philadelphia, Pennsylvania, USA. 3The Wistar Institute, Philadelphia, Pennsylvania, USA. 4Department of Biochemistry,
State University of New York, Buffalo, New York, USA.
Conflict of interest: The authors have declared that no conflict of interest exists.
Submitted: January 5, 2018; Accepted: August 28, 2018.
License: Copyright 2018, American Society for Clinical Investigation.
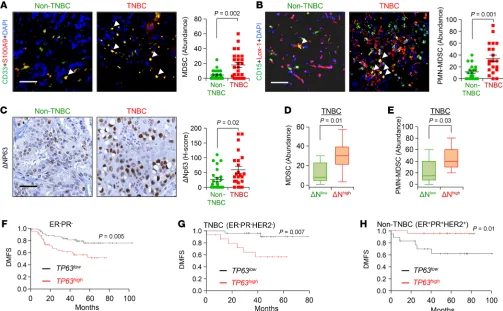
MDSC infiltration was related to ΔNp63 expression in breast cancer patient samples. Notably, we found that ΔNp63 is overexpressed in the basal subset of TNBCs compared with non-TNBCs, and that ΔNp63-enriched TNBCs express higher levels of the ΔNp63-target gene K14 (Figure 1C and Supplemental Figure 1, C–E). Increased K14 expression is associated with the basal subtype of TNBC (Sup-plemental Figure 1D), which has a greater mitotic index and is more aggressive than other subtypes (4, 28, 29).
Further analyses revealed a positive correlation between ΔNp63 and CD11B positivity (r = 0.49, P = 0.0001), ΔNp63 and MDSC (CD33+S100A9+) positivity (r = 0.54, P = 0.01), and
ΔNp63 and PMN-MDSC (CD15+LOX-1+) positivity (r = 0.34, P =
0.03) in TNBC tumors (Supplemental Figure 1F and Figure 1, D and E). In addition, we found a correlation (r = 0.62, P = 0.08) between ΔNp63 and K14 positivity in TNBC patient tumors, when TNBC patient tumors were stratified into ΔNp63-high- and ΔNp63-low-expressing tumors (Supplemental Figure 1G). Com-plementary assessment of ΔNp63 expression in TNBC patients stratified into K14-high and -low cohorts revealed a strong trend (P = 0.06) toward higher ΔNp63 expression by K14-high tumors (Supplemental Figure 1H). These data indicate that basal-like TNBCs have a higher tendency to express more ΔNp63. In con-trast, we did not observe any correlation between ΔNp63 status and MDSC status (r = 0.021, P = 0.927), PMN-MDSC status (r = 0.164, P = 0.404), or K14 status (r = 0.005, P = 0.98) in non- TNBC tumors (data not shown).
In complementary studies, we used human breast cancer cell xenografts from 2 human basal TNBC cell lines (HCC1806 and SUM159) and 1 human non-TNBC luminal cell line (MCF7). Sim-ilarly to human breast tumors, we found that TNBC xenografts contain greater numbers of MDSCs and ΔNp63+ and K14+ cells
compared with non-TNBC xenografts (Supplemental Figure 2, A–C). Finally, we found that high levels of TP63 significantly cor-relate with reduced distant metastasis–free survival (DMFS) in the ER–PR– and TNBC (ER–PR–HER2–) clinical breast cancer samples
in the Kaplan-Meier Plotter (KM Plotter) database (ref. 30 and Figure 1, F and G). In contrast, we observed an inverse correlation between TP63 and DMFS in non-TNBC (ER+PR+HER2+) patients
(Figure 1H) in the KM Plotter database. Similar trends were observed in an independent data set (the METABRIC study; refs. 31, 32), in which high TP63 expression correlates with worsened prognosis in ER– and PR– patients (Supplemental Figure 2, D and
E). Together, our data suggest that ΔNp63+ cells and MDSC
infil-trates are higher in the basal subset of TNBCs, and may be respon-sible for their greater incidence of metastasis.
Primary tumor growth, progression, and metastasis are depen-dent on ΔNp63 in human TNBC cells. To test the functional role
of ΔNp63 in TNBC tumor growth, progression, and metastasis, we performed shRNA-mediated ΔNp63 knockdown studies in HCC1806 and SUM159 TNBC cell lines, the former of which expresses both red fluorescent protein (RFP) and Renilla lucifer-ase to facilitate in vivo tracking (33). Isoform-specific knockdown (KD) of ΔNp63 was confirmed at both the mRNA and the protein level in HCC1806 (Figure 2A and Supplemental Figure 3A) using published isoform-specific shRNA (21). Knockdown of ΔNp63 had no effect on TAp63 in these cells (Supplemental Figure 3A). Mammary fat pad injection revealed a decrease in primary tumor (17–21). Our earlier studies showed that ΔNp63 maintains
nor-mal mammary stem cell activity, and its upregulation promotes TNBC/basal breast cancer initiation by regulating Wnt signaling (21). Additional recent reports corroborated the oncogenic func-tion of ΔNp63 in breast cancer via the Sonic hedgehog and Notch pathways (22, 23). However, it remains unclear whether the onco-genic effects of ΔNp63 act primarily in a tumor cell–autonomous manner or whether ΔNp63 also dictates changes in the TME that may promote the aggressive nature of TNBCs.
In this study, we observed that TNBCs express higher lev-els of ΔNp63 and have a greater number of PMN-MDSCs in the TME compared with non-TNBCs in both clinical samples and human breast cancer xenografts. Additionally, we found that ΔNp63 promotes metastasis and is responsible for CXCL2- and CCL22-dependent recruitment of MDSCs to the primary tumor and metastatic sites. Furthermore, blocking this signaling axis with chemokine receptor inhibitors decreases angiogenesis and metastatic events significantly. More surprisingly, treatment of MDSCs with chemokines (CXCL2/CCL22) induces their secre-tion of protumorigenic factors such as chitinase 3–like 1 (CHI3L1) and MMP9, which enhance the tumor growth and metastatic potential of TNBCs. Together, our study identifies a novel non-immunologic crosstalk between ΔNp63+ TNBC cells and MDSCs
that promotes invasion, angiogenesis, and metastasis in the basal subset of TNBCs and that may be exploited for future combination therapy to prevent MDSC expansion or recruitment.
Results
Greater MDSC infiltration correlates with increased ΔNp63 expres-sion in TNBC patients. The number and function of MDSCs in
the TME of breast cancer patients remain unknown, and it has yet to be determined whether overrepresentation of MDSCs in TNBCs may directly contribute to their aggressive phenotype. To determine whether MDSCs are enriched in TNBC patient samples, we first used a CD11B antibody that marks myeloid cells. H-score and abundance data based on immunohistochem-istry (IHC) indicated that human TNBC (ER–PR–HER2–) breast
cancer samples have higher CD11B+ myeloid infiltrates than
non-TNBC samples (ER+PR+HER2–/+) (P = 0.001) (Supplemental
Figure 1, A and B; supplemental material available online with this article; https://doi.org/10.1172/JCI99673DS1). These infil-trating myeloid cells were confirmed to be MDSCs in immuno-fluorescence assays using a combination of CD33 and S100A9 antibodies (24) (P = 0.002) (Figure 1A). Human MDSCs are CD11B+CD33+S100A9+ cells that can be further divided into a
granulocytic subtype (PMN-MDSCs, also known as G-MDSCs) that coexpresses CD15 and LOX-1 (25) and a monocytic subtype (M-MDSCs). As we found an increased number of dual-positive CD15+LOX-1+ cells (25) in TNBC compared with non-TNBC (P =
0.001) patients (Figure 1B), our data suggest that TNBC patient tumors have more PMN-MDSCs than do non-TNBC patients.
The Journal of Clinical Investigation
R E S E A R C H A R T I C L E2F and data not shown), a finding confirmed by the reduced ratio of human genomic DNA to mouse genomic DNA by quantitative PCR (Supplemental Figure 3, J–K). While we cannot rule out the possi-bility that the decreased numbers of CTCs are due to decreased tumor growth, these data are consistent with reduced CTC dissem-ination in ΔNp63-KD TNBC cell–injected mice.
To further test the role of ΔNp63 in metastasis, we injected control and ΔNp63-KD HCC1806 TNBC cells by tail vein and evaluated their ability to colonize and survive in distant organs (Figure 2G). HCC1806 TNBC metastasizes to several organs, including liver, lung, and lymph nodes (33), and we found that decreased levels of ΔNp63 reduce metastases to all of these sites (Figure 2G and Supplemental Figure 4, A and B). In addition, we found that bone metastasis was dramatically reduced or com-pletely absent in ΔNp63-KD HCC1806 cells (Supplemental Fig-ure 4C). In parallel, tail vein injection of control and ΔNp63-KD SUM159 cells showed reduced lung metastasis in ΔNp63-KD SUM159 TNBC cells (Supplemental Figure 4D), supporting a vital function of ΔNp63 in metastasis.
[image:4.585.44.547.57.368.2]growth from ΔNp63-KD HCC1806 (Figure 2, B and C), as well as reduced metastatic events of ΔNp63-KD HCC1806 cells com-pared with the control (Figure 2, D and E, and Supplemental Figure 3B). This phenotype was also associated with reduced spleen size in mice injected with ΔNp63-KD HCC1806 cells (Supplemental Figure 3C). Similar findings were observed in an additional TNBC cell line, SUM159 (Supplemental Figure 3, D–G). Unlike HCC1806 cells, SUM159 cells form small microscopic metastatic lung nod-ules as seen by anti-GFP antibody staining (Supplemental Figure 3H), which can be further augmented by resection of primary tumors. We clearly find that the macrometastasis-forming capabil-ity of SUM159 in lungs after resection is significantly reduced by ΔNp63-KD cells (Supplemental Figure 3I). To determine whether early stages of metastasis are affected by ΔNp63 loss, we exam-ined the disseminated tumor cells, also known as circulating tumor cells (CTCs), in blood of tumor-bearing mice. Short-term culture of CTCs from peripheral blood showed a significant decrease in the number of tumor cells in mice injected with ΔNp63-KD HCC1806 and SUM159 cells compared with their respective controls (Figure
Figure 1. TNBC contains higher MDSC infiltration and high expression of ΔNp63, which is associated with reduced distant metastasis–free survival of human patients. (A and B) Representative immunofluorescence (IF) images (left) and calculated abundance (right) for CD33 and S100A9 (A) and CD15 and Lox-1 (B). Increased costaining of CD33 and S100A9 (yellow) in TNBC patients indicates increased MDSCs in these patients. Increased costaining of Lox-1 and CD15 (yellow cells indicated with white arrowheads) further confirms that MDSCs in TNBC are PMN-MDSCs. (C) Representative IHC images (left) and calculated H-score (right) for ΔNp63 expression in patient tissues. The H-score value is the product of abundance of cells expressing respective protein (scale of 0–100) multiplied by the intensity of expression of that protein (scale of 0–3). (D and E) Box plot shows higher infiltration of MDSC (D) and PMN-MDSC (E) positivity in ΔNp63-high (ΔNhigh) than in ΔNp63-low (ΔNlow) human TNBC tumor samples. ΔNhigh and ΔNlow patients were stratified based on being above
or below the median of ΔNp63 H-score in C. (A and B) Non-TNBC, n = 21 patient samples; TNBC, n = 22 patient samples. (D and E) TNBC, n = 22 patient samples. (F–H) High p63 (TP63) expression correlates with reduced distant metastasis–free survival (DMFS) in ER–PR– (F), TNBC (G), but not non-TNBC (H)
with control, suggesting that ΔNp63 is an important basal cell fate regulator (Supplemental Figure 5, E and F). Furthermore, reduced tumor cell proliferation (marked by Ki67) was observed in tumors from ΔNp63-KD HCC1806 cells and ΔNp63-KD SUM159 cells compared with control cells, suggesting that reduced proliferation may be responsible for reduced tumor growth in ΔNp63-KD cells (Supplemental Figure 5, G and H).
Angiogenesis positively correlates with metastasis, and ΔNp63 promotes tumor angiogenesis in pediatric neuroblastoma, osteo-sarcoma, and squamous cell carcinoma (34–36). Therefore, we assessed the expression of CD31 and CD34, markers for angiogen-esis, as well as smooth muscle actin (SMA) (37) in HCC1806 and SUM159 primary tumors. The number of CD34+ and CD31+ blood
vessels (as a measure of microvascular density [MVD]) was
signifi-Loss of ΔNp63 leads to dramatic alteration of tumor cell fate and reduced proliferation, immune infiltrate, and angiogenesis in TNBC.
[image:5.585.37.539.56.403.2]Breast cancer growth and progression are regulated by a complex interplay between tumor cells and the TME, the latter of which has a dramatic impact on tumor growth, progression, and metastasis (5–7). This interaction is reciprocal, as cancer cells also shape the TME for tumor and metastasis-promoting effects. Notably, H&E staining analysis of the primary tumors generated by HCC1806 and SUM159 TNBC cells revealed massive infiltration of leukocytes to the control xenograft tumors in comparison with the tumors from ΔNp63-KD HCC1806 cells and ΔNp63-KD SUM159 cells (Sup-plemental Figure 5, A and B), which were further confirmed with staining with CD45 antibody (Supplemental Figure 5, C and D). We also observed reduced K14+ cells in ΔNp63-KD TNBCs compared
Figure 2. ΔNp63 promotes tumor growth, progression, and metastasis in human TNBC. (A) Western blot shows ΔNp63 (ΔN) protein expression in control and ΔNp63-KD HCC1806 cells after shRNA lentivirus vector–mediated knockdown (KD). (B) Red fluorescence (RFP) and Renilla luciferase–expressing control and ΔNp63-KD HCC1806 cells (2 × 10⁵) were injected into the mammary fat pad of nude mice. Representative mouse images (left) and tumor
growth (right; total flux, photons per second [p/s]) show bioluminescent signal from tumors in vivo. (C) Tumor growth curves show data of palpated tumor growth of indicated groups. (B and C) n = 10 tumors per group. Contralateral mammary glands (4th position) of n = 5 mice per group were used for injection. (D and E) Control and ΔNp63-KD HCC1806 tumor-bearing mice show in vivo (D) and ex vivo (E) lung metastasis by bioluminescence imaging. Ctrl, n = 6 mice per group; ΔN-KD, n = 4 mice per group. (F) Bright-field and fluorescence images show RFP+ circulating tumor cells (CTCs) after culture. CTCs were
isolated from blood of control and ΔNp63-KD HCC1806 xenograft-bearing mice and cultured for 1 week. n = 5 mice per group. (G) HCC1806 cells (2 × 10⁵)
were injected into the bloodstream of NSG mice via tail vein to study metastasis; a representative image of RFP+ lung metastatic nodules is shown (G, left,
red arrows). Quantification of metastatic RFP+ nodules of indicated groups is shown at right. The insets show H&E images of sections of lung, showing
The Journal of Clinical Investigation
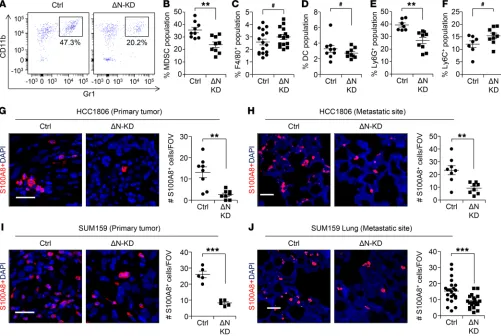
R E S E A R C H A R T I C L Econtrol and ΔNp63-KD xenograft tumors of TNBC. Flow cytomet-ric analysis using CD45, CD11B, and Gr1 antibodies revealed that the CD45+ immune cell infiltrate was predominantly MDSCs
(Fig-ure 3, A and B) and that it was significantly reduced in ΔNp63-KD tumors compared with control. In contrast, no significant difference was observed between macrophages (CD45+F4/80+) and
dendrit-ic cells (CD45+CD11c+) (Figure 3, C and D). Further
characteriza-tion of tumor-infiltrating MDSCs using Ly6G and Ly6C antibod-ies indicated that the affected MDSCs were Ly6G+ PMN-MDSCs
(CD11B+Ly6G+Ly6Clo) and not Ly6C+ M-MDSCs (Figure 3, E and
F), supporting human patient IHC data (Figure 1, A and B). Addi-tionally, we found that ΔNp63 promotes PMN-MDSC infiltration at metastatic sites such as the lung (Supplemental Figure 7, A–G). Similarly to the primary tumor, other immune populations remain unchanged at lung metastatic sites in tumor-bearing mice from ΔNp63-KD HCC1806 injected cells compared with control (Sup-plemental Figure 7, D and E). Peripheral blood analysis indicated reduced numbers of MDSCs in ΔNp63-KD tumor-injected mice cantly reduced in ΔNp63-KD tumors compared with control TNBC
tumors (Supplemental Figure 6, A–D). Evaluation of microvascular integrity (MVI) using CD34+/SMA+ or CD31+/SMA+ costaining of
blood vessels revealed reduced CD34+SMA+ or CD31+SMA+
(dou-ble-positive) blood vessels in TNBC tumor xenografts (Supplemen-tal Figure 6, A–H), indicating poor vessel quality that could poten-tially lead to intra/extravasation of tumor cells that could permit metastasis. Notably, loss of ΔNp63 led to an increase in CD34+
S-MA+ or CD31+SMA+ (double-positive; white arrowheads) blood
ves-sels compared with control (Supplemental Figure 6, A–H), indicat-ing that ΔNp63 may regulate both MVD and MVI in TNBC. Taken together, our studies demonstrate that ΔNp63 influences leukocyte recruitment, proliferation of tumor cells, cell fate, and angiogenesis, all of which could contribute to the aggressive nature of TNBC.
ΔNp63 promotes recruitment of MDSCs at the primary tumor and metastatic sites. Given the strong positive correlation between
[image:6.585.44.545.58.394.2]ΔNp63 expression and PMN-MDSC infiltration in TNBC patient samples (Figure 1, A–E), we next analyzed the immune infiltrates in
Figure 3. ΔNp63 promotes recruitment of MDSCs at primary tumor and metastatic site. (A) Flow profile of CD45+ population of control and ΔNp63-KD
HCC1806 tumor based on the staining of CD11B and Gr1 markers shows MDSC population. Fluorescence Minus One (FMO) negative control is shown in Supplemental Figure 7A. (B–D) Flow cytometric analysis depicts percentage of MDSCs (CD11B+Gr1+F4/80–) (B), macrophages (CD45+F4/80+) (C), and
den-dritic cells (DCs; CD45+CD11c+) (D) in primary tumors of indicated groups. (E and F) Flow cytometric analysis depicting MDSC subpopulations: PMN-MDSCs
(CD45+CD11B+Ly6G+) (E) and M-MDSCs (CD45+CD11B+Ly6C+) (F). n is indicated in scatter plots for different groups in B–F. (G and H) Representative IF images
show S100A8+ stained myeloid cells at the primary tumor (G) and metastatic site (H) of control and ΔNp63-KD HCC1806 cells. Scatter plots to the right
show quantification of S100A8+ cells per FOV. (I and J) IF images show myeloid cells in primary tumor (I) and at metastatic site (J) of control and ΔNp63-KD
SUM159 cells. Scatter plots to the right show quantification of S100A8+ cells. Scale bars: 40 μm (G–J). **P < 0.01, ***P < 0.001, #NS. Data are presented as
compared with control (Supplemental Figure 7H), suggesting that loss of ΔNp63 reduces recruitment of MDSCs from bone marrow. These results were further confirmed by staining of primary tumor and metastatic lung with the myeloid marker S100A8 antibody, which demonstrated that myeloid cells were reduced in ΔNp63-KD primary and metastatic tumors from HCC1806 (Figure 3, G and H) and SUM159 cells (Figure 3, I and J) compared with control.
As PMN-MDSCs phenotypically resemble neutrophils (24), we next confirmed that the CD45+CD11B+Gr1+ populations we
identified represent bona fide MDSCs by performing in vitro T cell proliferation assays — an established functional test for MDSCs. Our data clearly show reduced T cell proliferation following addi-tion of CD45+CD11B+Gr1+ MDSCs from the primary mammary
tumor and spleen (Supplemental Figure 7I) of tumor-bearing mice. Moreover, MDSCs isolated from these xenograft tumors suppressed T cell function, as seen by reduced intracellular IFN-γ expression in T cell coculture assays (Supplemental Figure 7, J and K). Finally, H&E analysis showed that these MDSCs exhibit an immature granulocytic morphology similar to that of PMN-MD-SCs (Supplemental Figure 7L). Taken together, our data indicate that PMN-MDSCs are specifically recruited to primary and meta-static lung TNBC tumors in a ΔNp63-dependent manner.
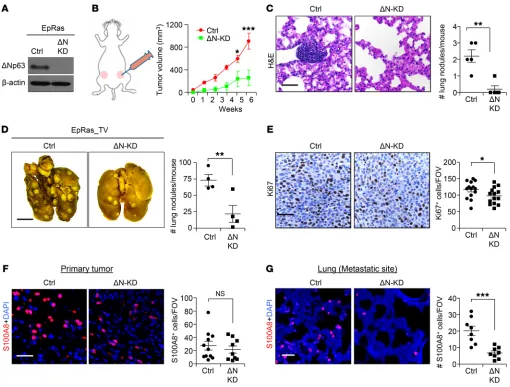
[image:7.585.36.546.54.441.2]Loss of ΔNp63 reduces primary tumor growth and metastasis in mouse TNBC cells. To rigorously test the function of ΔNp63 in tumor growth and metastasis, we next extended our study to a mouse breast cancer cell line that could be evaluated in syngeneic
Figure 4. ΔNp63 promotes tumor growth, progression, and metastasis in mouse TNBC. (A) Western blot shows ΔNp63 (ΔN) protein expression in EpRas cells after shRNA lentivirus vector–mediated knockdown (KD). (B) EpRas control and ΔNp63-KD EpRas cells (5 × 10⁴) were injected into the mammary fat
pad of BALB/c mice. Schematic shows experimental approach (left) and tumor growth curve (right). Ctrl, n = 8 tumors; ΔN-KD, n = 6 tumors. (C) Represen-tative H&E images of lung show metastatic nodule of indicated groups. n = 5 mice per group. (D) EpRas cells (2 × 10⁴) were injected into the bloodstream
of BALB/c mice via tail vein (TV) to study metastasis. Representative images show lung nodules (left), and scatter plot (right) represents quantification. (E) Representative IHC images show the expression of cell proliferation (Ki67) in control and ΔNp63-KD EpRas primary tumors. Scatter plots (right) rep-resents quantification. (F and G) Representative IF images show myeloid cell infiltration (S100A8) in the primary tumor (F) and lung metastatic site (G). Scatter plots (right) represent quantification of S100A8+ myeloid cells. (B) Two-way ANOVA was performed followed by Bonferroni post-test to compute P value. (C) Mann-Whitney U test was used to compute P value. (D–G) Student’s t test was used to compute P values. Scale bars: 40 μm (C and E–G) and 500 μm (D). Data are presented as the mean ± SEM. *P < 0.05, **P < 0.01, ***P < 0.001, #NS. (E–G) n = 3 samples were used, and several random fields per
The Journal of Clinical Investigation
R E S E A R C H A R T I C L Eimmune-competent BALB/c mice. The EpRas cell line is derived from mouse EpH4 cells, which constitutively express oncogenic Ras and are ER–/lo and PR–/lo (ref. 38 and Supplemental Figure 8A).
We generated 2 independent shRNAs that specifically target mouse ΔNp63 and behaved similarly in functional assays (21) and
[image:8.585.43.550.57.508.2]contin-ued with 1 knockdown construct (referred to as ΔN-KD) (Figure 4A and Supplemental Figure 8B). Knockdown of ΔNp63 had no effect on TAp63 in the EpRas cells (Supplemental Figure 8B). Similar to previous results with human TNBC cells (Figure 2), we found signif-icant reduction in primary tumor growth (Figure 4B), mouse spleen
KD cell lines. Corroborating our IHC data (Supplemental Figure 5, E and F), gene set enrichment analyses showed a decreased basal cell signature in ΔNp63-KD TNBC cells compared with control (Figure 5A). Additionally, we identified several genes belonging to the IFN and chemokine signaling pathways that were significantly downregulated in ΔNp63-KD HCC1806 and ΔNp63-KD SUM159 cells compared with controls (Figure 5, B and C). Chemokines promote MDSC infiltration in multiple cancers, including breast cancer (42, 43), and regulate cancer cell proliferation and metas-tasis, and their expression is associated with increased angiogen-esis, a strong indicator of tumor invasiveness and metastasis (42, 43). Hence, we focused on chemokines (CXCL2, CXCL3, CXCL10,
CCL5, CCL17, and CCL22) that were differentially expressed in
ΔNp63-KD HCC1806 and ΔNp63-KD SUM159 compared with control cells (Figure 5D) and/or differentially expressed in human and mouse TNBC cell lines (Figure 5, E–G) with reduced ΔNp63 compared with control. Examination of ΔNp63 ChIP-Seq data from HCC1806 cells revealed several p63-binding sites in the enhancer regions of 2 of these chemokines, CXCL2 and CCL22 (Figure 5H), strongly indicating that they are direct targets of ΔNp63. As chemokines are often secreted from the tumor to recruit MDSCs, we next determined whether these ΔNp63-dependent chemok-ines were secreted using chemokine array blots and ELISA (Figure 5, I and J). Both CXCL2 and CCL22 were significantly decreased in media supernatants from ΔNp63-KD cells compared with the control (Figure 5, I and J, and data not shown), confirming loss of functional protein for these chemokines in ΔNp63-KD TNBCs. To evaluate the relationship between ΔNp63 and CXCL2/CCL22 in the clinical setting, we interrogated a human breast cancer TCGA data set (30) and found that CXCL2 and CCL22 expression posi-tively correlate with TP63 in ER–PR–HER2– TNBC patients but not
in non-TNBC patients (Supplemental Figure 11, A and B, and data not shown). Consistently, we found that high levels of CXCL2 cor-relate with reduced DMFS in TNBC patients (P = 0.05), but not in non-TNBC samples (Supplemental Figure 11, C and E). TNBC patients expressing CCL22 showed a similar trend (P = 0.406; Supplemental Figure 11D); however, the data did not reach statis-tical significance because of a relatively small sample size of met-astatic TNBC patients in this data set. Interestingly, higher CCL22 levels are significantly associated with better patient survival in non-TNBC patients (P = 0.002; Supplemental Figure 11F), suggest-ing a subtype-specific effect of CCL22. Taken together, our data demonstrate that CXCL2 and CCL22 are direct targets of ΔNp63 in TNBCs and may contribute to poor TNBC patient survival.
To verify that migration/recruitment of MDSCs is promoted by ΔNp63-dependent chemokines, we performed in vitro che-motaxis assays using supernatants from HCC1806, SUM159, and EpRas (human and mouse TNBC) cells. A strong migratory activity was observed in mouse MDSCs (CD11B+Gr1+) in response
to supernatants from both human (HCC1806 and SUM159) and mouse (EpRas) cell lines compared with media control (Figure 5, K–M). Notably, this effect was dependent on ΔNp63, as ΔNp63-KD HCC1806 (human) and ΔNp63-KD EpRas (mouse) cells failed to promote migratory activity compared with control cells (Figure 5, N and O). Additional MDSC chemotaxis assays using mouse splenic or tumor MDSCs and purified human CXCL2 and CCL22 ligands revealed a significant increase in MDSC migration with size (Supplemental Figure 8C), and spontaneous lung metastasis
(Figure 4C) in ΔNp63-KD EpRas cells compared with control. We found a significant decrease in the number of CTCs in the periph-eral blood of mice injected with ΔNp63-KD EpRas cells compared with control (Supplemental Figure 8D), supporting earlier data with human breast cancer cells (Figure 2F). Moreover, tail vein injection of ΔNp63-KD EpRas cells generated significantly fewer lung metastatic nodules compared with control cells (Figure 4D). Extensive analysis of the primary tumor demonstrated decreased expression of the basal marker (K14) and increased expression of the luminal marker, K8, in ΔNp63-KD EpRas cells (Supplemental Figure 8, E–H, and data not shown), similar to our observations in human TNBC xenograft models. ΔNp63-KD tumors also showed a significant decrease in Ki67 expression compared with con-trol tumors (Figure 4E). As there was no significant difference in proapoptotic cleaved caspase-3 expression between control and ΔNp63-KD tumors (data not shown), decreased proliferation like-ly accounts for the slower tumor growth. Angiogenesis (both MVD and MVI) was altered in ΔNp63-KD tumors compared with control tumors (Supplemental Figure 8, I–L), indicating an indispensable role for ΔNp63 in TNBC tumor angiogenesis. Finally, quantitative PCR on ΔNp63-KD tumors demonstrated reduced levels of angio-poietin 2, an important factor for neovascularization (39) (Supple-mental Figure 8M), in comparison with control tumors.
Histological analyses demonstrated that ΔNp63-KD tumors had fewer CD45 leukocytes than controls (Supplemental Fig-ure 9A), corroborating earlier human xenograft tumors. Final-ly, immunofluorescence analysis confirmed that these immune cells were S100A8+ myeloid cells and that they were reduced in
ΔNp63-KD primary and metastatic tumors compared with control (Figure 4, F and G). Reduction of S100A8+ cells in primary tumors
was further confirmed by quantitative PCR (Supplemental Figure 9B). Additionally, we found that ΔNp63 promotes PMN-MDSC (CD11B+Ly6G+Ly6Clo) infiltration at primary tumor and
meta-static lung (Supplemental Figure 9, C–N), while other immune populations, including T cells and NK cells, remain unchanged (Supplemental Figure 9, C, E–I, and K–N). These data indicate that loss of ΔNp63 alters the TME of TNBCs by reducing the number of MDSCs (independent of T cell and NK cell suppression) and angiogenesis, which may lead to reduced metastasis.
We next evaluated whether the protumorigenic function of ΔNp63 is restricted to TNBCs. For this, we overexpressed ΔNp63 in WTB cells derived from an MMTV-PyMT–derived luminal breast cancer model (40, 41), which have low endogenous levels of ΔNp63 (Supplemental Figure 10, A and B). Notably, this overexpres-sion did not alter tumor growth significantly (Supplemental Figure 10C). However, expression of the basal cell marker K14 increased in ΔNp63-overexpressing WTB tumor cells compared with con-trol (Supplemental Figure 10, D and E), supporting its function as a strong driver of basal cell fate. Taken together, these data suggest that ΔNp63 specifically promotes TNBC tumor growth, progression, and metastasis in both immune-competent and immunocompromised mice and that its loss reduces MDSC infiltration and angiogenesis.
ΔNp63 directly regulates CXCL2 and CCL22 to promote MDSC recruitment in TNBC. To investigate the molecular mechanism for
Np63-The Journal of Clinical Investigation
R E S E A R C H A R T I C L EBlockade of MDSCs by chemokine receptor inhibitors reduces recruitment of MDSCs and reduces metastasis in TNBC. To test the
functional significance of increased MDSCs in TNBC, we blocked MDSCs in vivo using 2 independent experimental strategies. First, we performed mammary fat pad injection of HCC1806 TNBC cells in the presence and absence of well-established CXCR2 (SB 225002, Tocris) and CCR4 inhibitors (C021, Tocris) (Supplemen-tal Figure 12A). While there was no significant decrease in tumor initiation and growth of treated HCC1806 tumors compared with both CXCL2 and CCL22, which could be blocked by inhibitors of
their cognate receptor (CXCR2 and CCR4), respectively (Figure 5P). Quantitative PCR confirmed higher expression of the chemo-kine receptors CXCR2 and CCR4 in MDSCs compared with tumor cells (Figure 5Q), suggesting paracrine signaling between MDSCs and ΔNp63+ TNBC cells. SB 225002 and C021 (Tocris) are
[image:10.585.43.553.55.496.2]well-es-tablished CXCR2 and CCR4 inhibitors (44, 45). Collectively, our data indicate that the ΔNp63-dependent chemokines CXCL2 and CCL22 are responsible for recruitment of MDSCs in TNBC.
Figure 6. Blockade of MDSC recruitment inhibits metastasis. (A, left) Representative lung images of tumor-bearing mice show RFP+ nodules (red arrows)
upon indicated treatments. HCC1806 tumor cells (2 × 10⁵) were injected into mice. Treatment of mice was started 2 days before injection of tumor cells. (A,
right) Flow analysis shows the quantification of metastasized RFP+ tumor cells to the lung. (B) Representative IHC images of primary tumor show CD31+
blood vessels in treated and untreated HCC1806 tumors; quantification is shown at right. (C) HCC1806 tumor cells (2 × 10⁵) were injected into the tail vein
of NSG mice. RFP+ metastatic lung nodules upon indicated treatments are shown (red arrows). Quantification of RFP+ metastatic lung nodules is shown
at right. (D) Representative IF images show the recruitment of S100A8+ cells in the lung upon tail vein injection of HCC1806 cells with indicated treatment
(left) and quantification of S100A8+ cells (right). Tumor cells are stained with K14 (green). n is indicated in scatter plots. Scale bars: 500 μm (A and C) and
showed no difference in the number of either Ki67+ proliferating
cells (Supplemental Figure 12H) or cleaved caspase-3+ apoptotic
cells compared with control (data not shown), in agreement with our finding that primary tumor growth was not significantly affect-ed by treatment. However, the number of CD31+ blood vessels was
significantly reduced by treatment (Figure 6B), supporting the well-established function of MDSCs in angiogenesis (46, 47). In parallel, tail vein injection studies using control HCC1806 along with CXCR2 and CCR4 inhibitors showed significantly fewer met-untreated control tumors (Supplemental Figure 12, B and C), there
was a significant decrease in Ly6G+ MDSC recruitment to the
pri-mary tumor site (Supplemental Figure 12, D and E) and a signifi-cant reduction in the number of lung metastatic lesions in treated mice compared with controls (Figure 6A). The total percentage of Ly6G+ PMN-MDSCs in blood increased upon inhibitor
[image:11.585.40.531.53.498.2]treat-ment (Suppletreat-mental Figure 12, F and G), suggesting that in the absence of CXCR2 and CCR4 signaling, MDSCs lose their abili-ty to migrate to metastatic sites. IHC on treated primary tumors
Figure 7. MDSCs secrete prometastatic factors and enhance CSC activities of TNBC. (A and B) Number (A) and representative images (B) of tumorspheres from HCC1806 cells cultured for 3 days with or without MDSCs. (C and D) Number (C) and representative images (D) of tumorspheres from SUM159 cells cul-tured for 3 days with or without MDSCs. (A–D) n = 3 independent experiments performed in technical duplicate. (E) Representative images of cytokine arrays from cell lysates of normal mammary neutrophils (from mammary gland) and MDSCs from primary mammary tumor. (F) Table shows the most differentially expressed proteins. (G) Representative array blots show differential protein expression upon treatment of MDSCs with recombinant CXCL2 and CCL22 for 12 hours. (H) Scatter plot shows number of tumorspheres from HCC1806 cells upon indicated treatments. Scatter plot show data from 3 independent experi-ments, and data are presented as the mean ± SEM. (I) Model shows the recruitment of PMN-MDSCs at primary tumor and at metastatic organ via ΔNp63+
The Journal of Clinical Investigation
R E S E A R C H A R T I C L Eby MDSCs and their function in TNBCs had not yet been explored. Here, we find that addition of CHI3L1 and MMP9 lead to a dra-matic increase in the number of tumorspheres, demonstrating the CSC-promoting function of these prometastatic secreted factors in TNBCs (Figure 7H). These data indicate a novel nonimmunologic function of MDSC-expressed CHI3L1 and MMP9 in promoting the ΔNp63+ CSC activity of TNBCs.
Discussion
The plasticity and heterogeneity of TNBC cells make them dif-ficult to target therapeutically. However, as the TME plays an important role in dictating the fate of cancer cells (5–7, 53), enthu-siasm for therapeutically targeting this population in combination with antitumor therapy is increasing. Immune cells within the TME play an essential role in tumor progression and metastasis. While increased numbers of MDSCs in circulating blood correlate with tumor burden, stage of tumor, and metastasis in breast can-cer patients, their representation within the TME and the potential role of tumor-associated MDSCs in driving the aggressive nature and metastasis of TNBC remained unknown. In this study, for the first time to our knowledge, we showed that PMN-MDSCs are increased in the more aggressive TNBC subset compared with the non-TNBC subset. Furthermore, our data showed that more PMN-MDSCs are present in basal-like TNBC, the most aggressive subset of TNBC (28, 29), which also has increased expression of ΔNp63 protein. Moreover, high levels of p63 (predominantly the ΔNp63 isoform) (21) correlate with reduced metastasis-free sur-vival in TNBC patients. Our functional data demonstrated that ΔNp63 promotes tumor progression and metastasis by recruiting MDSCs to the TME of both human and mouse TNBCs. This effect is TNBC-specific, as overexpression of ΔNp63 in non-TNBCs was unable to promote tumor growth or angiogenesis. However, the fate of basal K14+ cells in non-TNBCs was altered when ΔNp63
was overexpressed, corroborating earlier data that ΔNp63 is a major driver of basal cell fate (21). MDSCs contribute to metas-tases by aiding in the formation of the premetastatic niche and promoting angiogenesis and tumor cell invasion (47, 54). Our data support this notion and demonstrate that loss of ΔNp63 in TNBCs is associated with reduced angiogenesis, marked by reduced ves-sel density and increased vesves-sel integrity. Finally, the metasta-sis-promoting function of ΔNp63 in TNBC was confirmed in both mammary fat pad and experimental tail vein injection assays that bypass the primary tumor growth effect. Overall, our study clearly established that ΔNp63 promotes TNBC tumor growth, progres-sion, angiogenesis, and metastasis, including extravasation to peripheral blood and colonization in distant metastatic organs.
Mechanistically, our studies demonstrate that ΔNp63 pro-motes MDSC recruitment to primary and metastatic sites by tran-scriptionally activating chemokines such as CXCL2 and CCL22. Notably, CXCL2 and CCL22 expression positively correlates with
TP63 and is associated with poor DMFS in TNBC patients,
support-ing the clinical relevance of our findsupport-ings. Interestsupport-ingly, CXCL2/
CCL22 was associated with improved DMFS in non-TNBC
patients, suggesting a TNBC-specific function of ΔNp63/CXCL2/ CCL22 signaling in MDSC recruitment and metastasis. Indeed, functional studies demonstrate that blocking CXCR2/CCR4 inhibits angiogenesis and metastasis in TNBC, phenocopying astatic events at multiple distal organs, including lung, compared
with control, phenocopying the ΔNp63-KD HCC1806 cells (Fig-ure 6C and Supplemental Fig(Fig-ure 13, A–D). As expected, recruit-ment of MDSCs (as seen by reduced S100A8+ cells) was greatly
reduced by either CXCR2 or CCR4 inhibitors or by reduced levels of ΔNp63 (Figure 6D). Taken together, our data indicate that, as with ΔNp63-KD HCC1806 cells, blocking CXCR2 and CCR4 pre-vents MDSC recruitment to tumor sites, leading to reduced angio-genesis and metastasis.
Nonimmunologic function of MDSCs promoting cancer stem cells in TNBC. Although MDSCs suppress immune T and NK cell
prolif-eration (8, 9), recent studies show that they may also function in an immune-independent fashion to enhance cancer stem cells (CSCs) in pancreatic and ovarian cancers (48, 49). Our xenograft studies in immunocompromised mice strongly (Figures 2 and 3) support a nonimmunologic function for MDSCs, which was further sup-ported by studies using EpRas cells in BALB/c mice (Supplemental Figure 9, G, H, M, and N). To determine whether MDSCs influence CSCs in TNBC, we performed tumorsphere assays, which serve as an in vitro surrogate for tumor-initiating cell (TIC)/CSC function. Cells grown in in vitro tumorspheres expressed higher levels of ΔNp63 compared with cells in monolayer cultures, suggesting that ΔNp63 is enriched in CSCs (Supplemental Figure 14A). Further-more, we found that ΔNp63 enhanced CSC activity as the number of generated tumorspheres was reduced in ΔNp63-KD HCC1806 cells compared with control (Figure 7, A and B), supporting our previously published studies. Testing the tumor-promoting func-tion of MDSCs on CSCs in vitro, we found a significant increase in the number of tumorspheres when control HCC1806 cells were cocultured with tumor MDSCs (Figure 7, A and B). In contrast, ΔNp63-KD HCC1806 cells showed no difference in tumorsphere number when MDSCs were added, indicating that the MDSC effect depended on tumor-specific ΔNp63 expression (Figure 7, A and B). This phenotype was further confirmed in SUM159 (Fig-ure 7, C and D), suggesting that MDSCs promote CSC function in TNBC in a ΔNp63-dependent manner.
To determine whether the interaction between MDSCs and ΔNp63+ CSCs is chemokine-dependent, we used the CXCR2 and
CCR4 inhibitors. Notably, inclusion of these inhibitors decreased the number and size of tumorspheres in both of the TNBC cell lines (Supplemental Figure 14, B–E), suggesting a potential chemo-kine-dependent feedback mechanism promoting MDSC-driven tumorigenic activity of ΔNp63+ CSCs in TNBCs. To identify any
scale ranging from 0 to 100. To score abundance, a score of more than 1 was considered positive. H-score = intensity × abundance. For immunofluorescence studies, only abundance was measured. The stromal cells were scored for CD11B, CD33/S100A9, and
CD15/Lox-1 markers. The tumor cells were scored for ΔNp63 and K14 markers.
For ΔNp63, nuclear staining was considered. Mann-Whitney U test
was used for box plots in Figure 1, D and E, and Supplemental Figure 1, F–H. The scoring of specimen slides was done in a blinded manner. The researcher or pathologist had no prior knowledge of the slide identity.
Animal studies. BALB/c, NSG, FVB, and athymic nude mice were
obtained from The Jackson Laboratory. For mammary fat pad injection experiments, all mice at 5–7 weeks old were anesthetized, and tumor cells were injected into the mammary fat pad following established protocols (61). All mammary fat tumors were palpated every week.
The experiment was terminated when tumors reached 1,500 mm2 in
size, or was terminated earlier if the tumors were ulcerated (humane endpoint). For i.v. injection, the tumor cells were injected into the tail vein of 5- to 6-week-old mice following established protocol (62).
Cell culture studies. The HCC1806 cell line was obtained from
Sophie Ran (Southern Illinois University, Carbondale, Illinois, USA), whereas the SUM159, MCF7, EpRas, and WTB cell lines were obtained from Yibin Kang (Princeton University, Princeton, New Jersey, USA). HCC1806, MCF7, EpRas, and WTB cell lines were grown in DMEM (Sigma-Aldrich), and the SUM159 cell line was grown in F12 medium, supplemented with 10% FBS (Invitrogen), 100 U/ml penicillin, and
100 μg/ml streptomycin sulfate (Invitrogen). Cells were tested and
confirmed to be mycoplasma-negative. Human breast cancer cells were authenticated by short tandem repeat DNA profiling analysis.
Viral production and infection. For lentiviral-mediated knockdown
studies, we used one of the previously validated isoform- specific
shRNAs for human and mouse ΔNp63 shRNAs, respectively (21).
The targeting shRNA sequence for mouse ΔNp63 is 5′
-GGCACCT-GAATTCTGTTA-3′ for ΔNp63-KD. The targeting shRNA sequence
for human ΔNp63-KD is 5′-GCAGCATTGATCAATCTTA-3′. We used
previously validated expression plasmid for ΔNp63 overexpression
studies (21). Viral packaging followed by subsequent infection of cells was done following standard protocols (21). For validated knockdown
constructs (21), GFP+ cells were enriched using flow cytometry since
cells were labeled with GFP. ΔNp63-overexpressing WTB cells were
selected with puromycin.
Protein extraction and Western blot analysis. Proteins were
extract-ed from cell lines in RIPA buffer as previously describextract-ed (63). Western blot analysis was performed using the standard protocol. Antibodies and dilutions used are listed in Supplemental Table 1. See complete unedited blots in Supplemental Figure 15.
Histological analysis, IHC, and immunofluorescence. For
histolog-ical analysis, human patient samples and mouse tumor and mouse lung specimens were processed as previously described (62). Anti-body dilutions are listed in Supplemental Table 1. For IHC, antiAnti-body slides were counterstained with hematoxylin. For immunofluo-rescence, DAPI was used to stain nuclei. Images were taken with a Nikon TiE microscope.
Flow cytometry/FACS sorting. The single-cell suspension for flow
cytometry analysis of tumor, lung, or spleen was obtained following published protocol (21). Single cells were stained with a combination of antibodies (listed in Supplemental Table 2) for 20–30 minutes at room temperature in the dark. FACS analysis was performed using
knockdown of ΔNp63. However, we found that inhibition of CXCR2/CCR4 does not inhibit primary tumor growth despite reducing MDSCs, suggesting the requirement for additional downstream targets of ΔNp63 in TNBC tumor growth. It is also possible that the number of tumor cells at injection time was high-er, minimizing the effect of CXCR2/CCR4 inhibitors on tumor volume, which needs further evaluation.
ΔNp63 facilitates the recruitment of MDSCs and promotes metastasis of human and mouse TNBC cells in both immune-com-petent and immune-compromised models, highlighting a non-immunologic function for MDSCs in the TME of TNBCs that is inde-pendent of their role in T cell and NK cell suppression. This view is supported by recent studies suggesting that MDSCs promote metas-tasis of pancreatic and ovarian cancer by enhancing CSC-like prop-erties (48, 49). Indeed, our data with mouse TNBC cells show that loss of ΔNp63 at primary and metastatic sites reduces tumor growth, progression, and metastasis by reducing recruitment of MDSCs. Supporting prior studies that show that MDSCs enhance CSC activ-ity of breast cancer cells through cell-cell contact signaling (55, 56), we find that MDSCs increase CSC activity in a ΔNp63- dependent manner in TNBCs. We find that greater numbers of MDSCs are present in the TME of TNBCs than in other subtypes. Moreover, we find an intriguing link where MDSCs promote CSC function in TNBC through secreted factors that include MMP9 or CHI3L1. Notably, addition of either MMP9 or CHI3L1 enhances tumorsphere numbers, indicative of their direct effects on CSCs. MMP9 is import-ant for metastasis of TNBC cancer cells, and high levels of MMP9 in tumor cells are associated with poor prognosis of TNBC patients (50–52, 57). Although MMP9 has been implicated in the mobility of MDSCs during hematopoiesis (58), its function within the context of the TME of TNBCs has not been established. Similarly, while CHI3L1 is important for pulmonary metastasis, the potential impact of MDSC-expressed CHI3L1 is completely unknown. The high rate of tumor relapse, metastasis, and therapeutic resistance of TNBC is often linked to increased numbers of CSCs (59, 60). Our data sug-gest that prometastatic factors such as MMP9 and CHI3L1 secreted from MDSCs promote ΔNp63+ CSCs, which then in turn facilitate
increased metastasis of TNBC cells (Figure 7I).
In summary, our study sheds light on a novel crosstalk between MDSCs and ΔNp63-enriched CSCs in promoting TNBC metasta-sis (Figure 7I). These findings provide a rationale for developing CXCR2 and CCR4 antagonists and neutralizing antibodies as therapeutic approaches for ΔNp63high TNBC patients. Our data
further highlight the potential use of ΔNp63 as a prognosis mark-er to stratify TNBC patients and suggest that basal TNBC patients with high ΔNp63 will specifically benefit from adjunct CXCR2/ CCR4–targeted therapy.
Methods
Human patient samples. Breast cancer specimens used in the study were
The Journal of Clinical Investigation
R E S E A R C H A R T I C L EIn vivo treatment experiments. For drug treatments, mice were
randomly assigned to the cohorts. Mice were treated with CXCR2
antagonist (catalog 2725, R&D Systems) or CCR4 antagonist (catalog
3581, R&D Systems) at 2 mg/kg on alternating days. See Supplemental
Table 4 for details.
Bioluminescence imaging of tumor and lung tissues. Mice were
anes-thetized and injected with 100 μl of Renilla luciferin substrate (30
mg/ml; Gold Biotechnology). Bioluminescence images were obtained using the IVIS Spectrum system (Caliper Life Sciences). Data are expressed as total photon flux and were analyzed using Living Image 3.0 software (Caliper Life Sciences).
CTC culture and quantification. The same amount of peripheral
blood was isolated from xenograft tumor–bearing mice of different groups and processed for RBC lysis followed by culture in tissue culture dishes for 5–7 days or extraction of total genomic DNA using a Qiagen DNA extraction kit following the manufacturer’s protocol. Semiquanti-tative PCR was performed with human and mouse genomic DNA using GAPDH primers (Supplemental Table 3). The intensities of PCR-elec-trophoresis gel bands were quantified using ImageJ software (NIH), and the values were subtracted from background values. Semiquantitative data from human GAPDH were normalized with mouse GAPDH using genomic DNA to quantify the levels of human CTCs in mouse blood.
Tumorsphere assay. Tumor cells were cultured as previously
described (62). For coculture tumorsphere assay with TNBC cells and MDSCs, both cell types were mixed in a 1:4 or 1:8 ratio and grown in Corning low-adherent plates in tumorsphere media for 3–5 days (62).
All recombinant chemokines and growth modulators (R&D Systems)
(listed in Supplemental Table 4) were used in 100 ng/ml concentration.
Migration assay. Mouse primary MDSCs were allowed to migrate
through Costar Transwell permeable 8-μm-pore-size membranes in
24-well plates (Corning) toward the conditioned medium of TNBC cells or chemokines such as CXCL2 or CCL22 (100 ng/ml) for 1–3 hours at 37°C. Total migrated MDSCs were counted by collection of all MDSCs at the bottom of the 24-well plate. All recombinant mouse
chemokines (R&D Systems; listed in Supplemental Table 4) were used
in 100 ng/ml concentration. CXCR2 and CCR4 synthetic blocking
compounds (R&D Systems; Supplemental Table 4) were used at 2
μg/ml and 5 μg/ml concentration, respectively.
Statistics. Results were reported as mean ± SD or mean ± SEM. The
significance of differences was calculated using 2-tailed Student’s t test for normally distributed data sets. Normal distribution of data was eval-uated by Shapiro-Wilk W test or Skewness-Kurtosis test for normality. Non-normally distributed data sets were analyzed using nonparamet-ric Mann-Whitney U tests. The tumor growth data sets were analyzed using the Bonferroni corrected 2-way ANOVA to compute statistical significance. One-way ANOVA with Tukey’s post hoc test was done for samples with multiple comparisons. For TNBC and non-TNBC KM plots (Figure 1, F–H), the KM Plotter “auto select best cutoff” option was used for stratification. Differences in survival between groups via Kaplan-Mei-er plots wKaplan-Mei-ere statistically evaluated using log-rank tests. Mann-Whitney
U test was used for correlation scatter plots using human patient
sam-ples. A P value of less than 0.05 was considered statistically significant.
Study approval. Breast cancer specimens used in the study were
deidentified samples and were obtained from the Eastern Division of the Cooperative Human Tissue Network, University of Pennsylvania. All samples were considered exempt by the Institutional Review Board of the University of Pennsylvania. Animal procedures were conducted the LSRII Flow Cytometer (BD Biosciences), and data were analyzed
using FlowJo software (Tree Star Inc.). For sorting of cells, Aria II or FACS Jazz instruments were used. Antibodies and dilutions used are listed in Supplemental Table 2.
RNA and quantitative reverse transcriptase PCR analysis. Total RNA
was isolated from cultured cell lines, primary cells, and sorted cells using standard method. The gene-specific primer sets were used at a
final concentration of 0.2 μM, and their sequences are listed in
Sup-plemental Table 3.
Chromatin immunoprecipitation. HCC1806 cells were grown to
80% confluence, and cells were then cross-linked with 1% formal-dehyde and processed. ChIP-Seq experiments were performed with 2 independent p63 antibodies using the iDeal ChIP-Seq kit for Tran-scription Factors (Diagenode) (64).
RNA-Seq analysis and gene set enrichment analysis. RNA-Seq was
performed by DNA Link Inc. (California, USA) according to the man-ufacturer’s protocol from Kapa Biosystems (RNA-seq Library Quan-tification Kit). Thirty million reads were obtained from each sample. Data were deposited in the NCBI’s Gene Expression Omnibus (GEO) database with accession number GSE102377. For gene expression analysis, reads were aligned to the hg38 UCSC assembly using TopHat version 2.0.14 and Bowtie version 2.10. GFF files were obtained from Genome Reference Consortium Human Build 38 patch release 9. The distribution of alignments was analyzed using Cufflinks version 2.2.1. FPKM values were normalized. Differential expression testing was performed using Cuffdiff version 2.2.1; however, all FPKM values are those calculated by Cufflinks.
Gene set enrichment analysis (GSEA) was conducted using GSEA2.2.4 software to generate enrichment scores for gene sets in Hallmark C2.all, C5.all, and C6.all data sets with default settings. Gene sets were tested for enrichment in rank-ordered lists via GSEA using a weighted Kolmogorov-Smirnov–like statistic to calculate the enrichment score. The RNA-Seq data were deposited in the GEO data-base with accession number GSE102377.
Protein arrays and ELISA. MDSCs from the HCC1806 and
SUM159 xenograft tumors were isolated to perform protein array. In brief, xenograft tumors were enzymatically digested to get cells in suspension as described previously (62). Neutrophils from nor-mal breast or MDSCs were enriched using anti-Gr1 particles via magnetic separation (catalog 558111, BD Biosciences). Enriched MDSCs were stained with a combination of antibody cocktail for 30
minutes in dark at room temperature. MDSCs (CD45+CD11B+Gr1+)
were isolated using a flow cytometry sorter. Chemokine array (R&D
Systems) and ELISA (R&D Systems) were performed according to
the manufacturer’s instructions. Conditioned medium from control
and ΔNp63-KD cells was used to determine the levels of
chemok-ines. Cytokine array (R&D Systems) was performed according to the
manufacturer’s instructions. Sorted cell lysates from neutrophils and MDSCs were used to determine the levels of cytokines/secreted fac-tors. For ELISA, HCC1806 and SUM159 cells were cultured into a 10-cm dish. After overnight incubation, the level of CXCL2 chemo-kine was evaluated by ELISA.
T cell proliferation and suppression assay. T cell proliferation
and suppression assays were performed following protocols in
pub-lished literature (56). IFN-γ staining was examined via flow
1. Dai X, et al. Breast cancer intrinsic subtype clas-sification, clinical use and future trends. Am J
Cancer Res. 2015;5(10):2929–2943.
2. Bianchini G, Balko JM, Mayer IA, Sanders ME, Gianni L. Triple-negative breast cancer: chal-lenges and opportunities of a heterogeneous dis-ease. Nat Rev Clin Oncol. 2016;13(11):674–690. 3. Gluz O, Liedtke C, Gottschalk N, Pusztai L, Nitz
U, Harbeck N. Triple-negative breast cancer — current status and future directions. Ann Oncol. 2009;20(12):1913–1927.
4. Lehmann BD, et al. Identification of human tri-ple-negative breast cancer subtypes and preclini-cal models for selection of targeted therapies.
J Clin Invest. 2011;121(7):2750–2767.
5. Hanahan D, Coussens LM. Accessories to the crime: functions of cells recruited to the tumor microenvi-ronment. Cancer Cell. 2012;21(3):309–322. 6. Fessler E, Dijkgraaf FE, De Sousa E Melo F,
Medema JP. Cancer stem cell dynamics in tumor progression and metastasis: is the microenviron-ment to blame? Cancer Lett. 2013;341(1):97–104. 7. Quail DF, Joyce JA. Microenvironmental
regu-lation of tumor progression and metastasis. Nat
Med. 2013;19(11):1423–1437.
8. Gabrilovich DI. Myeloid-derived suppressor cells.
Cancer Immunol Res. 2017;5(1):3–8.
9. Marvel D, Gabrilovich DI. Myeloid-derived suppressor cells in the tumor microenviron-ment: expect the unexpected. J Clin Invest. 2015;125(9):3356–3364.
10. Gabrilovich DI, Nagaraj S. Myeloid-derived sup-pressor cells as regulators of the immune system.
Nat Rev Immunol. 2009;9(3):162–174.
11. Bronte V. Myeloid-derived suppressor cells in inflammation: uncovering cell subsets with enhanced immunosuppressive functions. Eur J
Immunol. 2009;39(10):2670–2672.
12. Mills AA. p63: oncogene or tumor suppressor?
Curr Opin Genet Dev. 2006;16(1):38–44.
13. Crum CP, McKeon FD. p63 in epithelial survival, germ cell surveillance, and neoplasia. Annu Rev
Pathol. 2010;5:349–371.
14. Yang A, et al. p63, a p53 homolog at 3q27-29, encodes multiple products with transactivating, death-inducing, and dominant-negative
activi-ties. Mol Cell. 1998;2(3):305–316.
15. Romano RA, et al. ΔNp63 knockout mice reveal its indispensable role as a master regulator of epi-thelial development and differentiation.
Develop-ment. 2012;139(4):772–782.
16. Su X, et al. TAp63 suppresses metastasis through coordinate regulation of Dicer and miRNAs.
Nature. 2010;467(7318):986–990.
17. Westfall MD, Pietenpol JA. p63: Molecular com-plexity in development and cancer.
Carcinogene-sis. 2004;25(6):857–864.
18. Saladi SV, et al. ACTL6A is co-amplified with p63 in squamous cell carcinoma to drive YAP activation, regenerative proliferation, and poor prognosis. Cancer Cell. 2017;31(1):35–49. 19. Sinha A, Chandra S, Raj V, Zaidi I, Saxena S,
Dwivedi R. Expression of p63 in potentially malignant and malignant oral lesions. J Oral Biol
Craniofac Res. 2015;5(3):165–172.
20. Keyes WM, et al. ΔNp63α is an oncogene that tar-gets chromatin remodeler Lsh to drive skin stem cell proliferation and tumorigenesis. Cell Stem
Cell. 2011;8(2):164–176.
21. Chakrabarti R, et al. ΔNp63 promotes stem cell activity in mammary gland development and basal-like breast cancer by enhancing Fzd7 expression and Wnt signalling. Nat Cell Biol. 2014;16(10):1004–1015.
22. Memmi EM, et al. p63 Sustains self-renewal of mammary cancer stem cells through regulation of Sonic Hedgehog signaling. Proc Natl Acad Sci
U S A. 2015;112(11):3499–3504.
23. Du Z, et al. Overexpression of ΔNp63α induces a stem cell phenotype in MCF7 breast carcinoma cell line through the Notch pathway. Cancer Sci. 2010;101(11):2417–2424.
24. Bronte V, et al. Recommendations for myeloid-derived suppressor cell nomenclature and characterization standards. Nat Commun. 2016;7:12150.
25. Condamine T, et al. Lectin-type oxidized LDL receptor-1 distinguishes population of human polymorphonuclear myeloid-derived sup-pressor cells in cancer patients. Sci Immunol. 2016;1(2):aaf8943.
26. Nekulova M, et al. ΔNp63α expression induces
loss of cell adhesion in triple-negative breast can-cer cells. BMC Cancan-cer. 2016;16(1):782. 27. Lodillinsky C, et al. p63/MT1-MMP axis is required
for in situ to invasive transition in basal-like breast cancer. Oncogene. 2016;35(3):344–357.
28. Rakha EA, et al. Triple-negative breast cancer: distinguishing between basal and nonbasal sub-types. Clin Cancer Res. 2009;15(7):2302–2310. 29. Jacquemier J, et al. Protein expression profiling
identifies subclasses of breast cancer and pre-dicts prognosis. Cancer Res. 2005;65(3):767–779. 30. Györffy B, et al. An online survival analysis
tool to rapidly assess the effect of 22,277 genes on breast cancer prognosis using microarray data of 1,809 patients. Breast Cancer Res Treat. 2010;123(3):725–731.
31. Pereira B, et al. The somatic mutation profiles of 2,433 breast cancers refines their genomic and transcriptomic landscapes. Nat Commun. 2016;7:11479.
32. Curtis C, et al. The genomic and transcriptomic architecture of 2,000 breast tumours reveals novel subgroups. Nature. 2012;486(7403):346–352. 33. Volk-Draper LD, Rajput S, Hall KL, Wilber A, Ran
S. Novel model for basaloid triple-negative breast cancer: behavior in vivo and response to therapy.
Neoplasia. 2012;14(10):926–942.
34. Suarez-Carmona M, et al. ΔNp63 isoform-medi-ated β-defensin family up-regulation is associat-ed with (lymph)angiogenesis and poor prognosis in patients with squamous cell carcinoma.
Onco-target. 2014;5(7):1856–1868.
35. Bid HK, et al. ΔNp63 promotes pediatric neuro-blastoma and osteosarcoma by regulating tumor angiogenesis. Cancer Res. 2014;74(1):320–329. 36. Folkman J. Role of angiogenesis in tumor
growth and metastasis. Semin Oncol. 2002;29(6 suppl 16):15–18.
37. Wang WQ, et al. Intratumoral α-SMA enhances the prognostic potency of CD34 associated with maintenance of microvessel integrity in hepato-cellular carcinoma and pancreatic cancer. PLoS
One. 2013;8(8):e71189.
38. Janda E, Litos G, Grünert S, Downward J, Beug H. Oncogenic Ras/Her-2 mediate hyperprolifer-ation of polarized epithelial cells in 3D cultures
reading of the manuscript and helpful discussions. We thank the Penn Vet Comparative Pathology Core for their assistance with embedding and sectioning of tumor samples. We thank the East-ern Division of the Cooperative Human Tissue Network, Univer-sity of Pennsylvania, for providing human breast cancer fixed tissues from patients. We thank the members of Flow Cytometry Core at the Children’s Hospital of Philadelphia and the Universi-ty of Pennsylvania. This work was supported by grants from the American Cancer Society and the McCabe Fund Fellow Award from the University of Pennsylvania (to RC) as well as an NCI K22 grant (K22CA193661 to RC).
Address correspondence to: Rumela Chakrabarti, Department of Biomedical Sciences, School of Veterinary Medicine, University of Pennsylvania, 380 S. University Avenue, 411 Hill Pavilion, Phila-delphia, Pennsylvania 19104, USA. Phone: 215.746.1873; Email: [email protected].
in compliance with and with the approval of the Institutional Animal Care and Use Committee of the University of Pennsylvania.
Author contributions
SK and RC designed all experiments. SK, DWW, and NS per-formed all the experiments. AN provided technical advice and performed the scoring on human breast cancer samples after IHC. MAB performed all the clinical and statistical analyses using human breast cancer samples and data sets. KAT and DG provided experimental support in MDSC-related experiments. CG and SS performed and analyzed ChIP-Seq analysis. SK and RC wrote the manuscript. All authors discussed the results and commented on the manuscript.
![Figure 2. Δgrowth (right; total flux, photons per second [p/s]) show bioluminescent signal from tumors in vivo](https://thumb-us.123doks.com/thumbv2/123dok_us/9420874.444998/5.585.37.539.56.403/figure-dgrowth-right-photons-second-bioluminescent-signal-tumors.webp)