JOURNAL OF FOREST SCIENCE, 49, 2003 (7): 333–347
Forest stands of the Šumava Mts. have been exposed to considerable air-pollution and ecological stress for two decades. This situation causes differentiated eco-physi-ological damage with specific and non-specific symp-toms (defoliation, yellowing, necroses, etc.), especially in the high mountainous areas. Forest ecosystems are influenced especially by acid deposition with the critical limit 0.35–0.51 H kmol/ha per year in many localities (MORAVČÍK 1994). Not only production but also ecologi-cal functions of forest are affected negatively owing to the following attack of abiotic as well as biotic (insect and fungal) factors. Their activities lead to the destruction of stand structure and stability as well as of biodiversity of forest ecosystems. The most important objectives of forest management in these localities are the revitalisation, sta-bilisation and regeneration of forest stands. It is necessary to carry out practical active restoration and stabilisation treatments based on sufficient knowledge concerning the structure and dynamics of natural forests, their damage and decline.
Modelling of tree stand defoliation using transition matri-ces can be applied for these purposes. The transition matrix takes into account probabilities of a random change of tree classification from the first-year defoliation class to the sec-ond-year defoliation class. The transition matrices have often been used in ecology and forestry (e.g. DALE, HULSMAN
1988; DRAGOI, ALBEANU 1998; HUENNEKE, MARKS 1987;
LIPPEet al. 1985; MENDOZA, SETYARSO 1986; SCOTT et al. 1990, and others). This approach was used to evaluate the damage of forest stands in the Krkonoše Mts. (VACEK
1987; VACEK, LEPŠ 1995; MATĚJKA et al. 1998; VACEK, MATĚJKA 1999) and to forecast stand defoliation in the Šumava Mts. (MATĚJKA 1999).
The aim of the present study is to evaluate the health state dynamics of secondary spruce stands in the Modrava trict territory compared to natural forests in the Plešný dis-trict area. This paper continues the studies of VACEKet al. (2000) and VACEKand MAYOVÁ(2000), where the causes of forest decline in the area of interest were analysed.
MATERIAL AND METHODS
Table 1 presents an overview of data from a set of per-manent research plots. ULBRICHOVÁ and PODRÁZSKÝ
(2000) gave detailed information.
Initial structural parameters (tree height, dbh, coenotic position of individual trees) were measured and classified as a part of plot establishment in 1997 (9 permanent plots with natural mixed or Norway spruce stands in the Plešný Forest District territory [12–20] and 9 plots with Norway spruce monocultures in the Modrava Forest District terri-tory [1–4, 7–11]). Standard dendroecological methods were
This paper was supported by Research Project No. 206/03/1583 Nutrient cycles in mountain forest ecosystems saturated by nitrogen: past, present and future state of water, soil and Norway spruce stands (co-ordinated by V. V. PODRÁZSKÝ).
Dynamics of health status of forest stands on research plots
in the Šumava National Park
S. V
ACEK1, K. M
ATĚJKA2, J. M
AYOVÁ1, V. V. P
ODRÁZSKÝ31
Forestry and Game Management Research Institute, Research Station Opočno,
Czech Republic
2
IDS Praha, Prague, Czech Republic
3
Czech University of Agriculture, Faculty of Forestry, Prague, Czech Republic
ABSTRACT: The paper summarises an evaluation of the health status dynamics of allochthonous spruce stands in the Modrava Forest District and of natural stands in the Plešný Forest District. Analysis is based on dendroecological reactions of particular tree individuals in the stand structure. The tree damage was evaluated annually (during the period 1997–2002), based especially on de-foliation. Natural and semi-natural, especially mixed forest stands with dominant beech in the Plešný Forest District territory were most tolerant, allochthonous secondary spruce stands in the Modrava Forest District area were least tolerant. The damage dynamics was limited by the activity of insect pests (bark beetle – Ips typographus). Damage caused by ozone occurred much more often in 2002 compared to 1999. The most damaged species were sycamore and rowan tree.
applied. Tree coenotic position was classified according to
[image:2.595.63.534.83.270.2]ZLATNÍK (1976). Defoliation degree was classified only for living trees. Coenotic position was determined by the method of ZLATNÍK (1976). The results of these structural studies were published by VACEK et al. (2000). The state and dy-namics of foliation/defoliation were determined for particular species (beech, spruce, fir, sycamore, maple, rowan tree, elm, ash and pedunculate oak) by all trees within the plot in the period 1997–2002. The spruce foliation state was classified according to TESAŘand TEMMLOVÁ(1971), beech foliation by VACEKand JURÁSEK (1985). For the other tree species, the above-mentioned adapted classification (as a ratio of the actual quantity of leaves to the potentially highest quantity of those under optimum conditions of stand development) was used. Foliation state and spruce yellowing were determined within 5% intervals. These procedures are compatible with
Table 1. Characteristics of permanent research plots established in the period 1997–1998. Forest management plan valid since 1. 1. 1994
Plot District Stand Altitude (m a.s.l.) Forest type Age
1 Modrava 68B4 1,140 8N3 134
3 Modrava 68B 1,120 8R1 120
7 Modrava 76C8 1,230 8S1 149
12 Plešný 2C1/3 1,020 7S2 10, 25, 215
13 Plešný 2C1/3 1,030 7S2 10, 25, 215
14 Plešný 3C1/2/3 1,030 7S2 15, 25, 200
15 Plešný 3A1/2/3 1,060 7S2 15, 25, 200
16 Plešný 4A1/2/6 1,120 7S1, 7N3 15, 28, 190
17 Plešný 4A1/2/6 1,150 7N3 190
18 Plešný 4A1/2/6 1,250 7N3 190
19 Plešný 5A 1,300 8Y2 150
[image:2.595.65.533.515.732.2]20 Plešný 5A 1,370 8Y2 150
Table 2. Species composition (living individuals) on the plots in the Modrava and Plešný Forest District territories (1997)
Plot Individuals (No.) Percentage (%)
Beech Spruce Other broadleaves Total Beech Spruce Other broadleaves
1 0 86 0 86 0 100 0
3 0 156 0 156 0 100 0
7 0 11* 0 11* 0 100 0
12 570 7 49 626 91.1 1.1 7.8
13 167 61 19 247 67.6 25 7.7
14 239 185 80 504 47.4 37 15.9
15 380 74 6 460 82.6 16 1.3
16 169 52 5 226 74.8 23 2.2
17 45 25 2 72 62.5 35 2.8
18 48 48 0 100 0.0
19 136 2 138 0 99 1.4
20 64 64 0 100 0.0
Total 1,570 652 163 2,385 65.8 27 6.8
*124 bark-beetle trees were identified in the period 1994–1996
methods used for the International Co-operative Programme (ICP – Forests). Foliation and yellowing evaluation was re-lated to coenotic position and diameter structure. Foliation was classified during data processing into six degrees, cor-responding to damage intensity:
Defoliation
degree Foliation (%) Characteristics of the tree
0 91–100 healthy
1 71–90 slightly damaged
2 51–70 medium damaged
3 31–50 heavily damaged
4 1–30 dying
The remainder of foliation to 100% was called defolia-tion. Each defoliation value for each tree is possible to classify into defoliation class C1 ... Cn. The state of the whole stand can be described on the basis of this clas-sification as vector X = (x1, ... xn), where xi is the number
[image:3.595.110.252.53.209.2]of values classified within class Ci (in other words, the number of trees with defoliation within class Ci).
[image:3.595.329.519.59.613.2]Fig. 1A. Localisation of the study plots in the Šumava natural forest area
Fig. 1B. Localisation of the study plots in the area of Modrava. Forest vegetation zones are shown
[image:3.595.73.291.247.470.2]Fig. 1C. Localisation of the study plots along the altitudinal gra-dient on the Plešný massif. Forest vegetation zones are shown
Fig. 2. Defoliation degree proportion and average foliation of the allochthonous Norway spruce monocultures on plots No. 1, 3 and 7
75 75
[image:3.595.64.290.523.715.2]Fig. 3. Average defoliation and mortality of trees in the allochthonous Norway spruce monocultures on plots No. 1, 3 and 7. The used TDM programme shows models (each of them is based on data of two successive years as described by the model line) for further development of average defoliation
Development of stand damage can be described as a change of vector X. Let Xy be the state of the stand in year y and Xy+1 be the state vector in the following year – it is possible to write a model
Xy+1 = A . Xy
The square matrix A consists of probabilities aij that
a tree with defoliation within class Ci in year y will be classified within class Cj in year y + 1. These probabilities can be estimated using the number of trees within relevant defoliation classes in two successive years. These prob-abilities are constants under unchanged (environmental, air pollution etc.) conditions during the following period of several years. The progression Y1, Y2, Y3, ... is known as Markov chain (e.g. MANDL1985).
The model of transition matrices was a basis of data processing on development of forest stands. It was ap-plied in software TDM [Tree Defoliation Modelling], which was used in this study. See the Internet pages http: //www.infodatasys.cz for description of this programme and other details.
A series of models on the basis of defoliation classifica-tion of all trees of a selected tree species was calculated for each plot using the series of pairs of succeeding years. Data from these years was used to calculate the relevant transition matrix. The following classes of defoliation were applied: C1 = [0%, 10%), C2 = [10%, 30%), C3 =
[30%, 50%), C4 = [50%, 70%), C5 = [70%, 90%), C6 =
[90%, 100%].
Transition matrix for two not immediately successive years can be constructed in a similar way. Such a tech-nique allows to eliminate some oscillations during the de-velopment that would be influenced by accidental impacts. Transition matrices for a three-year period (1999–2002) were calculated using this method and the results were an-alysed to reveal the features of stand defoliation process. The analysis of transition matrices can provide by cal-culating eigenvalues and eigenvectors of these matrices. There is minimally one eigenvalue that is equal to one (λi = 1). The corresponding eigenvector describes the stable
state of the system (distribution of numbers/proportions of trees between six defoliation classes). It is possible to expect some oscillations of the system under the condition that one or more eigenvalues are complex numbers (cf.
LEGENDRE, LEGENDRE 1983).
with anticipated proportion of dead trees exceeding 50% are distinguished (tree with defoliation within class C6 is
considered as a dead tree). A change in the conditions of stand development will be demonstrated as a departure
[image:5.595.309.523.51.657.2]of the really observed development from the predicted one. These conditions could be external conditions (e.g. climate fluctuations) or internal ones (e.g. exceeding of buffering capacity of the ecosystem).
Fig. 4. Defoliation degree proportion and average foliation in
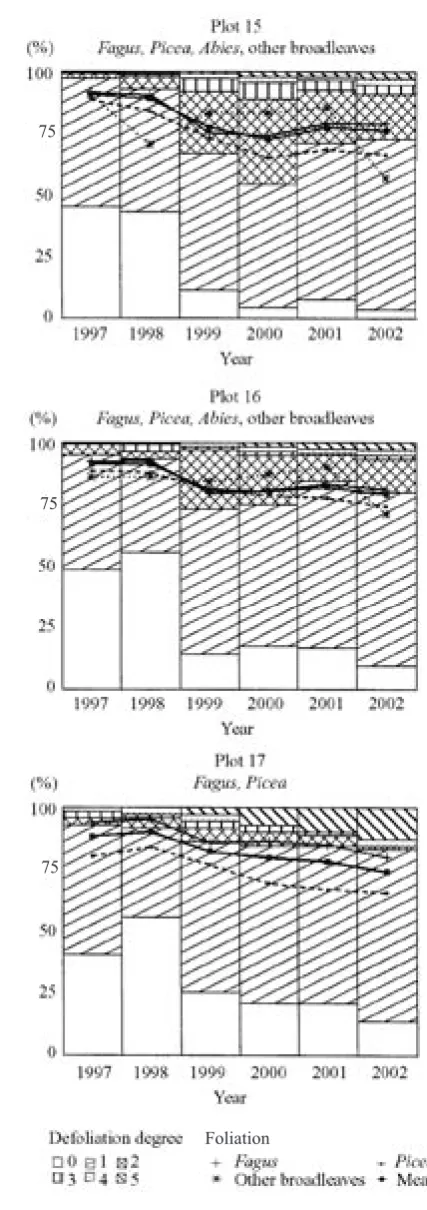
the mixed stands on plots No. 12–14 Fig. 5. Defoliation degree proportion and average foliation in the natural mixed stands on plots No. 15–17
75 75
75 75
75 75
[image:5.595.82.282.55.648.2]Other damage was registered: snowbreaks, rime breaks, fungal attacks and insect attacks, ozone damage. Mean foliation and defoliation values were calculated for all tree species on particular plots, respecting the coenotic position.
RESULTS
Foliation and its transformed value (defoliation) were used as relatively unbiased characteristics of tree damage and health status. Tree defoliation class was chosen as a parameter for development prediction.
Secondary spruce monocultures
Different air-pollution and ecological stresses consider-ably affected these stands in the Modrava forest enterprise
district in the last decades. Their destruction resulted in a large bark-beetle outbreak – out of the 11 plots studied, only two are conserved as vital, living stands. Foliation evaluation since 1997 was possible only on plots 1, 3, 7. Tree species composition is documented in Table 2, mean foliation values in Table 3 and foliation dynamics and defoliation degree classification are shown in Fig. 1.
[image:6.595.65.531.72.517.2]Mean foliation of the studied spruce stands on the particular plots of Norway spruce stands ranged between 6.8 and 82.2% (average 56.3%) in 1997. It considerably changed in the period 1997–2002: it ranged between 0 and 71.9% with average 45.8% in 2002. The mean annu-al increase of defoliation was approximately 2.1%. Plots 1 and 3 were established in localities close to stands under the intensive bark-beetle pressure, plot 7 is in the centre of practically totally declined area. On this permanent research plots (PRP), destruction of the upper tree layer
Table 3. Mean foliation values of particular species and total on the studied plots
Plot Species Year
1997 1998 1999 2000 2001 2002
1 Spruce 82.2 80.4 72.3 71.7 74.5 71.9
3 Spruce 79.8 76.4 71.2 70.7 68.5 65.3
7 Spruce 6.8 3.4 2.0 1.9 0 0
12
Spruce 90.7 78.6 70.1 64.3 70.7 52.1
Beech 92.8 89.5 76.7 77.8 81.0 74.8
Sycamore 95.5 94.7 85.3 81.4 86.0 65.0
Average 93.0 89.8 77.1 77.7 81.1 73.7
13
Spruce 94.8 91.6 78.0 75.4 76.6 77.5
Beech 94.3 93.9 79.0 78.6 81.7 77.2
Sycamore 66.8 69.6 53.6 49.3 50.7 32.5
Average 92.3 91.9 77.1 75.1 78.4 73.9
14
Spruce 89.8 88.1 75.6 71.4 72.7 66.4
Beech 93.6 93.4 82.4 80.5 83.2 80.7
Rowan 89.1 88.0 72.5 71.6 73.5 54.0
Average 91.5 90.5 78.5 75.8 77.7 71.2
15
Spruce 88.7 84.2 73.5 65.4 68.8 66.6
Beech 91.8 90.7 78.5 74.4 79.4 79.0
Rowan 90.7 70.7 83.6 83.6 85.7 57.1
Average 90.9 89.3 77.6 72.9 77.6 76.5
16
Spruce 88.7 87.6 81.2 78.4 77.3 74.0
Beech 92.4 92.5 79.3 80.6 82.9 80.7
Rowan 86.0 86.0 84.0 87.0 90.0 71.0
Average 91.2 91.2 80.7 80.2 81.8 79.0
17
Spruce 80.4 84.2 77.0 69.6 67.4 66.0
Beech 94.0 95.3 85.8 86.4 85.2 88.2
Average 88.5 90.1 82.4 80.0 78.5 74.4
18 Spruce 77.8 78.0 83.1 80.3 76.7 69.4
19 Spruce 77.4 78.7 77.1 75.3 74.4 73.2
20 Spruce 79.5 81.1 82.3 80.7 81.1 82.7
finished in 2001, the last spruce tree has been attacked by the bark beetle this year (Fig. 1).
Much more favourable dynamics was observed in forest stands on plot 3, the tree layer surprisingly resisted the bark-beetle gradation despite of dying of all the adjacent
stands. For instance, plot 4 (at a distance of 25 m, the stand of which showed the structure with minimal dif-ferentiation) was totally destroyed by bark beetle during 1992–1994. There is a question of reasons for this limit of the bark beetle gradation. The increased resistance of stands on plot 3 can probably be explained by the high stand structure differentiation and effect of climatic condi-tions and groundwater (the whole locality is at a wet site of peaty character).
The bark beetle control in neighbouring stands of plot 1 also contributed probably to the relatively successful development of the spruce health state on this plot.
Fig. 2 shows a noticeable increase of tree defoliation on plots 1 and 3 during 1997–1998 and on plot 1 also in 1999. Further development of the health state becomes stabilised. An increase in the dead tree proportion occurs on plot 3 until the last observed year. Nevertheless, the prediction points to favourable development in future. It is necessary to re-member that modelling of average defoliation is processed for a set of living trees and tree decline is not embraced in the result of average defoliation. It is possible to assume that the stands will be able to develop favourably regarding the stand vitality under conditions of the bark beetle control. A prediction for plot 1 was clear in 1997 although a few spruce individuals withstand the bark beetle attack.
Natural forests
Natural and close-to-nature forest stands were studied in the vertical transect in the Plechý massif (plots 12–20) in the Plešný Forest District. Tree species composition is documented in Table 2, mean foliation degrees by tree species and in total are presented in Table 3, and defolia-tion dynamics as well as defoliadefolia-tion degree percentage in Figs. 3–5.
Foliation values approximately followed the altitudinal position in 1997. A more obvious decrease (by 10.7%) was observed between plots 17 and 18, i.e. on the summit phe-nomenon altitudinal limit. Foliation ranged between 77.4 and 93.0% on particular plots in 1997, the average value was 86.9%, and between 69.4 and 82.7% with average 74.9% in 2002. The mean annual defoliation increase was 2.4% during the period 1997–2002. It was the highest between 1998 and 1999, reaching 7.2%. There were visible difference between lower and higher (plots 18–20 affected by the summit phe-nomenon) parts of the altitudinal gradient. On the contrary, foliation increased by 0.9% within plots of higher locations in the period of 1998–l999. A considerable annual defolia-tion increase was documented in the middle and lower parts of the altitudinal transect (plots 12–17), ranging between 7.7 and 14.8% (11.6% on average).
A considerable foliation decrease was caused not only by heavy snowbreaks (wet snow and rime) in the winter 1998/1999, but also by ozone effects during the vegeta-tion season 1999.
A visible decrease in tree number with the lowest defoliation (foliation range between 91 and 100%) was observed on all plots. A shift of trees into the higher
defo-Fig. 6. Defoliation degree proportion and average foliation in the Norway spruce stands on plots No. 18–20
75
75
[image:7.595.82.281.58.650.2]Fig. 7. Average defoliation and mortality of trees in the beech and sycamore natural mixed stand on plot No. 12. The used TDM programme shows models for further development of average defoliation
Fig. 8. Average defoliation and mortality of trees in the beech and spruce natural mixed stand on plot No. 13. The used TDM pro-gramme shows models for further development of average defoliation
[image:8.595.63.533.432.763.2]liation classes represents a general trend. Dead trees were registered on all plots, mostly Norway spruce trees after the bark-beetle attack on plots 17 and 18 (Fig. 3–5).
The presented values did not show any substantial differences. A more significant change exceeding the common level of fluctuation was documented in 1999 for beech, compared to the year 1998. It was caused by the ex-treme climatic conditions (wet snow and rime) resulting in mechanical damage of beech crowns on lower plots of the transect. Further cause was the ozone effect (spoon shape of leaves, chloroses, necroses). Even more pronounced ozone damage was documented for beech and other broad-leaved species in 2002. Typical chloroses, even necroses, were detected especially for sycamore and rowan tree, progressing even into leaf losses. A foliation decrease was documented compared to the year 2001, reaching 20 percent and more. This trend was also registered for spruce on plot 12 as a result of strong competition effects of neighbouring beeches and sycamores on suppressed spruces in coenotic classes 3b and 4. On the other hand, the health state of Norway spruce was stabilised in climax spruce forests of the 8th vegetation altitudinal zones (plots
19 and 20).
The highest average foliation and its lowest variability were registered for beeches of middle and lower tree classes (2b, 3a, 3b) during the whole study period. The exposed trees of the main stand level (1, 2a) are visibly more defoliated. In the period 1998–1999, the defoliation increases for all tree classes in general, with the exception of class 2a (increase of foliation by 0.8% in 1997–1999). The rate of defoliation process differs for the particular tree classes and years. The most rapid decrease of foliation occurs in trees of lower coenotic classes in the interior of the stand. Foliation decreases because of competition in lower tree classes, this was also documented by previous studies (VACEK et al. 2000).
[image:9.595.67.532.55.213.2]As a result of the predictions for plot 12 with mixed stand (Fig. 7), it is obvious that the foliation of beech be-came seemingly stable after the harsh winter 1998/1999, nevertheless it is possible to expect some oscillations of the health state as a result of the transition matrix analysis for the period 1999/2002: a complex number as the eigen-value occurs (Table 4). On the contrary, sycamore shows a considerable defoliation increase in 2001–2002 and the prediction is unfavourable. More than 50% of trees will die as a result of this trend by 2008. There will be several
Fig. 10. Average defoliation and mortality of trees in the beech and spruce natural mixed stand on plot No. 15. The used TDM programme shows models for further development of average defoliation
[image:9.595.66.534.558.720.2]potentially stable states as shown by the analysis of the transition matrix period of the last three years. All these states are characterised by prevalence of trees with high defoliation or dead trees (Table 4).
The mixed spruce-beech stand of plot 13 will probably develop favourably since 2000 (Fig. 8). A slightly better situation was registered for Norway spruce. The worst
situation is on plot 14 (Fig. 9) as a result of damage to rowan and spruce growing in the 3rd and 4th coenotic
class caused by bark stripping by deer. Severe damage to rowan trunks results in a steep increase of defoliation and in a high proportion of dead trees in predictions since 2002. The transition matrix for the last three-year period shows a different convergence rate of rowan
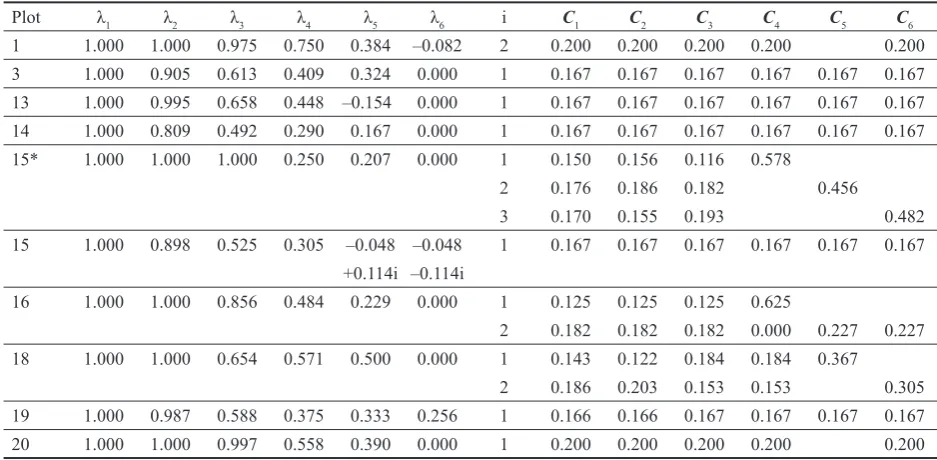
develop-Table 4. Analysis of transition matrices calculated for the period 1999–2002. λ1–λ6 are eigenvalues of the matrices, C1–C6 are proportions of tree numbers within corresponding defoliation classes – they are calculated on the basis of the eigenvector corresponding to i-th eigenvalue
A. Picea abies
Plot λ1 λ2 λ3 λ4 λ5 λ6 i C1 C2 C3 C4 C5 C6
1 1.000 1.000 0.975 0.750 0.384 –0.082 2 0.200 0.200 0.200 0.200 0.200
3 1.000 0.905 0.613 0.409 0.324 0.000 1 0.167 0.167 0.167 0.167 0.167 0.167
13 1.000 0.995 0.658 0.448 –0.154 0.000 1 0.167 0.167 0.167 0.167 0.167 0.167
14 1.000 0.809 0.492 0.290 0.167 0.000 1 0.167 0.167 0.167 0.167 0.167 0.167
15* 1.000 1.000 1.000 0.250 0.207 0.000 1 0.150 0.156 0.116 0.578
2 0.176 0.186 0.182 0.456
3 0.170 0.155 0.193 0.482
15 1.000 0.898 0.525 0.305 –0.048 –0.048 1 0.167 0.167 0.167 0.167 0.167 0.167 +0.114i –0.114i
16 1.000 1.000 0.856 0.484 0.229 0.000 1 0.125 0.125 0.125 0.625
2 0.182 0.182 0.182 0.000 0.227 0.227
18 1.000 1.000 0.654 0.571 0.500 0.000 1 0.143 0.122 0.184 0.184 0.367
2 0.186 0.203 0.153 0.153 0.305
19 1.000 0.987 0.588 0.375 0.333 0.256 1 0.166 0.166 0.167 0.167 0.167 0.167
20 1.000 1.000 0.997 0.558 0.390 0.000 1 0.200 0.200 0.200 0.200 0.200
*transition matrices were calculated for the period 1997–2000 B. Fagus sylvatica
Plot λ1 λ2 λ3 λ4 λ5 λ6 i C1 C2 C3 C4 C5 C6
12 1.000 0.978 0.592 0.291 0.011 0.011 1 0.167 0.167 0.167 0.167 0.167 0.167
+0.031i –0.031i
13 1.000 0.975 0.473 0.152 0.000 0.000 1 0.167 0.167 0.167 0.167 0.166 0.166
14 1.000 0.993 0.500 0.325 0.301 0.000 1 0.167 0.167 0.167 0.167 0.167 0.167
15 1.000 0.990 0.412 0.180 0.156 0.000 1 0.167 0.167 0.167 0.167 0.167 0.167
16 1.000 1.000 0.981 0.333 0.315 0.137 1 0.092 0.094 0.109 0.705
2 0.190 0.189 0.185 0.218 0.218
17 1.000 1.000 0.867 0.308 0.000 0.000 2 0.200 0.200 0.200 0.200 0.200
C. Acer pseudoplatanus
Plot λ1 λ2 λ3 λ4 λ5 λ6 i C1 C2 C3 C4 C5 C6
12 1.000 1.000 1.000 0.677 0.286 0.038 1 0.175 0.115 0.046 0.664
2 0.201 0.245 0.174 0.380
3 0.112 0.098 0.254 0.536
D. Sorbus aucuparia
Plot λ1 λ2 λ3 λ4 λ5 λ6 i C1 C2 C3 C4 C5 C6
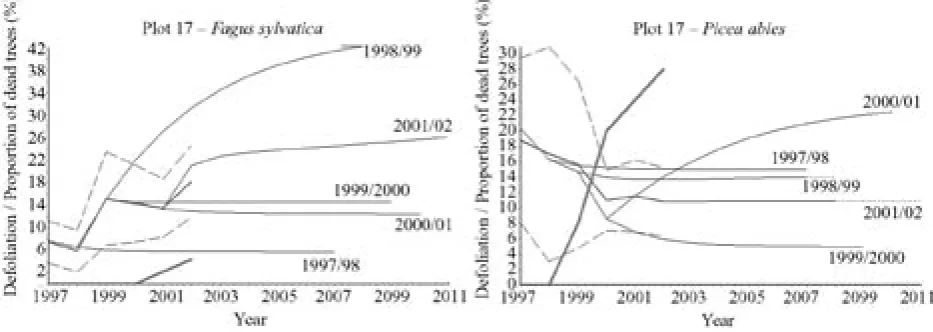
[image:10.595.62.531.110.340.2]Fig. 12. Average defoliation and mortality of trees in the beech and spruce natural mixed stand on plot No. 17. The used TDM programme shows models for further development of average defoliation
Fig. 13. Average defoliation and mortality of trees of Norway spruce in the stands on plots No. 18–20. The used TDM programme shows models for further development of average defoliation
ment model compared to other models (compare the relatively lower value of the second highest eigenvalue – Table 4).
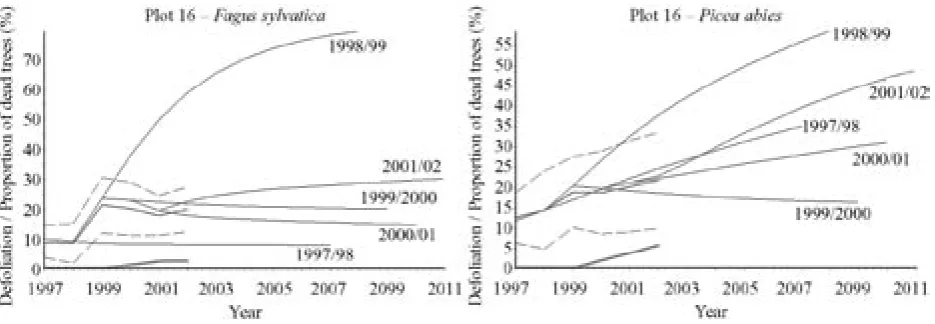
A relatively favourable trend of the health state de-velopment in the mixed stand of plot 15 has occurred by both spruce and beech since 2000 (Fig. 10). The spruce mortality in 2001 (approximately 5%) was caused by bark beetle, but the situation has stabilised. Regarding the presence of complex numbers among the eigenvalues of transition matrix for spruce in the
[image:11.595.66.525.423.764.2]climax, too. It is indicated by a mortality increase on plot 18 at 2002 (Fig. 13). Prediction of defoliation is very favourable at the highest altitudes in the Šumava Mts. area (plots 19 and 20; Fig. 13).
CONCLUSIONS
The results obtained in the period 1997–2002 have to be considered as preliminary and short-term regarding the necessity of long-term monitoring. Variability of climatic and air-pollution factors has to be taken into account in particular years, as well as increasing sensitivity to the biotic factors has to be respected at extreme situations of abiotic factors. As a result, increased sensitivity, forest stand damage and decline can be observed.
Considerably higher tolerance (against the effects of ex-treme air pollution and ecological stresses) was described by natural and semi-natural stands in the Forest District Plešný territory, compared to secondary monocultures in the Modrava area. The latter are heavily damaged by the bark beetle.
The higher level of stress tolerance and stability was shown by the mixed stands within the set of plots along the altitudinal gradient of the Plechý massif. The bark-beetle gradation is increasingly observed also in the Nor-way spruce stands of the Plešný District (plots 17–18). A deviation from the general trends was observed after the extreme winter 1998/1999, combined with ozone effects during the vegetation season 1999. These factors influ-enced beech defoliation. Even more visible ozone effects were registered in the year 2002, leading to damage of the assimilatory apparatus especially of broad-leaved tree species. Sycamore and rowan trees were more susceptible compared to beech.
To formulate the forest management targets, long-term tolerance trends of forest tree species have to be taken into account, and their ecological tolerance, amplitude, as well as the National Park zonation, forest functions and management potentials have to be respected.
References
LEGENDRE L., LEGENDRE P., 1983. Numerical Ecology. In Developments in Environmental Modelling. Vol. 3. Amster-dam, Elsevier: 419.
DÁLE P.E.R., HULSMAN K., 1988. To identify impacts in vari-able systems using anomalous changes: a salt marsh example. Vegetation, 75: 27–35.
DRAGOI S., ALBEANU G., 1998. Markov chain pro-gnosis model for allowable cut structure. Lesnictví, 44: 344–347.
HUENNEKE L.F., MARKS P.L., 1987. Stem dynamics of the shrub Alnus incana ssp. rugosa: transition matrix models. Ecology, 68: 1234–1242.
LIPPE E., DE SMIDT J.T., GLENN-LEWIN D.C., 1985. Markov models and succession: a test from a heathland in the Nether-lands. J. Ecol., 73: 775–791.
MENDOZA G.A., SETYARSO A., 1986. A transition matrix forest growth model for evaluating alternative harvesting schemes in Indonesia. Forest Ecol. Manag., 15: 219–228. SCOTT D., ROBERTSON J.S., ARCHIE W.J., 1990. Plant
dynamics of New Zealand tussock grassland infested with Hieracium pilosella. II. Transition matrices of vegetation changes. J. Appl. Ecol., 27: 235–241.
MANDL P., 1985. Pravděpodobnostní dynamické modely. Praha, Academia: 181.
MATĚJKA K., 1999. Monitoring stavu lesů v Národním parku Šumava – zpracování dat do roku 1999. [Depon. in K. Matějka, IDS Praha.] 31.
MATĚJKA K., VACEK S., SCHWARZ O., 1998. Modelování vývoje zdravotního stavu smrkových porostů Krkonoš s pou-žitím satelitních snímků. Lesnictví, 44: 333–343.
MORAVČÍK P., 1994. Monitoring a modelování reakce lesa na znečištění ovzduší a acidifikaci půd. Výpočet kritických zá-těží kyselé depozice pro lesní ekosystémy NP Šumava. [Dílčí zpráva pro MŽP ČR.] Davle, IFER: 13.
TESAŘ V., TEMMLOVÁ B., 1971. Olistění stromů jako krité-rium pro hodnocení stavu porostů v imisním území. Lesnictví, 17: 1017–1032.
ULBRICHOVÁ I., PODRÁZSKÝ V., 2000. Přirozené zmlazení lesních porostů v NP Šumava. In: PODRÁZSKÝ V., VACEK S., ULBRICHOVÁ I. (eds.), Monitoring, výzkum a manage-ment ekosystémů Národního parku Šumava. Sbor. ref. z celost. konf. Kostelec nad Černými lesy, 1.–2. 12. 1999. Praha, ČZU, LF, Lesn. Práce 2000: 6–9.
VACEK S., 1987. A mathematical model of defoliation dyna-mics of spruce forests due to immissions. Jíloviště-Strnady, VÚLHM, Commun. Inst. For. Čechosl., 15: 55–73.
VACEK S., JURÁSEK A., 1985. Olistění jako kritérium hodno-cení zdravotního stavu bukových porostů pod vlivem imisí. Lesnictví, 31: 579–600.
VACEK S., LEPŠ J., 1995. Dynamics of decline and horizon-tal structure of the autochthonous mountain Norway spruce stands. In: TESAŘ V. (ed.), Management of Forests Damaged by Air Pollution. Proc. of the Workshop IUFRO Trutnov, Czech Republic, June 5–9, 1994. Prague, Ministry of Agriculture: 9–14.
VACEK S., MATĚJKA K., 1999. The state of forest stands on permanent research plots in the Krkonoše Mts in years 1976–1997. J. For. Sci., 45: 291–315.
VACEK, S., MAYOVÁ J., 2000. Zdravotní stav lesních porostů na TVP v NP Šumava. In: PODRÁZSKÝ V. (ed.), Monitoring, výzkum a management ekosystémů Národního parku Šumava. Sbor. z celost. konf. Kostelec nad Černými lesy, 27.–28. 11. 2000. Praha, ČZU, LF: 142–152.
VACEK S., SOUČEK J., MAYOVÁ J., 2000. Struktura a zdra-votní stav vybraných lesních ekosystémů v NP Šumava. In: VACEK S. (ed.), Monitoring, výzkum a management ekosys-témů Národního parku Šumava. Sbor. z celost. konf. Kostelec nad Černými lesy, 1.–2. 12. 1999. Kostelec nad Černými lesy, Lesn. Práce 2000: 40–51.
ZLATNÍK A., 1976. Lesnická fytocenologie. Praha, SZN: 495.
Lesy Šumavy jsou v uplynulých dvou desetiletích zasaženy markantním imisně ekologickým zatížením, které zejména v nejvýše položených horských partiích způsobuje značné ekofyziologické oslabení porostů, pro-jevující se specifickými symptomy poškození (odlistění, projevy žloutnutí, nekrózy apod.). Lesní ekosystémy jsou zde značně ovlivňovány především kyselou depozicí, která již u celkové acidity na mnohých místech překroči-la kritickou hranici o 0,35–0,51 H kmol/ha za rok (MO
-RAVČÍK 1994). Vzniklá situace negativně působí nejen na produkční, ale především na ekologické funkce lesa, a to zejména v důsledku následného ataku škodlivých bio-tických činitelů (hmyzích škůdců, houbových patogenů apod.). Jejich expanze vede až k destrukci porostní struk-tury a následně i k silnému narušení ekologické stability a biodiverzity celých ekosystémů.
Cílem příspěvku je zhodnocení dynamiky zdravotního stavu alochtonních smrkových porostů na LS Modrava ve srovnání s přírodními smíšenými a smrkovými po-rosty na LS Plešný. Zdravotní stav smrkových mono-kultur na LS Modrava (3 TVP) i přirozených smíšených i smrkových porostů na LS Plešný (9 TVP) byl posuzo-ván především podle olistění. Doplňky hodnot olistění do 100 % byly označeny jako hodnoty defoliace a použity pro predikci vývoje defoliace a mortality na bázi přecho-dových matic. Dále byly hodnoceny znaky charakterizu-jící zdravotní stav koruny (poškození sněhem, námrazou, dřevokaznými houbami, hmyzem, ozonem atd.).
Jednotlivé hodnoty defoliace pro každý strom je možné zařadit do jedné třídy defoliace C1 až Cn. Pak momentální
stav porostu je možné popsat vektorem X = (x1, ... xn),
kde xi je počet hodnot zařazených do třídy Ci (resp. počet
stromů, u nichž byla hodnocena defoliace ve třídě Ci).
Vývoj poškození porostu lze popsat jako změnu stavu – vektoru X. Nechť stav v roce y je popsán vektorem Xy
a stav v roce následujícím vektorem Xy+1, potom můžeme
konstruovat model
Xy+1 = A . Xy
Čtvercová matice A je složena z pravděpodobností aij ,
že strom, mající defoliaci v roce y hodnocenou v třídě Ci,
bude mít v roce y + 1 defoliaci hodnocenou v třídě Cj. Tyto
pravděpodobnosti lze odhadnout z počtu stromů hodno-cených ve dvou následujících letech v jednotlivých třídách defoliace. Za nezměněných podmínek lze předpokládat, že tyto pravděpodobnosti se nebudou měnit i v následu-jícím období. Posloupnosti Y1, Y2, Y3, ... tvoří takzvaný
Markovův řetězec (viz např. MANDL 1985).
Model přechodových matic je základem programu pro hodnocení dat vývoje lesních porostů TDM [Tree Defolia-tion Modelling], který byl použit v této studii.
Pro každou plochu byla počítána série modelů vždy na základě klasifikace defoliace všech stromů jednoho druhu dřeviny vždy ve dvou po sobě následujících letech – tak byla vypočítána příslušná přechodová matice. Byly užity následující třídy defoliace: C1 = [0%, 10%), C2 = [10%,
30%), C3 = [30%, 50%), C4 = [50%, 70%), C5 = [70%,
90%), C6 = [90%, 100%].
Obdobně lze počítat i přechodové matice pro dvojice let, které po sobě bezprostředně nenásledují, čímž je možné vyloučit určité oscilace ve vývoji dané například některými náhodnými vlivy. Takto byly počítány přechodové matice pro období posledních tří let (1999–2002); tyto matice byly podrobeny další analýze za účelem zjištění jejich charakteru.
Pro analýzu přechodových matic je zásadní výpočet vlastních čísel a vlastních vektorů těchto matic. Minimálně jedno vlastní číslo λi = 1, přičemž vlastní
vek-tor odpovídající každému takovémuto vlastnímu číslu odpovídá stabilnímu stavu systému. Oscilace systému je možné očekávat v případě, že mezi vlastními čísly jedno
Vývoj zdravotního stavu lesních porostů na výzkumných plochách v Národním
parku Šumava
S. VACEK1, K. MATĚJKA2, J. MAYOVÁ1, V. V. PODRÁZSKÝ3
1Výzkumný ústav lesního hospodářství a myslivosti, Výzkumná stanice Opočno, Česká republika
2IDS Praha, Praha, Česká republika
3Česká zemědělská univerzita, Lesnická fakulta, Praha, Česká republika
ABSTRAKT: Příspěvek shrnuje hodnocení zdravotního stavu alochtonních smrkových porostů na LS Modrava a dále přiro-zených porostů na LS Plešný. Analýza byla založena na dendroekologických reakcích jednotlivých stromů v porostní skladbě. Poškození stromů, hodnocené především podle olistění, bylo sledováno každoročně v období 1997–2002. Nejvyšší úroveň tolerance jevily přírodní porosty na území LS Plešný, zejména porosty smíšené s dominancí buku, nejnižší naopak alochtonní smrkové porosty v oblasti LS Modrava. Porostní dynamika byla limitována aktivitou hmyzích škůdců, v první řadě lýkožrouta smrkového (Ips typographus). Jako mnohem častější se ve srovnání s rokem 1999 v roce 2002 projevily škody ozonem – nejvíce byl poškozen javor klen a jeřáb.
nebo více jich nabývá komplexních hodnot (LEGENDRE,
LEGENDRE1983).
Prezentovaný grafický výstup programu TDM zobrazuje průměrnou defoliaci stromů daného druhu, průměrnou defoliaci nejméně, resp. nejvíce poškozených stromů (hodnoty odpovídají spodnímu, resp. hornímu kvartilu při normálním rozdělení hodnot defoliace s daným vy-počítaným průměrem a směrodatnou odchylkou). Dále je znázorněn vývoj podílu odumřelých stromů v porostu a jednotlivé predikce dalšího vývoje počítané na základě dat. Zvláštní model byl počítán pro každou dvojici po sobě následujících let, v nichž byl porost na dané ploše hodnocen. Délka modelového období byla vždy 10 let. V modelech vývoje je vždy rozlišeno období, v němž je méně a více než 50 % odumřelých stromů (za odumřelé jsou uvažovány stromy hodnocené v rámci třídy C6). Po-rovnáním skutečného vývoje defoliace porostu s modelem v období bezprostředně následujícím po těch dvou letech, na jejichž základě byl model konstruován, lze usuzovat na to, jestli podmínky vývoje porostu zůstaly stabilní (sku-tečný stav odpovídá predikovanému) nebo se změnily (predikovaný a skutečný stav se výrazně liší). Uvažova-nými podmínkami mohou být jak podmínky vnější (např. klimatický výkyv) nebo vnitřní (například vyčerpání určité „pufrační“ kapacity ekosystému).
Z výsledků vyplývá, že alochtonní smrkové porosty na LS Modrava byly v uplynulém desetiletí ve značné míře postiženy četnými imisně ekologickými stresy. Destruk-ce těchto porostů pak vyvrcholila rozsáhlou kůrovcovou kalamitou, proto z 11 ploch (TVP 1–11) bylo olistění od r. 1997 hodnoceno pouze na třech z nich (TVP 1, 3, 7). Zatímco průměrné olistění smrkových porostů na sledovaných TVP se v r. 1997 pohybovalo v rozmezí 6,8–82,2 % (v průměru 56,3 %), v r. 2002 bylo již pouze v rozmezí 0–71,9 % (v průměru 45,8 %). Průměrné roční odlistění tedy kolísalo okolo 2,1 %. Přitom TVP 1 a 3 se v době svého založení nacházely na lokalitách středně zasažených žírem kůrovce a TVP 7 byla přímo v ohnis-ku jeho silného napadení. Destrukce jejího stromového patra v r. 2001 skončila, když byl na ploše lýkožroutem smrkovým napaden poslední smrk (obr. 2). Nad naše očekávání podstatně lépe probíhal vývoj poškození na TVP 3 (obr. 2). Zde nás velice překvapilo, že stromové patro této prostorově a věkově diferencované plochy do-sud značně odolává vlivu kůrovců, ačkoliv asi 25 m od ní vzdálená plocha (TVP 4 – minimálně prostorově dife-rencovaná smrčina) byla v letech 1992–1994 kůrovcem zcela zničena a nebyla asanována. V důsledku účelné asanace stromů napadených kůrovcem v bezprostředním okolí TVP 1 se zdravotní stav smrku na této ploše vyvíjí dosud relativně zdárně (obr. 2).
Na plochách 1 a 3 se po výrazném nárůstu defoliace v letech 1997–1998 a na TVP 1 i v r. 1999 posléze zdra-votní stav víceméně stabilizoval. Na TVP 3 dochází až do posledního sledovaného roku k nárůstu podílu odumře-lých stromů. Přesto je patrná poměrně příznivá predikce vývoje těchto porostů ve variantách podle trendů defo-liace v jednotlivých letech. Pokud zde bude lýkožrout
smrkový důsledně asanován, lze předpokládat, že se tyto porosty vzhledem ke své vitalitě budou zdárně vyvíjet. Predikce vývoje defoliace na TVP 1 byla již jednoznač-ná v r. 1997, přestože zde tlaku kůrovce odolávalo ještě několik relativně vitálních smrků. Poslední jedinci smrku odumřeli v průběhu r. 2001.
Z výsledků zdravotního stavu přírodě blízkých eko-systémů v masivu Plechého (TVP 12–20) vyplývá, že v r. 1997 hodnoty průměrného olistění na jednotlivých TVP víceméně sledovaly výškový gradient (obr. 4–6). K jejich výraznějšímu poklesu (o 10,7 % olistění) došlo až mezi TVP 17 a 18, tj. na rozhraní vrcholového fenomé-nu. V r. 1997 průměrné olistění na jednotlivých plochách kolísalo v rozpětí 77,4–93,0 % (v průměru 86,9 %), v r. 2002 to bylo 69,4–82,7 % (v průměru 74,9 %). Prů-měrné roční snížení olistění ve sledovaném období 1997 až 2002 tedy činilo 2,4 %. Výrazně nejvyšší bylo me-zi roky 1998–1999, kde dosáhlo 7,2 %. Značně se přitom lišilo v horních partiích transektu (TVP 18–20), tj. v ob-lasti vrcholového fenoménu. Zde v období 1998–1999 nedošlo v průměru ke snížení olistění, ale naopak k je-ho zvýšení o 0,9 %. Ke značnému meziročnímu pokle-su olistění v tomto období došlo ve středních a spodních partiích transektu (na TVP 12–17). Zde se pohybovalo mezi 7,7–14,8 % (v průměru 11,6 %). Výrazný pokles olistění v tomto období byl způsoben nejen silným poškozením a rozlámáním korun stromů mokrým sněhem i námrazou v průběhu zimy 1998/1999, ale i výrazným vlivem ozonu v průběhu vegetačního obdo-bí r. 1999.
V posuzovaných hodnotách olistění se nevyskytují příliš velké diference. K výraznější změně, která překra-čuje běžnou míru fluktuace, došlo v r. 1999 (ve srovnání s r. 1998) u buku. Bylo to způsobeno již zmíněnou ex-trémní klimatickou situací (mokrým sněhem a námra-zou), jejichž důsledkem bylo značné mechanické poško-zení korun, a to především u buku ve spodních partiích transektu, ale i vlivem ozonu (lžičkovité stáčení listů, chlorózy apod.). Podstatně výraznější projevy ozonu než v r. 1999 byly u buku i u ostatních listnáčů zaznamenány v r. 2002. Zejména u javoru klenu a jeřábu ptačího teh-dy došlo nejen k typickým chlorózám, ale i k nekrózám a předčasnému opadu listů.
Corresponding author:
Doc. RNDr. STANISLAV VACEK, DrSc., Výzkumný ústav lesního hospodářství a myslivosti, Výzkumná stanice Opočno, Na Olivě 550, 517 73 Opočno, Česká republika
tel.: + 420 494 668 391, fax: + 420 494 668 393, e-mail: [email protected]
Poměrně příznivá je po r. 2000 predikce vývoje defo-liace smrkobukového porostu na TVP 13 (obr. 8). Mírně příznivější je u smrku než u buku. Z tohoto hlediska je již horší situace na TVP 14 (obr. 9), a to především v důsled-ku poškození jedinců jeřábu a smrdůsled-ku ve 3. a 4. stromové třídě loupáním vysokou zvěří. Silný ohryz na kmenech jeřábu se výrazně projevil v poměrně strmém nárůstu defoliace s vysokým podílem odumřelých stromů po r. 2002. Přechodová matice počítaná pro poslední tříleté období u jeřábu ukazuje odlišnou míru konvergence mo-delu oproti jiným uvažovaným modelům (viz nízká dru-há nejvyšší hodnota vlastního čísla přechodové matice, tab. 4). Poměrně příznivé jsou také trendy vývoje zdra-votního stavu smíšeného porostu na TVP 15 po r. 2000, a to jak u buku, tak i u smrku (obr. 10). V r. 2001 byl na této ploše zaznamenán asi 5% nástup mortality smrku v důsledku žíru lýkožrouta smrkového, který se posléze stabilizoval. Vzhledem k výskytu komplexních hodnot mezi vlastními čísly přechodové matice pro vývoj de-foliace smrku v období 1999–2002 (tab. 4) lze očekávat určité oscilace v chování modelu. Podobně je tomu i ve smíšeném porostu na TVP 16 (obr. 11). Podstatně horší situace je v trendu vývoje smrkobukového porostu na TVP 17 (obr. 12). Zatímco vývoj buků je vzhledem k převládajícímu vývojovému stadiu v podstatě stabili-zovaný, tak nárůst mortality jedinců smrku v důsledku žíru lýkožrouta smrkového je značný, i když se po r. 2000 zmírnil. Při tomto trendu lze předpokládat, že v r. 2008 by již 50 % smrku bylo odumřelých. Vliv lý-kožrouta smrkového zde sahái do stupně klimaxových smrčin, což se projevuje zejména výrazným nárůstem mortality v roce 2002 na TVP 18 (obr. 13). Především pak ve smrčinách nejvyšších poloh Šumavy (na TVP 19 a 20 – obr. 13) je i pro nejbližší období predikce vývo-je defoliace velice příznivá.
Analýza trendů vývoje poškození porostů byla doplněna i podrobnou analýzou jednotlivých přechodových matic pro popis změny zastoupení stromů v jednotlivých třídách defoliace. Tím bylo odhaleno i mnoho zdánlivě skrytých trendů, které mohou být přehlédnuty při prostém pohle-du na vývoj průměrné defoliace. Tak např. na TVP 12 (obr. 6) je zřejmé, že u buku po kritické zimě 1998/1999 se stav olistění zdánlivě stabilizoval, vzhledem k výsledkům analýzy přechodové matice pro období 1999–2002 však můžeme v dalším vývoji očekávat určité oscilace (viz výskyt komplexních hodnot mezi vlastními čísly přechodové matice, tab. 4). Naopak u javoru klenu vzhle-dem ke značnému nárůstu defoliace v letech 2001–2002 predikce vývoje není zdaleka příznivá. Při tomto trendu by již v r. 2008 odumřelo více než 50 % stromů javoru klenu. Analýzou přechodové matice pro období posledních tří let můžeme zjistit, že může existovat více potenciálně stabilních stavů, které se však vyznačují převahou více defoliovaných stromů nebo stromů odumřelých (tab. 4).
Přechodová matice počítaná pro poslední tříleté období u jeřábu (TVP 14) ukazuje odlišnou míru konvergence modelu oproti jiným uvažovaným modelům (viz nízká druhá nejvyšší hodnota vlastního čísla přechodové matice, tab. 4).