Experimental Study on Phase Equilibria in the Vicinity of
X
,
W
and
H
Phases
in the Mg
Zn
Y Ternary System
Atsushi Hamaya
1, Toshiaki Horiuchi
1,+, Yuki Oohira
1, Satoshi Minamoto
2,
Seiji Miura
3and Norihito Sakaguchi
31Division of Mechanical Systems Engineering, Graduate School of Engineering, Hokkaido Institute of Technology,
Sapporo 006-8585, Japan
2Science & Engineering Systems Division, ITOCHU Techno-Solutions Corporation (CTC), Tokyo 100-6080, Japan
3Division of Materials Science and Engineering, Faculty of Engineering, Hokkaido University, Sapporo 060-8628, Japan
Three MgZnY ternary alloys in the vicinity ofX,WandHphases were prepared and were isothermally heat treated at 833, 793, 723 and 673 K to attain thermodynamic equilibrium. The microstructure was observed using electron probe microanalysis and transmission electron microscopy, and the chemical compositions of the equilibrium phases were analyzed using wavelength dispersive X-ray spectroscopy. The crystal structure of theWandHphases were analyzed using X-ray diffraction, electron back scattering diffraction and electron diffraction pattern obtained by transmission electron microscopy. The MgZnY ternary phase diagrams of the isothermal section were also calculated using the Thermo-Calc to compare with the experimental results. TheXphase was found to be solidified in high-Mg alloys not in a manner of eutectic reaction as reported previously but in a manner of peritectic reaction. The W phase has a Heusler (L21) type crystal structure with a
stoichiometric composition of Mg1Zn2Y1, andfine mesh texture composed of¡ (Mg) andWphases was occasionally observed in
non-equilibrium solidified parts, implying that the transientWphase has potential to be utilized as an additional strengthening phase. The equilibrium chemical composition of theHphase with a hexagonal crystal structure (P63/mmc) was found to be different from that of the previous reports.
[doi:10.2320/matertrans.MI201209]
(Received December 7, 2012; Accepted March 1, 2013; Published April 12, 2013)
Keywords: magnesiumzincyttrium, X phase, W phase, H phase, phase equilibria, phase diagram, Thermo-Calc
1. Introduction
Mg alloys, as the lightest practical metallic materials, have been applied in various fields to reduce the weight of products.1)In recent years, attention has been concentrated on
the MgZnY ternary alloy due to its remarkably high yield strength of 610 MPa, ductility and adequate strength at elevated temperatures of the Mg97Zn1Y2 (at%) alloy
compared with conventional Mg alloys.24) Although the strengthening mechanism of MgZnY alloys is still under investigation, it is considered to be mainly due to grain size refinement in Mg solid solution (¡ phase) and kinking strengthening by an intermediate phase (X phase; Mg12Zn1Y1),35) which has distinctive long-period stacking
ordered (LPSO) structures that vary with alloy composition or heat treatment.6) On the other hand, an intermetallic
compound (Wphase; Mg3Zn3Y2) has also received attention
in recent years as a new strengthening phase in MgZnY ternary alloys in addition to the ¡andXphases.7,8) Authors
have reported9)that theXphase is not solidified in a manner
of eutectic reaction as reported previously,10)but in a manner
of peritectic reaction. Moreover, the W phase is transiently formed from the liquid phase in high temperatures, and is disappeared after the subsequent isothermal heat treatment. This implies that the W phase has potential to be utilized as an additional transient strengthening phase in high-Mg alloys. Therefore, it is important to control the amount of
W phase for alloy design and microstructural control in the MgZnY ternary system.
The establishment of a phase diagram is crucial for efficient alloy development and optimization of
manufac-turing processes. However, only a few attempts have so far been made at establishing the MgZnY ternary phase diagram.1015) Thus the phase diagram still requires clarifi
-cation, especially in the vicinity of not only theXphase but also theWand H(Mg70Zn15Y15) phases, which affect phase
equilibria including the ¡ and X phases. Authors have recently reported that theW phase has a Heusler (L21) type
crystal structure with a stoichiometric composition of Mg1Zn2Y1, and that only Mg and Zn in the W phase may
be substituted for each other.16) However, the equilibrium
H phase could not be identified only by the chemical composition because the reported chemical compositions of theH,I(Mg30Zn60Y10) andZ(Mg28Zn65Y7) phases are very
close to each other.13) Shown in Fig. 1 are the previously reported chemical compositions of the H phase1315,17)
together with the calculated phase diagram of the isothermal section at 773 K in the MgZnY ternary system using Thermo-Calc.18) Although the reported value by Deng et al.17) is at a different temperature from the other three
reported values, there is considerable discrepancy among them. Therefore, further investigation is necessary to establish phase equilibria including the X,Wand Hphases, for control of the microstructure.
In the present study, three MgZnY ternary alloys including at least one of the X, W and H phases were prepared and were isothermally heat treated at various temperatures to reach thermodynamic equilibrium. After isothermal heat treatment, the microstructure and chemical compositions of the equilibrium phases of the alloys were investigated in order to establish phase equilibria in the vicinity of theX,WandHphases. Particular focus was placed on the equilibrium chemical compositions and the crystal structure of theHphase.
+Corresponding author, E-mail: horiuchi@hit.ac.jp
Special Issue on Long-Period Stacking Ordered Structure and Its Related Materials (I)
2. Experimental Procedure
Master ingots of three MgZnY ternary alloys were prepared from high-purity raw materials and a raw alloy: 99.95%Mg bar, 99.5%Zn sheet and small pieces of 99.9%Y and a Mg30 mass%Y alloy. These metals were melted in a 30.5-mm-diameter graphite crucible using a high-frequency induction furnace under a high-purity argon atmosphere, and were then cast into a steel mold and furnace cooled for approximately 2 h. The weight of each master ingot was ca. 100 g. Nominal chemical compositions of the alloys were Mg97.0Zn1.3Y1.7, Mg53.0Zn36.0Y11.0 and Mg25.0Zn58.0Y17.0
[image:2.595.51.290.61.328.2](at%). The chemical compositions of the alloys were analyzed using inductively coupled plasma-optical emission spectrometry (ICP-OES). Samples for isothermal heat treat-ment were cut into 20-mm-long ©4 square mm pieces and were encapsulated in lidded 6-mm-diameter graphite cruci-bles to avoid the reaction between molten Mg and water during water-quenching. The samples were then encapsulated again in quartz tubes with high-purity argon gas and were isothermally heat treated at 833, 793, 723 and 673 K for 2 2273 h to reach thermodynamic equilibrium. The isothermal heat treatment conditions for each alloy are tabulated in Table 1.
After isothermal heat treatment, the samples were quenched in water. The microstructure of each sample was observed using an electron probe microanalyzer (EPMA; JEOL JXA-8200) and transmission electron microscope (TEM; JEOL JEM-2000FX), and the chemical compositions of the equilibrium phases were analyzed using wavelength dispersive X-ray spectroscopy (WDS). In addition, the crystal structure of the Wand Hphases were analyzed using X-ray diffractometer (XRD; Rigaku SmartLab), electron back
scattering diffraction (EBSD) installed in field emission scanning electron microscope (FE-SEM; JEOL JSM-6500F) and electron diffraction pattern obtained by TEM. Finally, the phase equilibria and the equilibrium chemical compositions of the Hphase for each sample are summarized.
The MgZnY ternary phase diagram of the isothermal section at 723 K was also calculated using the Thermo-Calc software package18) with an CALPHAD thermodynamic database, which has been under development by the present authors, and were compared with the experimental results in the present study.
3. Results and Discussions
The analyzed chemical compositions of nominal Mg97.0
-Zn1.3Y1.7, Mg53.0Zn36.0Y11.0 and Mg25.0Zn58.0Y17.0 alloys
were Mg97.2Zn1.3Y1.5, Mg50.7Zn37.4Y11.9 and Mg21.8Zn59.4
-Y18.8 (at%), respectively, which were adopted to distinguish
the alloys.
Figure 2 shows backscattered electron images (BEIs) and analyzed chemical compositions of the black and gray regions obtained by EPMA for the Mg97.2Zn1.3Y1.5 alloy
after the isothermal heat treatment at 833 K. The authors have already reported9)from the resultant chemical compositions that the black and gray regions in Fig. 2 are the ¡ and X
phases, respectively. The gray regions and mesh texture are considered to be the liquid phase existing during the isothermal heat treatment. The estimated formation process of solidification microstructure shown in Fig. 2(b) is Shao et al. (773 K)13)
Gröbner et al. (773 K)15)
Deng et al. (823 K)17)
Tsai et al. (773 K)14)
calculation by Thermo-Calc
Mg
Mg (at%) Zn Y
10 40 30 20
50 60
70 80
90
90 60
70 80 50 40 30 20 10
90 80 70 60 50 40 30 20 10 (Mg,Zn)Y
I (a)
X
W
Z H
Y 25
Y 20
Y 15
(at%) Y 10
(b)
Fig. 1 (a) The calculated phase diagram of the isothermal section at 773 K using Thermo-Calc and (b) previously reported chemical compositions of theHphase.1315,17)
Table 1 Isothermal heat treatment conditions for each alloy.
Analyzed chemical composition (at%)
Holding time,t/h
833 K 793 K 723 K 673 K
Mg97.2Zn1.3Y1.5 2.0 72 ® ®
Mg50.7Zn37.4Y11.9 2.0 72 1000 ®
Mg21.8Zn59.4Y18.8 24 300 2273 2000
300μμm (a)
Mg Zn Y (at%)
87.2 gray regions: X
6.36.5 98.4
black regions: α 0.7 0.9
black region gray region (b)
10μm 2μm
mesh texture (c)
Fig. 2 BEIs and analyzed chemical compositions9)of the black and gray
regions for the Mg97.2Zn1.3Y1.5alloy after the isothermal heat treatment at
[image:2.595.306.547.121.375.2]schematically illustrated in Fig. 3. The ¡ phase was seemingly solidified as a primary phase from the liquid (Fig. 3(a)). During the subsequent quenching, the X phase appeared at the surface of the¡phase and presented oriented crystal growth in a manner of peritectic reaction,9)and thus surface asperity of the ¡ phase was formed (Fig. 3(b)). Finally, the ¡-W eutectic lamellar structure was produced from the remaining concentrated liquid (Fig. 3(c)). Figure 4 represents a TEM bright field image (BFI) for mesh texture obtained in the present study. The chemical compositions of
the black and white parts were analyzed using energy dispersive X-ray spectroscopy (EDS) and are also indicated in Fig. 4. The results represent that black and white parts are considered to be the ¡ and W phases, respectively. As was indicated in our previous study,9) the W phase in the
Mg97.2Zn1.3Y1.5 alloy was completely disappeared after the
isothermal heat treatment at 793 K. It implies that the W
phase is considered to be in equilibrium with the ¡ and X
phases only in high temperatures, and the transient Wphase has potential to be utilized as an additional strengthening phase in this alloy.
Shown in Fig. 5 is a BEI for the Mg50.7Zn37.4Y11.9 alloy
after the isothermal heat treatment at 723 K. The micro-structure is composed of black, dark gray and light gray regions. The chemical compositions of these three regions were analyzed using WDS and are also represented in Fig. 5. As a result of analyzed chemical compositions, the black region is considered to be the¡phase, while dark gray and light gray regions are not identified because their chemical
α
α
L
α
α
α
L
α
X
α
α
α
X
α
+W
(a)
(b)
(c)
Fig. 3 Schematic illustration of the estimated formation process of solidification microstructure for the Mg97.2Zn1.3Y1.5 alloy shown in
Fig. 2(b).
Mg Zn Y (at%)
22.2
white part: W 32.3 45.6
99.5
black part:αα 0.3 0.2
500nm black part
white part
Fig. 4 TEM BFI for mesh texture and analyzed chemical compositions of the black and white parts for the Mg97.2Zn1.3Y1.5alloy after the isothermal
heat treatment at 833 K.
Mg
Zn
Y
(at%)
97.2
2.8
25.7
58.3
16.0
26.3
49.5
24.2
dark gray region :
W
black region:
αα
light gray region :
H
10
μ
m
dark gray
region
black
region
light gray
region
[image:3.595.59.277.69.608.2] [image:3.595.307.549.70.164.2] [image:3.595.307.549.218.513.2]compositions are rather similar to each other, and are not the same as the reported values.1315,17)The subsequent analysis of a crystal structure using EBSD was thus conducted. Figure 6 represents a BEI and an inverse pole figure (IPF) map for a bcc crystal structure of this sample. The dark gray regions in Fig. 5 such as inside rectangle in Fig. 6 were painted in IPF map, indicating that it was identified as a bcc-based phase, while the light gray regions in Fig. 5 such as inside ellipsoid in Fig. 6 were not. Therefore, it could be concluded that the dark gray region was theWphase, which has a bcc-based Heusler (L21) type crystal structure with a
stoichiometric composition of Mg1Zn2Y1.16)Shown in Fig. 7
are the experimental electron diffraction pattern from the light gray region obtained by TEM and the calculated one for the same incident direction using CrystalMaker software package with literature data by Deng et al.17) They are in fairly good agreement, and thus it seems reasonable to conclude that the light gray region is the H phase, which has the same hexagonal crystal structure as the previous report (P63/mmc). However, as shown in Figs. 1 and 5, the
chemical composition of theHphase in the present study is different from the reported value by Denget al.17)
Figure 8 represents a BEI for the Mg21.8Zn59.4Y18.8 alloy
after the isothermal heat treatment at 723 K. The micro-structure is composed of dark gray and light gray regions,
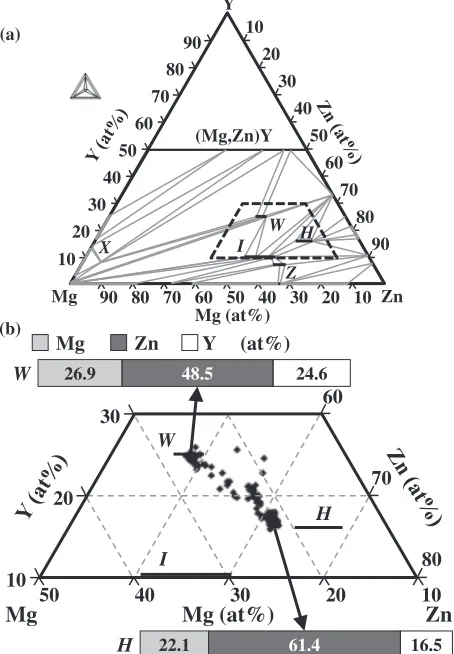
which show relatively complicated shapes with a size almost comparable to the probe diameter of the EPMA. Therefore, chemical compositions from many (170) points were randomly selected and analyzed using WDS as shown in Fig. 9 to determine the tie-line between the two equilibrium phases. Almost all the data are on a line with a deviation of about 1 at%, which might be in the allowable limit of the accuracy of the analysis by WDS. Finally, the chemical composition at each end of the line was adopted as the equilibrium one of each phase, and is represented in the figure. The calculated phase diagram of the isothermal section at 723 K using Thermo-Calc is also represented in Fig. 9. Although the chemical compositions of the Hphase are slightly different between the experimental value and calculated one, the experimentally determined two equi-librium phases are considered to be theWandHphases from their chemical compositions. Shown in Fig. 10 are the X-ray diffraction patterns for the Mg50.7Zn37.4Y11.9 and Mg21.8
-Zn59.4Y18.8alloys after the isothermal heat treatment at 723 K.
The spectra for the ¡, W and H phases and the W and H
phases were clearly observed in the Mg50.7Zn37.4Y11.9 and
Mg21.8Zn59.4Y18.8 alloys, respectively. Considering resultant
analyzed chemical compositions in Fig. 5, it could be concluded that the dark gray and light gray regions in Fig. 8 were theWand Hphases, respectively.
111
101
001
bcc
20
μμ
m
20
μ
m
(a)
(b)
Fig. 6 (a) BEI and (b) IPF map for a bcc crystal structure for the Mg50.7Zn37.4Y11.9alloy after the isothermal heat treatment at 723 K.
Diffraction pattern from the light gray region
Calculated diffraction pattern for P63/mmc
(a) (b)
010 101
111
– –
Incident direction: [101]–
Fig. 7 (a) Electron diffraction pattern from the light gray region in Fig. 4 and (b) the calculated one using CrystalMaker software package with literature data by Denget al.17)
10
μμ
m
dark gray region
light gray region
Fig. 8 BEI for the Mg21.8Zn59.4Y18.8 alloy after the isothermal heat
[image:4.595.49.290.65.436.2] [image:4.595.315.537.71.207.2] [image:4.595.306.547.265.434.2]Equilibrium phases for each alloy were determined in a similar manner and are summarized in Table 2. TheHphase appeared as an equilibrium phase after isothermal heat treatment in the Mg50.7Zn37.4Y11.9 and Mg21.8Zn59.4Y18.8
alloys, and the analyzed equilibrium chemical compositions are represented in Fig. 11 with the previously reported
ones.1315,17) It was clarified that the equilibrium chemical composition of the H phase in the same alloy was almost constant regardless of temperature, and that only the Mg and Zn contents in the H phase varied a little with alloy composition, while the Y content was almost constant. This indicates that only Mg and Zn can substitute with each other in the H phase. Li et al. reported that the H phase had a ternary solubility of Mg in the YZn5phase by substitution of
Zn.19)The results in the present study agree rather well with
their report in terms of the Y content in theHphase, whereas the equilibrium chemical composition of the H phase is different from that of the previous reports, especially for the Mg content, as shown in Fig. 11. As far as the present results, the equilibrium Y and Mg contents in the H phase are approximately 16 and 2226 at%, respectively.
The calculated phase diagram of the isothermal section at 723 K in the MgZnY ternary system using Thermo-Calc is also represented in Fig. 11. As a result of the calculation, the Mg50.7Zn37.4Y11.9 alloy was evaluated to be in the ternary
phase equilibria of ¡, W and I phases at 723 K, which is different from the experimental results in the present study. This alloy should be in the ternary phase equilibria of¡,W
Mg Mg (at%) Zn Y 10 40 30 20 50 60 70 80 90 90 60 70 80 50 40 30 20 10
90 80 70 60 50 40 30 20 10 (Mg,Zn)Y X W Z I H (a)
Mg
Mg (at%)
Zn
10 30 20 80 60 70
50 40 30 20 10
22.1 61.4 16.5 26.9 48.5 24.6
Mg Zn Y (at%)
W H W H I (b)
Fig. 9 (a) The calculated phase diagram of the isothermal section at 723 K using Thermo-Calc and (b) analyzed chemical compositions of randomly selected points and the determined equilibrium chemical composition of each phase for the Mg21.8Zn59.4Y18.8 alloy after the isothermal heat
treatment at 723 K.
Intensity
Mg 6.6Zn21.8Y7.6(H)
Mg3Zn3Y2(W)
Mg (αα) Mg3Zn3Y2(W) Mg (α α ) Mg 6.6Zn21.8Y7.6(H)
Mg50.7Zn37.4Y11.9(723 K) (a)
Mg21.8Zn59.4Y18.8(723 K)
100 2θ(degree)
60 40
10 20 30 50 70 80 90
(b)
Fig. 10 X-ray diffraction patterns for the (a) Mg50.7Zn37.4Y11.9 and
(b) Mg21.8Zn59.4Y18.8alloys after the isothermal heat treatment at 723 K,
[image:5.595.56.283.74.401.2]together with XRD patterns of phases.
Table 2 Equilibrium phases for each alloy after isothermal heat treatment.
Analyzed chemical composition (at%)
Equilibrium phases
833 K 793 K 723 K 673 K
Mg97.2Zn1.3Y1.5 L+a a+X ® ®
Mg50.7Zn37.4Y11.9 L+W L+W+H a+W+H ®
Mg21.8Zn59.4Y18.8 W+H W+H W+H W+H
Mg21.8Zn59.4Y18.8(833 K)
Mg21.8Zn59.4Y18.8(793 K)
Mg21.8Zn59.4Y18.8(723 K)
Mg21.8Zn59.4Y18.8(673 K)
Mg50.7Zn37.4Y11.9(723 K)
Mg50.7Zn37.4Y11.9(793 K)
Shao et al. (773 K)13)
Gröbner et al. (773 K)15)
Deng et al. (823 K)17)
Tsai et al. (773 K)14)
calculation by Thermo-Calc
Y 25 Y 20 Y 15 (at%) Y 10 (b)
presumption by the present study
Mg Mg (at%) Zn Y 10 40 30 20 50 60 70 80 90 90 60 70 80 50 40 30 20 10
[image:5.595.307.548.182.445.2]90 80 70 60 50 40 30 20 10 (Mg,Zn)Y X W Z H (a) H I
Fig. 11 (a) The calculated phase diagram of the isothermal section at 723 K using Thermo-Calc and (b) equilibrium chemical compositions of theH
phase determined in the present study, together with the ones in the previous reports.1315,17)Presumed phase boundaries are also indicated by
[image:5.595.57.283.479.657.2]and H phases at 723 K as described above. Therefore, the CALPHAD thermodynamic database should be modified, especially in the vicinity of the Hphase as indicated by the dotted line in Fig. 11. The authors have been assessing it based on the experimental results obtained in the present study. The newly assessed database and the calculated phase diagrams in the MgZnY ternary system using Thermo-Calc, which could be quite helpful for alloy design and microstructural control including theX,WandHphases will be represented in our next paper.
Acknowledgments
The authors are indebted to Kenji Ohkubo, CAREM, Hokkaido University, for their assistance in the EBSP and TEM analyses and other experimental techniques. This work was conducted as a part of ‘Materials Science on Synchronized LPSO Structure’collaborative reseach project by Grant-in-Aid for Scientific Reseach on Innovative Areas from the Ministry of Education, Culture, Sports, Science and Technology (MEXT) of Japan.
REFERENCES
1) I. J. Polmear:Mater. Sci. Technol.10(1994) 116.
2) Y. Kawamura, K. Hayashi, A. Inoue and T. Masumoto:Mater. Trans. 42(2001) 11721176.
3) A. Inoue, Y. Kawamura, M. Matsushita, K. Hayashi and J. Koike:
J. Mater. Res.16(2001) 18941900.
4) E. Abe, Y. Kawamura, K. Hayashi and A. Inoue:Acta Mater.50(2002) 38453857.
5) C. Sanchez, G. Nussbaum, P. Azavant and H. Octor:Mater. Sci. Eng. A 221(1996) 4857.
6) T. Itoi, T. Seimiya, Y. Kawamura and M. Hirohashi:Scr. Mater.51 (2004) 107111.
7) S. Yoshimoto, M. Yamasaki and Y. Kawamura:Mater. Trans.47(2006) 959965.
8) S. Fudetani, T. Itoi, T. Kubo, Y. Kawamura and M. Hirohashi:Mater. Trans.50(2009) 349353.
9) T. Horiuchi, A. Ono, K. Yoshioka, T. Watanabe, K. Ohkubo, S. Miura, T. Mohri and S. Tamura:Mater. Trans.49(2008) 22472253.
10) E. M. Padezhnova, E. V. Mel’nik, R. A. Miliyevskiy, T. V. Dobatkina and V. V. Kinzhibalo: Russ. Metall.4(1982) 185188.
11) B. N. Zaselyan, P. Y. Sal’dau and S. K. Afanas’yev: Russ. Metall.6 (1968) 130133.
12) G. Shao, V. Varsani, Y. Wang, M. Qian and Z. Fan:Intermetallics14 (2006) 596602.
13) G. Shao, V. Varsani and Z. Fan:Calphad30(2006) 286295.
14) A. P. Tsai, Y. Murakami and A. Niikura: Philos. Mag. A80(2000) 10431054.
15) J. Gröbner, A. Kozlov, X. Y. Fang, J. Geng, J. F. Nie and R. Schmid-Fetzer:Acta Mater.60(2012) 59485962.
16) T. Horiuchi, H. Ikee, A. Hamaya, S. Minamoto, S. Nomoto and S. Miura:Mater. Sci. Forum706709(2012) 11701175.
17) D. W. Deng, K. H. Kuo, Z. P. Luo, D. J. Miller, M. J. Kramer and K. W. Dennis:J. Alloy. Compd.373(2004) 156160.
18) J.-O. Andersson, T. Helander, L. Hoglund, P. Shi and B. Sundman:
Calphad26(2002) 273312.