Munich Personal RePEc Archive
Does Renewable Energy Consumption
and Health Expenditure Decrease
Carbon Dioxide Emissions? Evidence for
sub-Saharan Africa Countries
Apergis, Nicholas and Ben Jebli, Mehdi
1 August 2015
Online at
https://mpra.ub.uni-muenchen.de/68294/
1
Does Renewable Energy Consumption and Health Expenditure Decrease Carbon
Dioxide Emissions? Evidence for sub-Saharan Africa Countries
Nicholas Apergis
University of Piraeus, Piraeus, Greece
Mehdi Ben Jebli
University of Jendouba, FSJEG de Jendouba, Tunisia
2
Does Renewable Energy Consumption and Health Expenditure Decrease Carbon
Dioxide Emissions? Evidence for sub-Saharan Africa Countries
Abstract
This paper employs a number of panel methodological approaches to explore the link between
per capita carbon dioxide emissions, per capita real income, renewable energy consumption
and health expenditures for a panel of 42 sub-Saharan African countries, spanning the period
1995-2011. The empirical findings provide supportive of a long-run relationship among the
variables. Granger causality reveals the presence of a short-run unidirectional causality
running from real GDP to CO2 emissions, a bidirectional causality between renewable energy
consumption and CO2 emissions, a unidirectional causality running from real GDP to
renewable energy consumption, and a unidirectional causality running from real GDP to heath
expenditure, while long-run estimates document that both renewable energy consumption and
health expenditures contribute to the reduction of carbon emissions, while real GDP leads to
the increase of emissions in these countries. The results are expected to be of high importance
for policymakers in the region. Both renewable energy consumption and expansionary health
expenditures are the major drivers of pollution declines. In that sense the findings imply that a
substantial part of the state budget in relevance to health expenditures would be a good path to
combat global warming in these countries.
Keywords: carbon emissions; renewable energy consumption; health expenditures; panel
3 1. Introduction
The World Health Organization (WHO, 2015) argues that the International Energy Agency
has recorded that 18% of global carbon dioxide (CO2) emissions are attributed to energy and
the fuel use by the residential sector. The expansion of greenhouse gases emissions caused by
these substances will made a serious danger on the environmental situation and on human
health. As a result, the adoption of other clean fuel technologies (renewables, such as biogas)
or clean renewable technologies (renewable energy, such as solar, wind, and geothermal) can
substantially reduce emissions of climate change pollutants by about 0.4-0.9 billion tons of
CO2 between 2010 and 2020.
It is quite important to display that renewable energy investments began to be
progressively significant in the international markets. Numerous empirical studies have
considered the vital role of renewable energy sources in the simulation of economic growth
and in the reduction of the pollution degree in African countries. Empirically, Ben Jebli et al.
(2016) examine the role that renewable energy consumption can play in the mitigation of
emissions. The authors consider a panel of 24 sub-Saharan Africa countries and make use of
panel cointegration methodologies in their analysis. They recommend that the benefits from
technology transfers (i.e., trade exchanges) are a good path to increase their renewable energy
sources and decrease carbon emissions level. Additionally, for a panel of 51 sub-Saharan
Africa countries, Ozturk and Bilgili (2015) examine the long-run dynamics between GDP
growth and biomass energy consumption. Their evidence shows a significant impact of
biomass consumption on GDP growth.
Moreover, there is much consideration that health care facilities play an important role
in the stability of climate changes. In fact, health care facilities have been estimated to
represent between 3% and 8% of the climate change footprints in developed country (the US
4
a national level across South-East Asian and sub-Sahara African countries. While no such
health sector estimates exist elsewhere on a national level, both electricity access and hospital
electricity consumption data in countries of South-East Asia and sub-Saharan Africa reflect
far lower energy use rates (Energy Efficiency in Hospital, 2009). In addition, it has been
estimated that between 200.000 and 400.000 hospitals and health clinics in developing
countries have no electricity or have unreliable electric supplies (WHO, 2015).
The paper considers the dynamic causal links between carbon dioxide (CO2)
emissions, economic growth (i.e., real output), renewable energy consumption and health
expenditures in the case of a panel framework. In this work, we consider another driver that
may control the environmental situation. Thus, it is really interesting to think about the role of
health expenditures in the mitigation of emissions when renewable energy is used for
production. In other words, the expansion of health expenditures is significant if growth in
renewable energy is strong enough. The installation of solar photovoltaic or wind mills could
be a good idea to feed health facilities in electricity. Moreover, encouraging developing
countries to adopt clean technologies turns out to be a good policy to stimulate higher health
quality and decreased carbon emissions levels. In particular, this study will investigate the
dynamic causal links between CO2 emissions, real GDP, renewable energy consumption and
health expenditure for a panel of sub-Saharan Africa countries, using panel methodological
approaches. We chose a panel of sub-Saharan African countries because there is not any
empirical study so far that explores this region. In addition, these countries are rich in
renewable resources, while investment projects in renewable technologies are crucially
needed for the development of their economies.
In this paper, we attempt to discuss the interaction that may exist between renewable
energy consumption and health expenditures along with the impact on their environmental
5
empirical studies that have considered the dynamic links between these variables in this area.
In addition, policymakers are expected to gain from the empirical findings in this analysis,
while they will push them to consider seriously the health conditions of their citizens through
the increase in health spending and the integration of clean technologies in their production
round. Therefore, these projects will allow the further stimulation of their production growth,
advancing their health quality and eliminating pollution levels caused by carbon emissions.
Earlier empirical analysis discusses the bidirectional interdependence between
renewable energy consumption and economic growth (e.g., Sadorsky, 2009; Apergis and
Payne, 2010a, 2010b, 2011; among others) or between renewable energy consumption and
CO2 emissions (e.g., Apergis et al., 2010; Menyah and Rufael, 2010; Ben Jebli et al., 2015;
Ben Jebli et al., 2016; Ben Jebli and Ben Youssef, 2015; among others). These previous
empirical studies document that the presence of Granger causality as well as the direction of
causality between output, renewable energy consumption and carbon emissions depends on
the selected data, period under study and the methodologies used. Moreover, the strongest
bidirectional causality between renewable energy and economic growth supports the feedback
hypothesis either for the short or the long-run association among variables. Several other
determinants (i.e., trade, tourism) of carbon emissions have been also taken into consideration
in the recent literature, i.e. Ben Jebli and Ben Youssef (2015) and Ben Jebli et al. (2015) for
the case of Tunisia. Trade is one of the decisive factors that influence the growth of pollution
caused by those emissions. For a panel of OECD countries, Ben Jebli et al. (2015) illustrate
that increasing trade or renewable energy reduces carbon emissions, while they recommend
that more trade and more renewable energy consumption are efficient strategies to combat
global warming in these countries. Other studies have considered that tourism may also have
an impact on the degradation of environmental conditions. Ben Jebli et al. (2015) provide a
6
renewable, waste consumption and international tourism in the case of Tunisia. Their results
highlight that combustible renewable, waste consumption and international tourism all
contribute to the increase of carbon emissions.
In the literature, there are no sufficient empirical studies that investigate the
relationship between health expenditures and any other determinant, such as real output and
carbon emissions). Jerret et al. (2003) explore the relation between healthcare expenditures
and environmental factors in Canada (i.e., for 49 counties of Ontario) using a sequential two
stage regression model to control for variables that may affect such expenditures. Their results
document that both total toxic pollution output and per capita municipal environmental
expenditures display significant relationships with health expenditures. In addition, the
authors suggest that counties with higher pollution output levels demonstrate higher per capita
health expenditures, while those that spend more on defending environmental quality levels
demonstrate lower expenditures on health care.
The remaining of the paper is organized as follows. Section 2 describes the data set
used and the empirical methodology employed. Section 3 presents the empirical results, while
Section 4 provides a discussion of the findings obtained. Finally, Section 5 concludes the
paper.
2. Data and empirical methodology
2.1. Data
Annual data are obtained from the Word Bank Development Indicators (WDI, 2015) online
database for a panel of 42 sub-Saharan Africa countries1, spanning the period 1995-2011. The
variables used for the empirical study are per capita carbon dioxide emissions (CO2),
1
7
measured in metric tons of oil equivalent, per capita real gross domestic product (Y),
measured in constant 2005 prices, renewable energy consumption (RE), measured as a share
of total final energy consumption, health expenditures (HE), measured as a share of total
GDP. Depending on data availability, the empirical analysis includes the maximum number of
observations.
2.2. Empirical methodology
The empirical analysis considers a model that examines the dynamic causalities between CO2
emissions, real GDP, renewable energy consumption and health expenditures. Precisely, we
have considered that health expenditures can have an important impact on the environmental
situation. Thus, our empirical model is developed as follows:
2it ( it, it, it)
CO f Y RE HE (1)
The natural logarithmic transformation of Eq. (1) yields the following equation:
2it i i 1i it 2i it 3i it it
LNCO t LNY LNRE LNHE (2)
where LN denotes logarithmic transformations, i1,...,Nfor each country in the panel,
1,...,
t Tdenotes the time period and denotes the stochastic error term. The parameter i
allows for the possibility of country-specific fixed effects.
Before testing the integration order of the analysis time series, it is essential to
proceeds through testing the degree of cross-sectional dependence (CD) through the statistic
recommended by Pesaran (2004). The residual statistic test of Pesaran (2004) allows selecting
which panel unit root tests can be chosen: either first-generation unit root tests (traditional
panel unit root tests) or second-generation unit root tests. Traditional panel unit root tests of
the first generation used on the present study are five: Breitung (2000), Levin et al. (2002), Im
8
(1988). The employment of second generation unit toot test by Pesaran (2007) is more
suitable for testing the stationary proprieties of variables. The cross-sectional augmented IPS
(CIPS) unit root test, developed by Pesaran (2007), supports the null hypothesis of a unit root,
while the alternative hypothesis suggests that the variable is stationary. The Pesaran (2004)’s
test is computed from the augmented Dickey-Fuller (1979) regression corresponding to each
variable in the model. This statistic is measured as an average of all pair-wise correlation
estimated coefficients. The null hypothesis of the CD test suggests that residual cross-section
is independent, while the alternative hypothesis reveals that residual is dependent.
Next, to determine the integration order of the analysis variables is needed to examine
the cointegration between them. If the variables are integrated of order one then we
investigate the presence of a long-run association within a heterogeneous panel using
Pedroni’s (2004) panel cointegration approach. The null hypothesis is that there is no
cointegration, while the alternative hypothesis is that variables are cointegrated. All the tests
are running with individual intercept and deterministic trend. The deviation to the long-run
relationship is determined by the residuals presented in equation (2).
If there is a long-run relationship between variable, then we estimate the long-run
coefficients using both the fully modified OLS (FMOLS) approach proposed by Pedroni
(2001, 2004) and the dynamic OLS (DOLS) methodological approach developed by Kao and
Chiang (2000) and Mark and Sul (2003). Both of these methodologies are substantially
effective, given that they take explicitly into account the endogeneity of regressors, while they
correct for serial correlation.
The last step of the empirical analysis involves the testing of both the short- and
long-run causalities between CO2 emissions, real GDP, renewable energy consumption and health
expenditures through the two steps procedure recommended by Engle and Granger (1987).
9
11 12 13 14
2 1
21 22 23 24
2
1 31 32 33 34
3
41 42 43 44
4
p p p p
it
q
p p p p
it
p p p p p
it
p p p p
it LNCO LNY LNRE LNH
(3)2 1 1 1
1 2 2
1
1 3 3
1 4 4
it it it it it it it it it LNCO LNY ect LNRE LNH
where is the first difference operator; the autoregression lag length, q, is determined by the
Schwarz Information Criterion (SIC); is a random error term; ect is the error correction
term derived from the long-run relationship of equation (2). We consider the pairwise Granger
causalities tests for the short-run relationships. These tests are established by the significance
of the F-statistics. Moreover, the computed t-statistics of the lagged ect corresponding to each
equation presented in the VECM are designed to examine the significance of the long-run
relationships.
3. Empirical analysis
The results of the CD test are reported in Table 1 and indicate the rejection of the null
hypothesis of no cross-section dependence in the panel.
[Insert Table 1 about here]
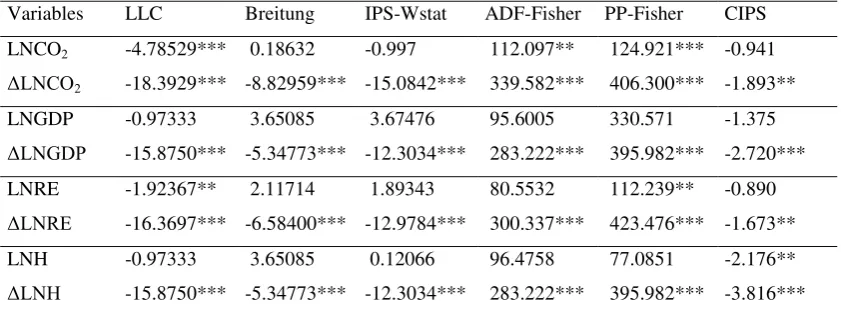
Thus, the traditional unit root tests (first-generation) provide bias of estimation. So, it is
desirable to use the second generation unit root tests to check for the order of integration of
each analysis variable. The panel unit root tests results of the first and the second generation
are reported in Table 2. These findings indicate that all variables under investigation are
integrated of order one.
10
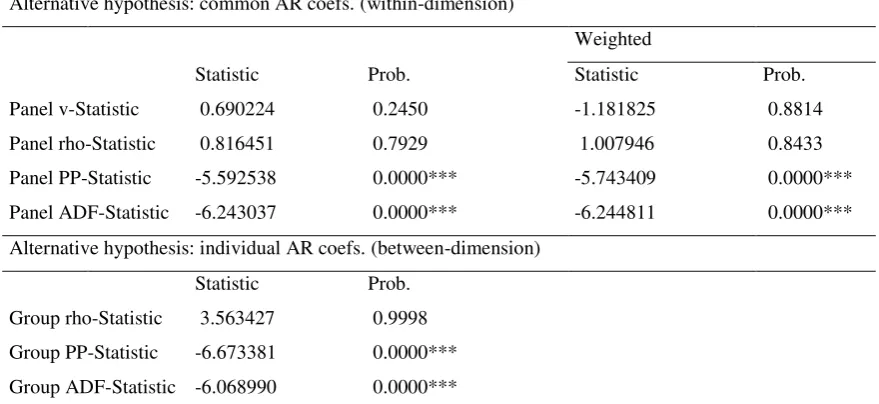
Next, the long-run cointegration properties are explored through Pedroni (2004)’s
cointegration tests. Table 3 reports the results of the seven tests proposed by Pedroni (2004).
They illustrate and confirm the presence of cointegration across the variables under study.
[Insert Table 3 about here]
In the following stage of the empirical analysis, The long-run elasticities are computed using
both FMOLS and DOLS methodologies. The estimations include both an intercept and a
deterministic trend. The results are reported in Table 4 and they document that all coefficients
are statistically significant at the 1% level. According to these elasticity estimates, real GDP is
positively associated with increased pollution levels caused by carbon emissions, while both
renewable energy consumption and health expenditures contribute to lower levels of
emissions in the long-run. In particular, the FMOLS long-run estimates highlight that a 1%
increase in real GDP leads to increases in carbon emissions by 1.09%, while a 1% increase in
both renewable energy consumption and health expenditures leads to lower carbon emissions
by 0.29% and 0.21%, respectively. In terms of the DOLS methodological approach, the
log-run estimates indicate that a 1% increase in carbon emissions leads to increases in real GDP
by 1.05%, while a 1% increase in both renewable energy consumption and health
expenditures leads to lower emissions by 0.32% and 0.17%, respectively.
[Insert Table 4 about here]
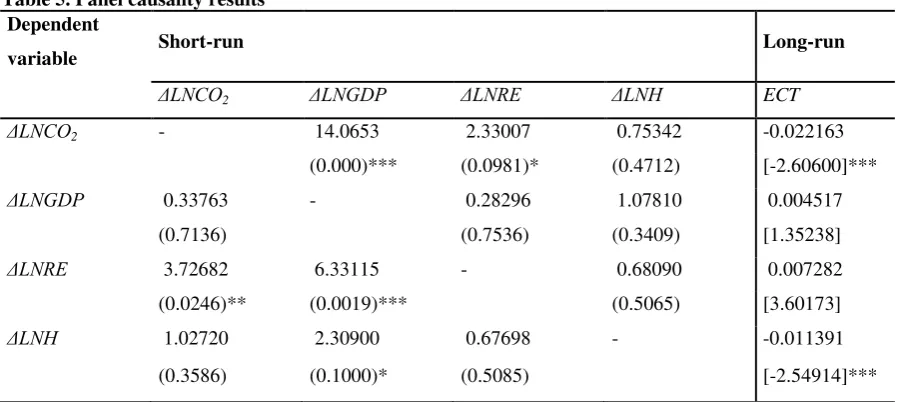
Next, the results of the causality tests for both the short- and the long-run relationships are
reported in Table 5. According to the significance of the F-statistics of the pairwise Granger
causality results, in the short-run, there is i) a unidirectional causality running from real GDP
to carbon emissions; ii) a bidirectional causality between carbon emissions and renewable
energy consumption; iii) a unidirectional causality running from real GDP to renewable
energy consumption; and v) a unidirectional causality running from real GDP to health
11
records that the error correction terms in both the carbon emissions and health expenditures
equations are statistically significant at the 1% level, indicating that there is a bidirectional
long-run causality between carbon emissions and health expenditures.
[Insert Table 5 about here]
Finally to provide robust evidence to the above causality tests, we will attempt to identify the
direction and sign of causality through the panel causality test developed by Canning and
Pedroni (2008). The test makes use of the corresponding to panel cointegration error
correction model. However, the test, as well as the algorithm associated with it, is valid only
for bivariate modeling approaches. Therefore, we will explore the size of causality between: i)
carbon emissions and heath expenditures, ii) real income and carbon emissions, iii) real
income and renewable energy, iv) carbon emissions and renewable energy, and v) real income
and health expenditures. The coefficients λ1 and λ2 correspond to the error correction
equations (i.e., for the two variables each time in the model) and they show the speed of
adjustment to equilibrium. In order to get the presence of the long-run relationship, causality
implies that at least one of the λ coefficients must be different from zero. According to the test
of Canning and Pedroni, the null hypothesis is that there is no panel causality. They report
two tests in order to investigate the validity of the null hypothesis. First, they report the group
mean (GM) test which yields:
_ N
λ1 = ∑ λ1i / N i=1
with N being the number of countries in the panel. The test assesses the null hypothesis that
variable X does not cause variable Y. The test statistic has a standard normal distribution. The
12
N pλ = -2 ∑lnpλ2i
i=1
where lnpλ2i is the log of the p-value coming from the t-test statistic used to test the null
hypothesis. This test combines p-values associated with each of the individual countries that
make up the panel. The LP statistic follows a chi-square distribution with 2N degrees of
freedom. For each country i if a causal connection exists, then the sign of the long run impact
is equal to sign(-λ1/λ2). The estimates for λ1i and λ2i are normally distributed, so the ratio will
be Cauchy distributed. Canning and Pedroni (2008) develop a bootstrap test based on the
median of these ratios. The sign on –λ1/λ2 is considered as a test of the impact of the long-run
as well as a test of the sign of that long-run effect. Table 6 reports the long-run Granger
causality tests and they document the following findings:
- In terms of panel long-run causality running from real income to carbon emissions, both GM
and LP statistics recommend the rejection of the null hypothesis of no causality at the 1%
significance level, while the reverse causality does not hold. In addition, the same holds for
causality running from real income to renewable energy consumption, as well as for causality
running from real income to health expenditures.
- In terms of panel long-run causality running from carbon emissions to renewable energy
consumption, the results reveal the presence of bidirectional causality between these two
variables.
- By contrast, in terms of panel long-run causality between carbon emissions and health
expenditures, the findings document the absence of any causality between these two variables.
- In terms of the sign effect, based on the ratio of lambda coefficients reported in the last
column, the evidence reveals a positive sign across all combinations under investigation.
Overall, the new causality tests, not only confirm the causality links obtained earlier,
13
the growth paths followed by the Sub-Sahara African countries contribute to higher carbon
emissions levels, ii) these growth paths lead to the adoption of higher levels of energy
consumption coming from renewable sources, iii) higher growth rates can sustain higher
expenses going to the healthcare sector, iv) the adoption of more renewable energy sources
leads to lower carbon emissions levels, while v) it seems that there is no link between carbon
emissions and health expenditures (probably to the inadequate resources spent on the health
care sector).
[Insert Table 6 about here]
4. Discussion
In this section we discuss the results reached earlier in the empirical study. The dynamic
causal linkages between carbon emissions, real GDP, renewable energy consumption and
health expenditures have been investigated for sub-Saharan countries. The directions of
causalities results are reported in a simple figure presentation (Figure 1). They point out that
the presence of a unidirectional short-run causality running from real GDP to carbon
emissions is consistent with those reached by Ben Jebli et al. (2015) in the case of Tunisia;
Jalil and Mahmud (2009) in the case of China; and Ben Jebli and Ben Youssef (2015) in the
case of Tunisia. These findings imply that any variation in the expansion of economic growth
is expected to affect the environmental footprint in the region, which is consistent given that
the majority of sub-Saharan African countries have not yet reached the required level of real
GDP that allows reduced emissions levels.
Causality results also reveal a bidirectional short-run causality between renewable
energy consumption and carbon emissions, indicating that renewable energy consumption
causes carbon emissions, while carbon emissions cause renewable energy consumption as
14
consumption affect the variation of pollution in the region. Moreover, if the degree of
pollution caused by carbon emissions increases, this can generate certain changes in the share
of renewable energy used for production purposes. These findings are consistent with those
reached by Apergis et al. (2010) in the case of a panel of 19 developed and developing
countries, but not in line with those presented by Menyah and Rufael (2010) who find the
absence of causality between carbon emissions and renewable energy consumption in the case
of the US.
The short-run interaction between economic growth and renewable energy
consumption is unidirectional without any feedback. In other words, causality findings
suggest that only renewable energy consumption affects economic growth, finding that is
consistent with the growth hypothesis. Otherwise, the evolution of economic activities across
the countries in the sub-Saharan region has an impact on the conservation share of renewable
energy in the short-run. In addition, there is no direct or indirect short-run causal link between
health expenditures and renewable energy consumption, a finding that has not been previously
investigated in the literature. These finding point out the role that renewable energy can play
in the health footprint of sub-Saharan population, given that the region is characterized by a
wealth of renewables sources unexploited. Moreover, access to health care can be improved
and turn to be more reliable through renewable energy systems. If the countries in the area
exploit their share of natural resources, then this can be substantially beneficial for their
savings levels, allowing them to significantly reduce air pollution levels and then, to improve
the quality of the health conditions of their citizens. In the sub-Saharan African countries,
energy challenges impact extremely on the global performance of the region’s social and
economic indicators. In fact, the region’s relatively poor health indicators can be greatly
improved with the provision of modern energy services. Moreover, the installation of the
15
transform it into electrical energy (i.e., solar, wind, geothermal). This phenomenon is
extremely vital for the poor countries in the region, because access to electricity from health
facilities can lead to better health care conditions (ICSU, 2007). More specifically, in remote
and resources-poor locations, renewable energy can supply electricity for lifesaving processes
that might not otherwise be possible (WHO, 2015).
Furthermore, causality results illustrate the presence of a short-run unidirectional
causality running from real output to health expenditures, indicating that, in the short-run, real
growth can cause health expenditures, while the reverse does not hold. Any augmentation in
the economic activities added values in the area shortly contributes to increases in
expenditures reserved to healthcare. The long-run interdependence between carbon emissions
and health expenditures is found to be bidirectional, indicating that there is a strong
correlation between the expansion of pollution and the growth of health expenditures.
5. Conclusions and policy implications
This paper investigated the dynamic causal links between carbon emissions, real output,
renewable energy consumption and health expenditures for a panel of 42 sub-Saharan African
countries, spanning the period 1995-2011. The empirical analysis made use of a number of
methodologies in relevance to panel data, including 2nd generation panel unit root tests, panel
cointegration approaches, panel long-run estimates, and panel causality tests to check out for
the interaction between the variables. The primary goal of this study was to: i) examine the
impact of both renewable energy consumption and health expenditures on the environmental
conditions in the area, and ii) to investigate the short- and long-run association among the
variables under study.
The empirical findings documented that the variables under consideration were
16
renewable energy consumption and health expenditures contributed to lower carbon emissions
levels. Interestingly, causality suggested that there were no short- and long-run relationships
between renewable energy consumption and health expenditures. However, there was a
bidirectional long-run causality between carbon emissions and health expenditures.
The policy recommendations raised by the empirical findings are associated with: i)
more renewable energy could be a policy strategy that motivates economic sectors, while it
would significantly reduce carbon emissions levels in the region; ii) policy makers in these
countries should devote a substantial part of the state budget to health expenditures, since
such expenses could be a good path to combat global warming; and iii) the use of renewable
energy as well as the expansion of health expenditures seems to be the major drivers for
reduced pollution levels.
Although the easy recommendation is the expansion of renewable sources of energy,
this is not highly viable for these countries, because of cash constraints and lack of supply
infrastructure. Similarly, clean-burning biofuels may be also appropriate solutions in the
long-run, but are not likely to satisfy household energy needs for poor rural consumers. Therefore,
it would be a very good opportunity for further research to explore potential financing
mechanisms that will promote renewable energy expansion, without jeopardizing the growth
path of those countries in the sun-Saharan African region.
References
Apergis, N., Payne, J.E., 2010a. Renewable energy consumption and economic growth evidence
from a panel of OECD countries. Energy Policy, 38, 656-660.
Apergis, N., Payne, J.E., 2010b. Renewable energy consumption and growth in Eurasia. Energy
17
Apergis, N., Payne, J.E., 2011. The renewable energy consumption-growth nexus in Central
America. Applied Energy, 88, 343-347.
Apergis, N., Payne, J.E., Menyah, K., Wolde-Rufael, Y., 2010. On the causal dynamics between
emissions, nuclear energy, renewable energy, and economic growth. Ecological Economics,
69, 2255-2260.
Ben Jebli, M., Ben Youssef, S., 2015. The environmental Kuznets curve, economic growth,
renewable and non-renewable energy, and trade in Tunisia. Renewable and Sustainable
Energy Reviews, 47, 173-185.
Ben Jebli, M., Ben Youssef, S., Apergis, N., 2015. The dynamic interaction between combustible
renewables and waste consumption and international tourism: the case of Tunisia.
Environmental Science and Pollution Research, 22, 12050-12061.
Ben Jebli, M., Ben Youssef, S. and Ozturk, I., 2015. The Role of Renewable Energy
Consumption and Trade: Environmental Kuznets Curve Analysis for Sub-Saharan Africa
Countries. African Development Review, 27, 288–300. doi: 10.1111/1467-8268.12147.
Ben Jebli, M., Ben Youssef, S., Ozturk, I., 2016. Testing environmental Kuznets curve
hypothesis: The role of renewable and non-renewable energy consumption and trade in
OECD countries. Ecological Indicators, 60, 824-831.
Breitung, J., 2000. The Local Power of Some Unit Root Tests for Panel Data, in: B.Baltagi (Ed.)
NonStationary Panels, Panel Cointegration, and Dynamic Panels, Advances in Econometrics,
15, 161-178, JAI Press, Amsterdam.
Canning, D. and Pedroni, P. 2008. Infrastructure, long-run economic growth and causality tests
for cointegrated panels. The Manchester School, 76, 504-527
Dickey, D. and W. Fuller 1979. Distribution of the estimators for autoregressive time series with
18
Energy efficiency in hospitals., 2009. Best practice guide. New Delhi, USAID/India, 2009.
(http://eco3.org/energy-efficiency-in-hospitals-bestpractice- guide-2/).
Engle, R.F., Granger C.W.J., 1987. Co-integration and error correction: Representation,
estimation, and testing. Econometrica, 55, 251-276.
Im, K.S., Pesaran, M.H., Shin, Y., 2003. Testing for unit roots in heterogeneous panels. Journal
of Econometrics, 115, 53-74.
International Council for Science., 2007. Sustainable Energy in sub-Saharan Africa. ICSU
Regional Office for Africa, Science Plan. Accessed at: www.icsu-africa.org.
Jalil, A., Mahmud, S.F., 2009. Environment Kuznets curve for CO2 emissions: A cointegration
analysis for China. Energy Policy, 37, 5167-5172.
Jerrett, M., Eyles, J., Dufournaud, C., Birch, S., 2003. Environmental influences on health care
expenditures: an exploratory analysis from Ontario, Canada. Journal of Epidemiology and
Community Health, 57, 334–338.
Levin, A., Lin, C.F., Chu, C.S., 2002. Unit root tests in panel data: asymptotic and finite-sample
properties. Journal of Econometrics, 108, 1-24.
Mark, N.C., Sul, D., 2003. Cointegration vector estimation by panel DOLS and long-run money
demand. Oxford Bulletin of Economics and Statistics, 65, 655-680.
Menyah, K., Wolde-Rufael, Y., 2010. CO2 emissions, nuclear energy, renewable energy and
economic growth in the US. Energy Policy, 38, 2911-2915
Pedroni, P., 2001. Purchasing power parity tests in cointegrated panels. The Review of
Economics and Statistics, 83, 727-731.
Pedroni, P., 2004. Panel cointegration: Asymptotic and finite sample properties of pooled time
series tests with an application to the PPP hypothesis. Econometric Theory, 20, 597-625.
Pesaran, M., 2007. A simple panel unit root test in the presence of cross-section dependence.
19
Pesaran, M. 2004. General diagnostic tests for cross section dependence in panels. Cambridge
Working Papers in Economics 435, and CESifo Working Paper Series 1229.
Pesaran, M.H., Shin, Y., Smith, R.J., 2001. Bounds testing approaches to the analysis of level
relationships. Journal of Applied Econometrics, 16, 289–326.
Sadorsky, P., 2009. Renewable energy consumption and income in emerging economies. Energy
policy, 37, 4021-4028.
World Bank, 2015. World Development Indicators. Accessed at:
http://www.worldbank.org/data/onlinedatabases/onlinedatabases.html.
World Health Organization, 2015. Health in the green economy. Accessed at:
20
[image:21.595.71.505.160.252.2]Tables
Table 1. Pesaran (2004) Covariate Augmented Dickey-Fuller (CADF) tests
Variables t-bar cv10 cv5 cv1 Z[t-bar] P-value LNCO2 -2.028 -2.030 -2.110 -2.250 -1.893 0.029**
LNGDP -2.158 -2.030 -2.110 -2.250 -2.720 0.003*** LNRE -1.993 -2.030 -2.110 -2.250 -1.673 0.047**
LNH -2.073 -2.030 -2.110 -2.250 -2.176 0.015**
Notes: “**”, “***” indicate statistical signficance at the 5% and 1%, respectively. The estimates included both a constant and a trend. t-bar
test indicates the truncated values of student statistic, N,T = (42,17), with “N” denoting the number of countries and “T” indicating the time span. Number of observations = 630. Under the null of cross-sectional residual independent, the Pesaran (2004) test is augmented by one lag.
[image:21.595.70.491.442.600.2]“cv” denotes the critical value provided by Pesaran (2004) at the 10%, 5% and 1% significance levels.
Table 2. Panel unit root tests
Variables LLC Breitung IPS-Wstat ADF-Fisher PP-Fisher CIPS LNCO2 -4.78529*** 0.18632 -0.997 112.097** 124.921*** -0.941 ΔLNCO2 -18.3929*** -8.82959*** -15.0842*** 339.582*** 406.300*** -1.893** LNGDP -0.97333 3.65085 3.67476 95.6005 330.571 -1.375
ΔLNGDP -15.8750*** -5.34773*** -12.3034*** 283.222*** 395.982*** -2.720*** LNRE -1.92367** 2.11714 1.89343 80.5532 112.239** -0.890
ΔLNRE -16.3697*** -6.58400*** -12.9784*** 300.337*** 423.476*** -1.673** LNH -0.97333 3.65085 0.12066 96.4758 77.0851 -2.176**
ΔLNH -15.8750*** -5.34773*** -12.3034*** 283.222*** 395.982*** -3.816***
21
Table 3. Pedroni panel cointegration tests
Alternative hypothesis: common AR coefs. (within-dimension)
Weighted
Statistic Prob. Statistic Prob. Panel v-Statistic 0.690224 0.2450 -1.181825 0.8814 Panel rho-Statistic 0.816451 0.7929 1.007946 0.8433 Panel PP-Statistic -5.592538 0.0000*** -5.743409 0.0000*** Panel ADF-Statistic -6.243037 0.0000*** -6.244811 0.0000***
Alternative hypothesis: individual AR coefs. (between-dimension)
Statistic Prob. Group rho-Statistic 3.563427 0.9998 Group PP-Statistic -6.673381 0.0000***
Group ADF-Statistic -6.068990 0.0000***
22
Table 4. Long-run panel estimates
Variables LNGDP LNRE LNH
FMOLS 1.091937 -0.289687 -0.210902
(0.0000)*** (0.0000)*** (0.0000)***
DOLS 1.047998 -0.321844 -0.174733
(0.0000)*** (0.0000)*** (0.0003)***
[image:23.595.70.522.295.496.2]Notes: “***” indicates statistical significance at the 1% level. p-values are in parentheses.
Table 5. Panel causality results Dependent
variable Short-run Long-run
ΔLNCO2 ΔLNGDP ΔLNRE ΔLNH ECT
ΔLNCO2 - 14.0653 2.33007 0.75342 -0.022163
(0.000)*** (0.0981)* (0.4712) [-2.60600]***
ΔLNGDP 0.33763 - 0.28296 1.07810 0.004517
(0.7136) (0.7536) (0.3409) [1.35238]
ΔLNRE 3.72682 6.33115 - 0.68090 0.007282
(0.0246)** (0.0019)*** (0.5065) [3.60173]
ΔLNH 1.02720 2.30900 0.67698 - -0.011391
(0.3586) (0.1000)* (0.5085) [-2.54914]***
Notes: “***”, “*” indicate statistical significance at the 1% and 10%, respectively. p-values are parentheses. Statistics are computed for the
case where both an intercept and a deterministic trend are included. Lag length selection was based on the SIC criterion with a max lag of 2.
Table 6. Long-run panel Granger causality tests
Test λ1 GM LP λ2 GM LP sign (-λ1/ λ2)
LNY →LNCO2 -0.16 -4.13* 77.44* 0.02 -0.92 1.80 0.24(0.09)
LNY →LNRE 0.24 -3.85* 86.26* -0.05 -0.64 2.61 0.38(0.07)
LNCO2→LNRE -0.19 -4.62* 73.59* -0.26 -5.12* 58.92* -0.32(0.10)
LNY→LNH -0.27 -3.29* 91.04* 0.03 -0.39 1.49 0.26(0.05)
LNCO2→LNH 0.02 -0.71 2.13 -0.08 -0.26 1.53 0.19(0.22)
Notes: λ
[image:23.595.50.557.611.705.2]23
Figures
Fig.1. Short- (discrete line) and long-run (intense line) Granger causality
Health Expenditure
CO2
emissions Real GDP