Effect of Silicon and Bismuth on Solidification Structure
of Thin Wall Spheroidal Graphite Cast Iron
Hiromitsu Takeda, Hiroyuki Yoneda and Kazunori Asano
Department of Mechanical Engineering, School of Science and Engineering, Kinki University, Higashiosaka 577-8502, Japan Although the thinning of spheroidal graphite cast iron castings has been promoted to reduce the weight of the castings, the thinning tends to cause chilling. Due to the chilling, the required mechanical properties can not be obtained. The addition of certain elements is a way to solve this problem. In this study, the spheroidal graphite cast iron melt containing minor Bi, 3.3 to 3.7 mass%C and 2.0 to 3.2 mass%Si was poured into a stepped plate mold to obtain the thin wall castings, and observation of their graphite and matrix microstructure, thermal analysis during the solidification process of the melt in the mold and the qualitative analysis of elements inside the spheroidal graphite by FE-EPMA were carried out.
It was found that an increase in the Si/C mass ratio in the spheroidal graphite cast iron was effective for decreasing the amount of cementite (chill) in the matrix, and the chill was further inhibited by adding 0.01 mass% Bi even for the thin wall castings of 2 mm. Amounts up to 0.01 mass%Bi promoted refinement of the graphite, increased the graphite nodule, and promoted ferritizing of the matrix. It was also found that a high Si/C mass ratio in the spheroidal graphite cast iron promoted the effects of Bi. The temperature of the eutectic start and that of the eutectic solidification end increased due to the 0.01 mass%Bi. The temperature of the eutectoid transformation start increased and the stability eutectoid transformation of the thin wall castings was promoted by containing a minor amount of Bi. It was confirmed that substances including Bi and Mg existed in the graphite containing Bi. These results lead to the conclusion that the Bi compound and the Mg compound acted as heterogeneous nuclei of the graphite, and the nuclei promoted the crystallization of the graphite, and then the graphite nodule increased.
[doi:10.2320/matertrans.M2009255]
(Received July 23, 2009; Accepted October 22, 2009; Published December 9, 2009)
Keywords: spheroidal graphite cast iron, thin wall, bismuth, chill, graphite nodule, matrix microstructure
1. Introduction
Cast iron has been produced in quantity as castings for automobile parts and industrial machines, because it has an excellent castability, good wear resistance and damping capacity. In recent years, the reduction in weight and size of the machine products has been promoted to reduce the energy consumption, use of raw materials and emitting of green-house gas. This trend leads to the promotion of thinning of the spheroidal graphite cast iron castings. However, the cast iron melt in a thin wall is exposed to rapid cooling, and cementite (chill) tends to increase in the matrix. The chilling causes a decrease in the mechanical properties of the castings. Generally, a ferrosilicon (Fe-Si) alloy containing a small amount of elements, such as aluminum, calcium, and barium, is added to the cast iron melt as a graphitizer to prevent the chill. For the spheroidal graphite cast iron, it is reported that the critical graphite nodule count for preventing the chill exists for each cooling rate.1)This indicates that an increase in the graphite nodules in the matrix is effective for preventing the chilling. It is reported that the addition of a small amount of bismuth (Bi) is effective for increasing the graphite nodule count.2–5)Based on this finding, the inoculant containing Bi6,7) or pure Bi8) is sometimes added to the spheroidal graphite cast iron melt. However, Bi is classified as a graphite spheroidization inhibition element because the spheroidization is inhibited by including excessive Bi in the cast iron. Some researchers have reported the critical content of Bi to inhibit the graphite spheroidization. Morrogh9) reported that the graphite spheroidization starts to interfere when the Bi content exceeds 0.003 mass%, and the spher-oidization is completely inhibited when the Bi content is 0.006 mass%. Donoho10)reported that the graphite spheroid-ization is inhibited by 0.005 mass%Bi or more in the melt,
and Cole11) reported that the spheroidization is inhibited by 0.006 mass%Bi or more. On the other hand, for the cast iron containing titanium,12,13) it has been reported that the graphite spheroidization is interfered by containing about 0.001 mass%Bi. These reports indicate that a small amount of Bi inhibits the spheroidization and the critical Bi content changes due to the content of the main element and the existence of other elements. Silicon (Si), the main element of cast iron, is a graphitizing element. Horieet al.1)reported that the graphite nodule count in the spheroidal graphite cast iron increases by increasing the Si content or carbon equivalent (CE). However, there are few reports on the effect of the C and Si contents for a constant CE of the graphite and matrix structure of the thin wall spheroidal graphite cast iron containing Bi. Moreover, there are no reports which examine the effect of Bi on the solidification process of the thin wall spheroidal graphite cast iron by a thermal analysis.
In this study, the spheroidal graphite cast iron melt with various Bi, C and Si contents were poured into a stepped plate mold to obtain the thin wall specimens, and the relationship between the thickness of the specimens, the graphite spheroidization rate, graphite nodule count, and area fraction of ferrite and pearlite was examined, and then the effect of the Si and Bi contents on the graphite and matrix structure was examined (experiment A). Subsequently, the thermal analy-sis of the spheroidal graphite cast iron melt was carried out, and the effect of Bi on the eutectic solidification and the eutectoid transformation reaction was examined (experiment B). Moreover, structure of the spheroidal graphite in the specimens containing Bi was analyzed in order to examine the Bi distribution. Based on these results, the effects of Si and Bi on the microstructure of the thin wall spheroidal graphite cast iron and the graphite refinement mechanism by Bi were examined.
2. Experimental Procedure
Raw materials with the chemical composition shown in Table 1 were used to fabricate the cast iron specimens. They were placed in a graphite crucible and melted in a small high frequency induction furnace (10 kWh, 3 kHz) under an Ar gas atmosphere, followed by graphite spheroidizing, inoculation and Bi addition at 1773 K. The graphite spheroidizing, inoculation and Bi addition were simultaneously carried out by adding the spheroidizing agent (45.92 mass%Si, 4.93 mass%Mg, 2.37 mass%Ca, 0.66 mass%Al, 1.84 mass%RE), inoculant (75.77 mass%Si, 1.28 mass%Ca, 2.16 mass%Al), and pure Bi (99.9 mass%Bi), respectively. As a result of a preliminary experiment, it was found that the yield of Bi in the spheroidal graphite cast iron was 8% in this experiment condition. The addition of the inoculant was 0.3 mass%.
Table 2 shows the chemical composition, CE and Si/C mass ratio of the specimens. Specimens No. 1 to No. 4 were used in experiment A. In experiment A, the target chemical composition of the specimens was as follows: 3.3, 3.4, 3.5 and 3.7 mass%C, 2.0, 2.4, 2.8, and 3.2 mass%Si. The CE(=C+Si/3+P/3) was set to 4.4 (constant). The target contents of Mn, P, S and Mg were 0.04, 0.02, 0.01 and 0.04 mass%, respectively. As a result of a preliminary experiment, it was found that the graphite spheroidization was insufficient when the Bi content exceeded 0.01 mass%. Therefore, the Bi content was set to 0.005 and 0.01 mass%. The ratio of the Si content to C content (Si/C mass ratio) was used as a parameter, showing an increase in the Si content for
the same CE values. It is known that the Si/C mass ratio has a correlation with the tensile strength and hardness.14,15)
Specimens No. 5 and No. 6 shown in Table 2 were used for experiment B. In experiment B, the carbon content was set to 3.4 mass% (constant), the Si content was set to 2.2 and 3.2 mass%; the CE was 4.1 (hypoeutectic composition) and 4.4 (hypereutectic composition).
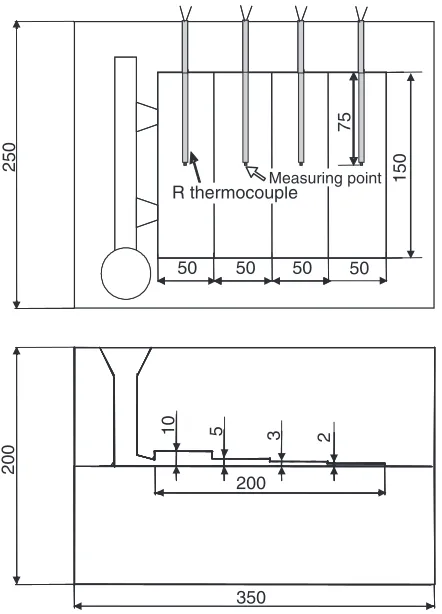
Melt was poured into the CO2 mold shown in Fig. 1 at 1673 K to obtain the stepped specimens plates with 2, 3, 5 and 10 mm thicknesses (50 mm width150 mm length). In experiment B, R thermocouples were inserted in the center of the cavity and the thermal analysis of the melt was carried out. To obtain a high heat sensitivity, the tip of the thermocouple was exposed.
[image:2.595.47.550.84.137.2]The microstructure in the center part of the specimen (in the vicinity of the tip of the thermocouple) was observed. The graphite spheroidization ratio, the graphite particle diameter, the graphite nodule count and area fractions of the graphite, ferrite and pearlite were measured by an image analyzer. To obtain the mean values of these parameters, 10 optical micrographs were used for the measurement. These values of the specimens generating chill were excluded. Graphite particles with a diameter less than 1mmwere also
Table 1 Chemical composition of raw materials (mass%).
C Si Mn P S Cr Cu Zn
Pig iron 4.22 0.099 0.027 0.029 0.015 0.032 — —
Electrolytic iron 0.02 <0:005 0.0001 <0:001 0.009 0.002 0.001 0.002
[image:2.595.318.539.165.472.2]Fe-Si alloy 0.028 75.93 — 0.022 0.010 — — —
Table 2 Chemical composition, CE and Si/C mass ratio of cast iron specimens (mass%).
No. C Si Mn P S Bi Mg CE Si/C
1-1 3.75 2.10 0.041 0.022 0.012 0 0.037 4.45 0.56 -2 3.77 2.00 0.043 0.022 0.011 0.005 0.044 4.44 0.53 -3 3.76 2.06 0.046 0.022 0.010 0.010 0.040 4.45 0.55 2-1 3.63 2.45 0.041 0.022 0.010 0 0.043 4.45 0.67 -2 3.61 2.42 0.043 0.023 0.010 0.005 0.039 4.42 0.67 -3 3.62 2.38 0.045 0.021 0.011 0.010 0.042 4.41 0.66 3-1 3.54 2.81 0.042 0.023 0.008 0 0.038 4.48 0.79 -2 3.53 2.80 0.044 0.021 0.009 0.005 0.044 4.46 0.79 -3 3.52 2.78 0.047 0.022 0.010 0.010 0.041 4.45 0.79 4-1 3.31 3.21 0.050 0.020 0.010 0 0.048 4.38 0.97 -2 3.32 3.23 0.042 0.020 0.010 0.005 0.046 4.40 0.97 -3 3.33 3.22 0.045 0.020 0.010 0.010 0.045 4.40 0.97 5-1 3.44 2.10 0.040 0.021 0.009 0 0.037 4.14 0.61 2 3.45 2.20 0.043 0.022 0.011 0.010 0.041 4.18 0.64 6-1 3.40 3.14 0.042 0.023 0.008 0 0.045 4.45 0.92 2 3.41 3.21 0.047 0.022 0.010 0.010 0.042 4.48 0.94
CE=C+Si/3+P/3
R thermocouple
150
75
5 3 2
200
350
50 50 50 50
250
R thermocoupleMeasuring point
75
10
200
[image:2.595.46.293.186.408.2]excluded because it is difficult to distinguish the graphite. The distribution of elements in the spheroidal graphite in the specimen containing Bi was examined by FE-EPMA. In the thermal analysis of experiment B, the changes in the
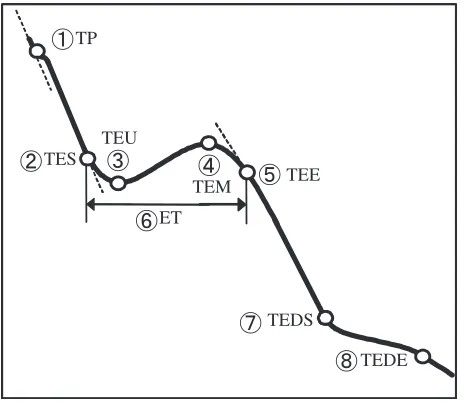
[image:3.595.54.287.72.273.2]eutectic solidification of the melt and eutectoid transfor-mation process by the addition of Bi were examined. The measurement points in the thermal analysis are shown in Fig. 2.
3. Results and Discussion
3.1 Effect of Bi and Si on microstructure (experiment A) 3.1.1 Microstructure
Figure 3 shows the microstructure of the specimens without Bi. The microstructure in the center part and the surface part of each thickness of specimens were almost the same. The Si/C mass ratio is also shown in the figure. When the Si/C mass ratio was 0.56, the specimen with a 10 mm thickness had a bull’s eye type structure without chill (Fig. 3(d)). The chill was partially observed in the specimen with a 5 mm thickness (Fig. 3(c)) and the matrix of the specimen with a 2 mm thickness was completely chill. A similar structure was observed when the Si/C mass ratio was 0.67 (Fig. 3(e)–(h)). When the Si/C mass ratio was 0.79, the chill was not observed in the specimens with the thicknesses of 3, 5 and 10 mm (Fig. 3(j)–(l)), although the chill was partially observed in the specimen with a 2 mm thickness (Fig. 3(i)). When the Si/C mass ratio was 0.97, the no chill was observed even in the specimen with a 2 mm thickness (Fig. 3(m)) and every specimen contained fine nodular graphite particles. The ferrite in the matrix increased as the Si/C mass ratio
TP
TES
TEM TEU
TEE
ET
TEDE TEDS
Fig. 2 Measurement point on cooling curve. Temperature of primary crystallization (TP)`Temperature of eutectic start (TES)´Temperature of eutectic undercooling (TEU) ˆ Temperature of eutectic maximum (TEM)˜End of eutectic solidification (TEE)¯Eutectic solidification time (ET)˘Temperature of eutectoid start (TEDS)˙End of eutectoid transformation (TEDE).
3
2 5 10
Thickness t/mm
3.63 mass%C
2.45 mass%Si Si/C =0.56
Si/C =0.97 Si/C =0.79 Si/C =0.67 3.75 mass%C
2.10 mass%Si
3.54 mass%C
2.81 mass%Si
3.31 mass%C
3.21 mass%Si Specimen
No.4-1 No.3-1 No.1-1
No.2-1
(a) (c) (d)
(e) (f) (g) (h)
(i) (j) (k) (l)
100µm
(b)
(m) (n) (o) (p)
Chill
[image:3.595.74.525.429.768.2]increased. These results indicated that the chilling does not occur and an increase in the ferrite structure in the matrix is pronounced in the thin wall cast iron castings when the Si/C mass ratio is high (high Si content). The specimens containing 0.005 mass%Bi have almost the same micro-structure as the specimens without Bi.
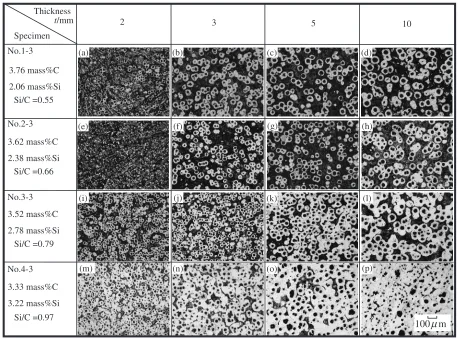
Figure 4 shows the microstructure of the specimens containing 0.01 mass% Bi. When the Si/C mass ratios were 0.55 and 0.66, no chill was observed in the specimens with the thicknesses of 3, 5 and 10 mm (Fig. 4(b)–(d), (f)–(h)). When the Si/C mass ratio was high (0.79 and 0.97), no chill was observed even in the specimen with a 2 mm thickness (Fig. 4(i), (m)).
These results show that an increase in the Si content is effective for decreasing the chill in the thin wall spheroidal graphite cast iron, and the chilling is further inhibited by a 0.01 mass%Bi content.
3.1.2 Relation among Bi content, Si/C mass ratio, thickness and microstructure
For all the specimens, the graphite spheroidization ratio was 80% or more. When the Si/C mass ratio was 0.5, a 0.01 mass%Bi content slightly reduced the spheroidization ratio in the specimens.
Figure 5 shows the relation between the Bi content, Si/C mass ratio, thickness, and the graphite particle diameter of the specimens. It can be seen that the graphite particle diameter decreased as the specimen thickness decreased. This is due to the fact that the cooling rate of the melt increased as the thickness decreased. For the same Si/C mass
ratio, the graphite particle diameter tends to decrease as the Bi content increases. This tendency is pronounced when the Si/C mass ratio is small.
Figure 6 shows the relation between the Bi content, Si/C mass ratio, thickness, and the graphite nodule count of the specimens. The graphite nodule count increased by thinning of the specimen. This is due to the high cooling rate of the melt by the thinning as well as the graphite particle diameter. The tendency that the graphite nodule count increased along with the Bi content was observed for every thickness. This tendency was also reported by Horieet al.2,3)and Satoet al.4)
The graphite nodule count increased as the Si/C mass ratio increased. Generally, the addition of Si decreases the graphite particle diameter and increases the nodule count.7,8)Also for the thin wall spheroidal graphite cast iron castings used in this study, an increase in the Si/C mass ratio increased the graphite nodule count.
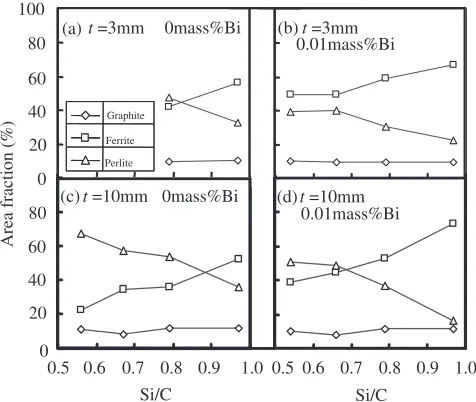
Figure 7 shows the effect of the Bi content and Si/C mass ratio on the matrix structure. The graphite area fraction was constant (approximately 10%) regardless of the Bi content or Si/C mass ratio. The area fraction of ferrite increased and the area fraction of pearlite decreased as the Si/C mass ratio increased. For example, when the Si/C mass ratio was 0.97 and the thickness of the specimen was 10 mm, the area fraction of ferrite increased about 20% and that of pearlite decreased about 20% by a 0.01 mass%Bi content. When the thickness of the specimen was 3 mm, the area fraction of ferrite increased about 10% and the that of pearlite decreased about 10% by a 0.01 mass%Bi content.
3
2 5 10
Thickness t/mm
3.62 mass%C
2.38 mass%Si Si/C =0.55
Si/C =0.97 Si/C =0.79 Si/C =0.66 3.76 mass%C
2.06 mass%Si
3.52 mass%C
2.78 mass%Si
3.33 mass%C
3.22 mass%Si Specimen
No.4-3 No.3-3 No.1-3
No.2-3
(a) (c) (d)
(e) (f) (g) (h)
100µm
(b)
(m) (n) (o) (p)
(i) (j) (k) (l)
[image:4.595.68.526.71.410.2]These results show that the containing up to 0.01 mass%Bi promoted the refinement of the graphite, increased the graphite nodule, and promoted the ferritizing of the matrix of the spheroidal graphite cast iron. It was also found that the increase in the Si content promoted the effects of Bi even though the specimen is thin; i.e., the cooling rate is high.
Therefore, the cooling curves of the thin wall spheroidal graphite cast irons with the hypoeutectic and hypereutectic compositions with different Si contents were subsequently analyzed and the effect of Bi on the microstructure was investigated.
3.2 Thermal analysis of thin wall spheroidal graphite cast iron with Bi (experiment B)
[image:5.595.87.510.76.236.2]3.2.1 Microstructure
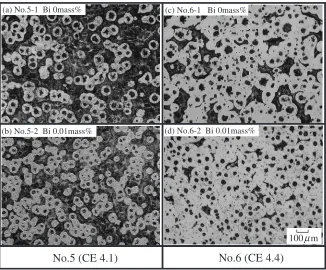
Figure 8 shows the microstructure of the specimens with the thickness of 10 mm in No. 5 and No. 6. Table 3 shows the graphite spheroidization rate, the graphite particle diameter, the graphite nodule count and the area faction of the matrix structure of the specimens. Specimen No. 5 with 2 and 3 mm thickness contained the chill in the matrix. The graphite spheroidizing ratio of the specimens without chill was 80% or more, regardless of the Bi content. The mean diameter of the graphite decreased and graphite nodule count increased as the thickness decreased and the Bi content increased, as well as the specimens from experiment A. The area fraction of ferrite increased and that of pearlite decreased somewhat as the Bi content increased.
3.2.2 Effect of Bi on eutectic solidification
Figure 9 shows the cooling curves of specimens No. 5 and No. 6. Although the primary crystallization start point can be seen in No. 5, it can not be seen in No. 6. This is due to the fact that specimen No. 5 has a hypoeutectic
NG
2
Graphite nodule count,
/mm 400 200 600 800 (b) 0.005mass%Bi 0 4
0 6 8 10
Si/C
0.97 0.79 0.67 0.56
Thickness, t/mm Thickness, t/mm Thickness, t/mm
4
0 6 8 10
Si/C 0.97 0.79 0.67 0.53 4
0 6 8 10 12
Si/C
0.97 0.79 0.66 0.55
(c) 0.01mass% Bi (a) 0mass% Bi
2 2
2
Fig. 6 Relationship between the graphite nodule count and the thickness of the specimens containing various amounts of Bi, C and Si.
((((((((((((((((((( 15 20 25 ((((((((((((((((((( 0.67 5 10 µ
Graphite particle diameter,
d
/
m
(a) 0mass%Bi (b) 0.005mass%Bi (c) 0.01mass%Bi
4
0 6 8 10 0 4 6 8 10 0 4 6 8 10 12
Si/C 0.97 0.79 0.97 0.79 0.67 0.53 0.97 0.79 0.66 0.55
Thickness, t /mm Thickness, t /mm
Si/C Si/C
Thickness, t /mm
2 2 2
Fig. 5 Relationship between the graphite particle diameter and the thickness of the specimens containing various amounts of Bi, C and Si.
Area fraction (%)
0.5 0.6 0.7 0.8 0.9 0.5 0.6 0.7 0.8 0.9 1.0
0 20 40 60 80 0 20 40 60 80 100 Si/C 1.0 Si/C (c) Graphite Ferrite Perlite
t =10mm (d)t =10mm
(a)t =3mm 0mass%Bi (b)t =3mm
0.01mass%Bi
0mass%Bi
0.01mass%Bi
[image:5.595.86.510.269.427.2] [image:5.595.50.288.467.668.2](a) No.5-1 Bi 0mass%
100µm
(b) No.5-2 Bi 0.01mass%
(c) No.6-1 Bi 0mass%
(d) No.6-2 Bi 0.01mass%
No.5 (CE 4.1)
No.6 (CE 4.4)
[image:6.595.135.461.72.342.2]Fig. 8 Microstructure of specimens No. 5 and No. 6 (thickness (t) = 10 mm) (Nital etched).
Table 3 The graphite spheroidization rate, the graphite particle diameter, the graphite nodule count and the area fraction of the matrix structure of the specimens No. 5 and No. 6.
No. 5 (CE 4.1) No. 6 (CE 4.4)
Specimen No. 5-1 No. 5-2 No. 6-1 No. 6-2
0 mass%Bi 0.01 mass%Bi 0 mass%Bi 0.01 mass%Bi
Thickness mm 2 3 5 10 2 3 5 10 2 3 5 10 2 3 5 10
Graphite spheroidization rate
% — — 82.3 81.5 — — 80.2 80.1 81.4 82.8 82.4 81.8 80.3 82.3 81.1 80.4 Average graphite particle diameter
mm — — 15.2 18.4 — — 13.8 16.7 10.0 12.1 13.6 16.5 9.2 10.4 12.1 13.8
Graphite nodule count
mm2 — — 344 187 — — 426 227 1025 883 482 298 1179 1028 639 346 Graphite — — 10.6 11.6 — — 11.6 10.4 12.2 12.3 11.1 11.4 12.4 11.5 10.7 10.2 Area fraction % Pearlite — — 57.8 54.1 — — 53.9 52.9 19.5 10.3 11.2 10.6 18.9 10.9 9.4 8.9
Ferrite — — 31.6 34.3 — — 34.5 36.7 68.3 77.4 77.7 78.0 68.7 77.6 79.9 80.9
1500
1400 1300
1200
1100
1000
(CE 4.4, Si/C 0.9)
(b) No.6
Time, T/s
200 400 600
0 100 300 500
Bi 0mass% Bi 0.01mass%
eutectoid TEDS
TEDE eutectic
TES
TEM TEE
TEU
Time, T/s
600 1600
900
0 200 400
(CE 4.1, Si/C 0.6)
800
500
Temperature,
Tem
/K
300 100
Bi 0mass% Bi 0.01mass%
eutectoid
(a) No.5 eutectic
TP TES
TEM TEE
TEU
TEDS
TEDE
[image:6.595.44.551.404.580.2] [image:6.595.87.509.604.769.2]composition which generates the solidification latent heat by crystallization of the primary crystal austenite whereas specimen No. 6 has a hypereutectic composition in which the graphite crystallizes as the primary crystal. A steep increase in the temperature from the temperature of the eutectic undercooling (TEU) was observed by adding Bi. This indicates that many or much amount of graphite particles are simultaneously crystallized out, followed by the rapid solidification of the melt. In addition, the tem-perature of the eutectic start (TES) and temtem-perature of the eutectoid start (TEDS) were high for the specimen containing Bi.
Table 4 shows the average cooling rate from TP to TES for each thickness of specimens No. 5 and No. 6. It can be seen that the cooling rate was increased by containing Bi for every specimen. This is probably due to the fact that the vapor pressure of Bi is high16) and the yield of Bi in the melt is thought to be bad. It is thought that the evaporation of a quantity of Bi deprives the heat of the melt.
Moreover, the cooling rate of the specimen No. 6 was faster than that of the specimen No. 5. This reason is thought as follows: In the hypoeutectic composition (specimen No. 5), the reduction in melt temperature was thought to be sup-pressed due to the solidification latent heat generated by the primary austenite crystallization. On the other hand, in the hypereutectic composition (specimen No. 6), it is thought that the reduction in melt temperature is not suppressed because little heat is generated when the primary graphite crystallizes out.
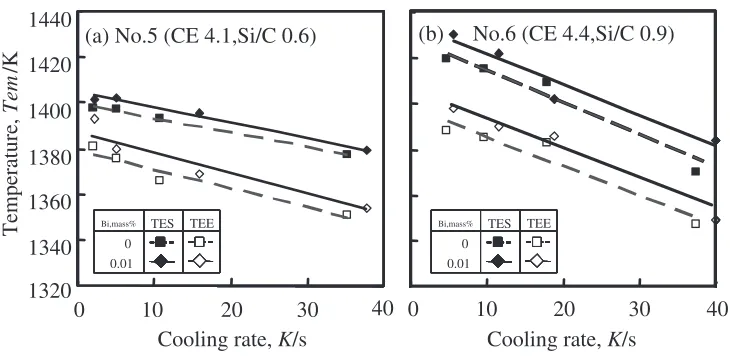
Figure 10 shows the effect of the Bi content and cooling rate on the temperature of the eutectic start (TES) and end
of the eutectic solidification (TEE). For every cooling rate, the TES of specimen No. 6 is higher than that of specimen No. 5. This is due to the fact that the CE of specimen No. 6 is higher than that of specimen No. 5. Regardless of the cooling rate of the specimens, the TES and TEE of the specimens containing 0.01 mass%Bi were higher than those of the specimens without Bi.
Figure 11 shows the effect of the Bi content and eutectic solidification time (ET) for specimens No. 5 and No. 6. Although the change in the ET by containing Bi was not seen for specimen No. 5 (hypoeutectic composition), the ET was decreased in specimen No. 6 (hypereutectic composition) by containing Bi. As previously described, the graphite nodule count of specimen No. 6-2 containing 0.01 mass%Bi was more than that of specimen No. 6-1 without Bi. Ohi
et al.17) have researched the influence of graphite nodule
count on the eutectic solidification of hypereutectic spher-oidal graphite cast iron and reported that the eutectic solidification time (ET) shortened as the graphite nodule count increased. From this result, it is thought that ET is shortened because an increase in the graphite nodule count reduced the time required for graphite growth. Furthermore, it is thought that an increase in the cooling rate of hyper-eutectic spheroidal graphite cast iron melt by Bi addition shorten ET.
3.2.3 Effect of Bi on eutectoid transformation
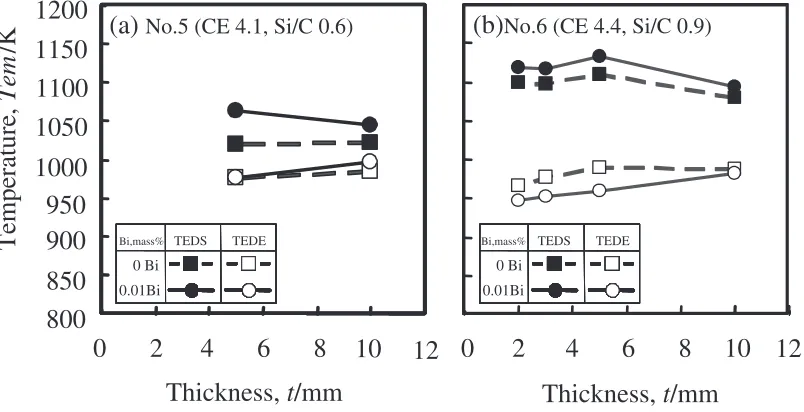
Figure 12 shows the effect of the Bi content, thickness of the specimen on the temperature of the eutectoid start (TEDS) and end of the eutectoid transformation (TEDE) for the specimens without chill. For specimen No. 5, the TEDS increased, while the TEDE did not change by adding Bi (Fig. 12(a)). For specimen No. 6 with the hypereutectic composition containing 0.01 mass%Bi, the TEDS increased and the TEDE decreased (Fig. 12(b)). As previously described, the graphite nodule count increased and the ferritizing was promoted by the Bi. The increase in the graphite nodule count leads to a decrease in the distance among the graphite nodules in the matrix. This promotes the diffusion of C in the matrix into the previously crystallized graphite during the cooling after the eutectic solidification. This probably leads to the phenomenon that the eutectoid transformation reaction starts at a
compara-Table 4 The average cooling rate (K/s) to temperature of the eutectic start vs. specimen thickness.
Specimen Bi content Thickness
mass% 2 mm 3 mm 5 mm 10 mm
No. 5 0 35.2 10.7 5.0 2.0
0.01 37.8 15.9 5.1 2.1
No. 6 0 37.5 17.9 9.6 4.7
0.01 40.0 18.8 11.7 5.7
Temperature,
Tem
/K
Cooling rate,
K
/s
0
10
20
30
40
1320
1360
1400
1420
1340
1380
1440
0
10
20
30
(a) No.5 (CE 4.1,Si/C 0.6)
(b)
40
No.6 (CE 4.4,Si/C 0.9)
0.01 TES 0
TEE
Bi,mass%
0.01 TES 0
TEE
Bi,mass%
[image:7.595.116.481.70.248.2]Cooling rate,
K
/s
[image:7.595.47.290.313.392.2]tively high temperature and the ferritizing of the matrix is promoted.
These results show that containing 0.01 mass%Bi in-creases the temperature of the eutectoid start and promotes a steady eutectoid transformation of the thin wall spheroidal graphite cast iron.
3.3 EPMA analysis of spheroidal graphite
Since the refinement of the graphite nodule and the increase in the graphite nodule count was recognized by adding Bi, the inside of the spheroidal graphite in the cast iron containing Bi was analyzed by FE-EPMA in order to examine the effect of Bi on the graphite refinement.
[image:8.595.115.482.72.259.2]Figure 13 shows the SEI and the X-ray images of C and Bi in the spheroidal graphite of a specimen containing 0.01 mass%Bi (specimen No. 5-2). It can be seen that Bi exists in the vicinity of the center of the graphite.
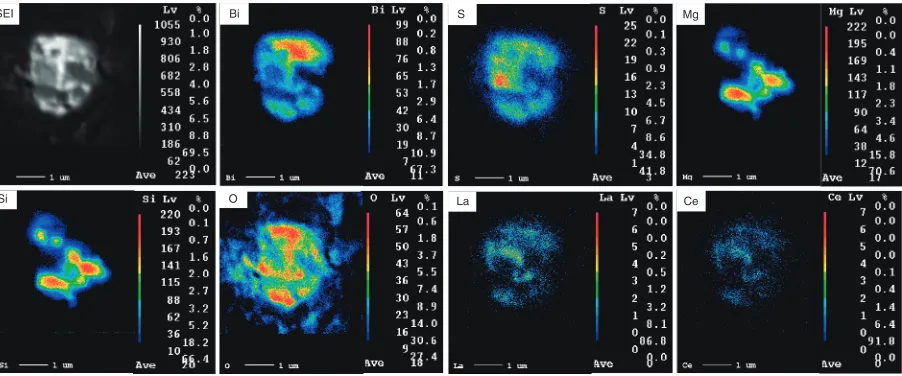
Figure 14 shows the magnified observations of where Bi was detected. It indicates that the center of the graphite
consists of the Bi oxide and the Bi sulfide, because Bi, O and S were detected from almost the same area. Moreover, it is thought that a compound of Mg and Si exists because Mg and Si were also detected from the same area. Ce and La were also distributed in almost the same position as S, although their detection brightness is low. Ce and La are probably from RE in the spheroidization agent. Igarashi et al.18) reported that MgS and MgO are included in the vicinity of the center of the spheroidal graphite in the spheroidal graphite cast iron without Bi. This report supports the fact that MgS and MgO also exist in the center of the graphite specimen without Bi in this study.
Subsequently, the formation of compounds in the graphite at the spheroidization temperature (1773 K) in the present study was examined from the viewpoint of the standard free energy of formation. The standard free energies of formations of the oxide, sulfide and silicide of Bi and Mg are as follows:19)
0
20
40
60
120
100
80
Eutectic solidification time,
ET
/s
Thickness,
t
/mm
0
4
6
8
10
0
2
4
6
8
10
12
(a) No.5 (CE 4.1, Si/C 0.6)
(b)No.6 (CE 4.4, Si/C 0.9)
12
0 mass%Bi 0.01 mass%Bi
0 mass%Bi 0.01 mass%Bi
Thickness,
t
/mm
[image:8.595.99.501.306.512.2]2
Fig. 11 Effect of Bi content and thickness of specimen on eutectic solidification time.
Temperature,
Tem
/K
800
900
1000
1050
850
950
1100
1150
1200
0
4
6
8
0
2
4
6
8
10
12
Thickness,
t
/mm
(a)
No.5 (CE 4.1, Si/C 0.6)
(b)
No.6 (CE 4.4, Si/C 0.9)
12
Bi,mass%
0.01Bi 0 Bi
TEDS TEDE
Bi,mass%
0.01Bi 0 Bi
TEDS TEDE
Thickness,
t
/mm
10
2
2/3Bi2O3¼ 109:1kJ/molO2 ð1Þ 2/3Bi2S3¼ 42:9kJ/molS2 ð2Þ
MgO¼ 733:7kJ/molO2 ð3Þ
MgS¼ 395:2kJ/molS2 ð4Þ
Mg2Si¼ 8552:5kJ/molSi ð5Þ
These values show that these Bi compounds and Mg compounds are easily formed, and coexist in the melt after the spheroidization. This fact and the results from the FE-EPMA lead to the conclusion that Bi2O3 and Bi2S3 were formed from Bi, O and S, and Mg2Si was formed from Mg and Si. Moreover, the reason why these compounds coexist was considered. As expressed by eq. (6), the Bi sulfide is oxidized to form the Bi oxide.
2Bi2S3þ9O2!2Bi2O3þ6SO2 ð6Þ When Mg in the spheroidizing agent diffuses into the melt during the spheroidizing treatment, Mg reduces the Bi oxide to form MgO. However, under rapid solidification, the Mg not used for the reduction combines with Si in the melt and forms the Mg-Si compound in the vicinity of the Bi oxide and Bi sulfide. This leads to the coexistence of Bi2O3, Bi2S3and Mg2Si.
These results lead to the conclusion that the Bi compound was first formed, then the Mg compound was formed around
the Bi compound to form a nucleus, and then the graphite crystallized out from the nucleus. The formation of such many heterogeneous nucleation sites in the melt would lead to the distribution of many fine graphite particles.
4. Conclusions
The effect of Si and Bi on the microstructure of thin wall spheroidal graphite cast iron has been investigated by examining the microstructure and cooling curves of the spheroidal graphite cast irons specimens with 2 to 10 mm thicknesses. The results obtained are as follows:
(1) For the C and Si contents in the present study, an increase in the Si/C mass ratio was effective for decreasing the chill in the thin wall spheroidal graphite cast iron, and the chilling was inhibited by containing 0.01 mass% Bi even though the thickness of the specimen was 2 mm.
(2) Amounts up to 0.01 mass%Bi promoted refinement in the graphite, increased the graphite nodule, and promoted the ferritizing of the matrix of the spheroidal graphite cast iron. It was also found that the high Si content promoted these effects of Bi even though the specimen is thin.
(3) The temperatures of the eutectic start and the eutectic solidification end increased by 0.01 mass%Bi. Especially, at the hypereutectic composition, the eutectic solidification time was shortened by containing Bi. The temperature of the
C Bi
C Bi
C Bi
[image:9.595.72.526.73.196.2]SEI C Bi
Fig. 13 Secondary electron image and X-ray images of C and Bi in the spheroidal graphite in the specimen containing Bi. (specimen No. 5-2)
SEI Bi S
Si O
Mg
La Ce
[image:9.595.74.525.243.431.2]eutectoid transformation start increased and the stable eutectoid transformation was promoted by the Bi.
(4) The substance including the Bi and Mg compounds existed in the vicinity of the center of the spheroidal graphite in the cast iron containing Bi. This result indicates that these compounds act as a nucleus of the graphite. It is thought that this promotes the graphitzation to increase the graphite nodule count.
REFERENCES
1) H. Horie, T. Miyate, M. Saito and T. Kowata: IMONO56(1984) 491– 496.
2) H. Horie and T. Kowata: IMONO60(1988) 173–178.
3) T. Kowata, H. Horie, M. Nakamura, S. Hiratsuka and A. Chida: IMONO65(1993) 209–214.
4) K. Sato, Z. Murakami and A. Chida: J. JFS76(1997) 124–134.
5) J. H. Choi, J. K. Oh, C. O. Choi, J. K. Kim and P. K. Rohatgi: Trans. AFS112(2004) 831–840.
6) C. Labrecquem and M. Gagne´: Trans. AFS108(2000) 31–38. 7) K. Nakamoto, T. Kodera, T. Suzuki, Y. Mitiura and H. Horie: Reports
of the J. JFS Meeting76(1997) p. 119.
8) Y. Awaji and T. Takahashi: J. JFS102(2007) 39–48. 9) H. Morrogh: Trans. AFS60(1952) 20–33.
10) C. K. Donoho: Modern Castings46(1964) 608–610. 11) G. S. Cole: Trans. AFS80(1972) 335–348. 12) J. Verelst and A. DeSy: Giesserei43(1956) 305–315. 13) I. Aoki and T. Tottori: Iron and Steel43(1957) 1191–1194. 14) W. Hiller and R. Walking: Foundry90(1962) 54–57.
15) N. Nishi, T. Kobayasi and S. Taga: IMONO48(1976) 132–138. 16) Chemical dictionary7: Ed. by Chemical dictionary edit committee,
(Kyouritsu, Tokyo, 1997) p. 385.
17) T. Ohi and M. Fujioka: IMONO54(1982) 21–26. 18) Y. Igarashi and T. Okada: J. JFS70(1998) 329–335.