Proceedings of the 49th Annual Meeting of the Association for Computational Linguistics:shortpapers, pages 552–557,
Identification of Domain-Specific Senses in a Machine-Readable Dictionary
Fumiyo Fukumoto
Interdisciplinary Graduate School of Medicine and Engineering,
Univ. of Yamanashi
Yoshimi Suzuki
Interdisciplinary Graduate School of Medicine and Engineering,
Univ. of Yamanashi
Abstract
This paper focuses on domain-specific senses and presents a method for assigning cate-gory/domain label to each sense of words in a dictionary. The method first identifies each sense of a word in the dictionary to its cor-responding category. We used a text classifi-cation technique to select appropriate senses for each domain. Then, senses were scored by computing the rank scores. We used Markov Random Walk (MRW) model. The method was tested on English and Japanese resources, WordNet 3.0 and EDR Japanese dictionary. For evaluation of the method, we compared English results with the Subject Field Codes (SFC) resources. We also compared each En-glish and Japanese results to the first sense heuristics in the WSD task. These results suggest that identification of domain-specific senses (IDSS) may actually be of benefit.
1 Introduction
Domain-specific sense of a word is crucial informa-tion for many NLP tasks and their applicainforma-tions, such as Word Sense Disambiguation (WSD) and Informa-tion Retrieval (IR). For example, in the WSD task, McCarthy et al. presented a method to find predom-inant noun senses automatically using a thesaurus acquired from raw textual corpora and the Word-Net similarity package (McCarthy et al., 2004; Mc-Carthy et al., 2007). They used parsed data to find words with a similar distribution to the target word. Unlike Buitelaar et al. approach (Buitelaar and Sacaleanu, 2001), they evaluated their method us-ing publically available resources, namely SemCor
(Miller et al., 1998) and the SENSEVAL-2 English all-words task. The major motivation for their work was similar to ours, i.e., to try to capture changes in ranking of senses for documents from different do-mains.
Domain adaptation is also an approach for fo-cussing on domain-specific senses and used in the WSD task (Chand and Ng, 2007; Zhong et al., 2008; Agirre and Lacalle, 2009). Chan et. al. proposed a supervised domain adaptation on a manually se-lected subset of 21 nouns from the DSO corpus hav-ing examples from the Brown corpus and Wall Street Journal corpus. They used active learning, count-merging, and predominant sense estimation in order to save target annotation effort. They showed that for the set of nouns which have different predomi-nant senses between the training and target domains, the annotation effort was reduced up to 29%. Agirre et. al. presented a method of supervised domain adaptation (Agirre and Lacalle, 2009). They made use of unlabeled data with SVM (Vapnik, 1995), a combination of kernels and SVM, and showed that domain adaptation is an important technique for WSD systems. The major motivation for domain adaptation is that the sense distribution depends on the domain in which a word is used. Most of them adapted textual corpus which is used for training on WSD.
In the context of dictionary-based approach, the first sense heuristic applied to WordNet is often used as a baseline for supervised WSD systems (Cotton et al., 1998), as the senses in WordNet are ordered ac-cording to the frequency data in the manually tagged resource SemCor (Miller et al., 1998). The usual
drawback in the first sense heuristic applied to the WordNet is the small size of the SemCor corpus. Therefore, senses that do not occur in SemCor are often ordered arbitrarily. More seriously, the deci-sion is not based on the domain but on the frequency of SemCor data. Magnini et al. presented a lexi-cal resource where WordNet 2.0 synsets were anno-tated with Subject Field Codes (SFC) by a procedure that exploits the WordNet structure (Magnini and Cavaglia, 2000; Bentivogli et al., 2004). The results showed that 96% of the WordNet synsets of the noun hierarchy could have been annotated using 115 dif-ferent SFC, while identification of the domain labels for word senses was required a considerable amount of hand-labeling.
In this paper, we focus on domain-specific senses and propose a method for assigning cate-gory/domain label to each sense of words in a dictio-nary. Our approach is automated, and requires only documents assigned to domains/categories, such as Reuters corpus, and a dictionary with gloss text, such as WordNet. Therefore, it can be applied easily to a new domain, sense inventory or different lan-guages, given sufficient documents.
2 Identification of Domain-Specific Senses
Our approach, IDSS consists of two steps: selection of senses and computation of rank scores.
2.1 Selection of senses
The first step to find domain-specific senses is to se-lect appropriate senses for each domain. We used a corpus where each document is classified into do-mains. The selection is done by using a text classi-fication technique. We divided documents into two sets, i.e., training and test sets. The training set is used to train SVM classifiers, and the test set is to test SVM classifiers. For each domain, we collected noun words. LetDbe a domain set, andSbe a set of senses that the wordw∈W has. Here,W is a set of noun words. The senses are obtained as follows:
1. For each senses∈S, and for eachd∈D, we applied word replacement, i.e., we replaced w in the training documents assigning to the do-maindwith its gloss text in a dictionary.
2. All the training and test documents are tagged by a part-of-speech tagger, and represented as term vectors with frequency.
3. The SVM was applied to the two types of train-ing documents, i.e., with and without word re-placement, and classifiers for each category are generated.
4. SVM classifiers are applied to the test data. If the classification accuracy of the domain d is equal or higher than that without word replace-ment, the sensesof a wordwis judged to be a candidate sense in the domaind.
The procedure is applied to allw∈W.
2.2 Computation of rank scores
We note that text classification accuracy used in se-lection of senses depends on the number of words consisting gloss in a dictionary. However, it is not so large. As a result, many of the classification ac-curacy with word replacement were equal to those without word replacement1. Then in the second pro-cedure, we scored senses by using MRW model.
Given a set of senses Sd in the domaind, Gd = (Sd, E) is a graph reflecting the relationships be-tween senses in the set. Each sense si in Sd is a gloss text assigned from a dictionary. E is a set of edges, which is a subset ofSd×Sd. Each edgeeij inE is associated with an affinity weightf(i→ j) between sensessiandsj(i=j). The weight is com-puted using the standard cosine measure between two senses. The transition probability from si to sjis then defined by normalizing the corresponding affinity weightp(i→j)= P|Sdf(|i→j)
k=1f(i→k)
, ifΣf = 0,
otherwise, 0.
We used the row-normalized matrix Uij =
(Uij)|Sd|×|Sd| to describe G with each entry corre-sponding to the transition probability, where Uij = p(i → j). To makeU a stochastic matrix, the rows with all zero elements are replaced by a smooth-ing vector with all elements set to|S1
d|. The matrix form of the saliency scoreScore(si)can be formu-lated in a recursive form as in the MRW model:λ
= μUTλ + (1|S−µd|) e, where λ = [Score(si)]|Sd|×1 is a vector of saliency scores for the senses. e is a column vector with all elements equal to 1. μis a
1
damping factor. We setμto 0.85, as in the PageR-ank (Brin and Page, 1998). The final transition ma-trix is given by the formula (1), and each score of the sense in a specific domain is obtained by the princi-pal eigenvector of the new transition matrixM.
M = μUT +(1| −μ) Sd| ee
T (1)
We applied the algorithm for each domain. We note that the matrixM is a high-dimensional space. Therefore, we used a ScaLAPACK, a library of high-performance linear algebra routines for dis-tributed memory MIMD parallel computing (Netlib, 2007)2. We selected the topmostK% senses accord-ing to rank score for each domain and make a sense-domain list. For each word w in a document, find the sensesthat has the highest score within the list. If a domain with the highest score of the sensesand a domain in a document appearingwmatch,sis re-garded as a domain-specific sense of the wordw.
3 Experiments
3.1 WordNet 3.0
We assigned Reuters categories to each sense of words in WordNet 3.0 3. The Reuters documents are organized into 126 categories (Rose et al., 2002). We selected 20 categories consisting a variety of genres. We used one month of documents, from 20th Aug to 19th Sept 1996 to train the SVM model. Similarly, we classified the following one month of documents into these 20 categories. All documents were tagged by Tree Tagger (Schmid, 1995).
Table 1 shows 20 categories, the number of train-ing and test documents, and F-score (Baseline) by SVM. For each category, we collected noun words with more than five frequencies from one-year Reuters corpus. We randomly divided these into two: 10% for training and the remaining 90% for test data. The training data is used to estimateK according to rank score, and test data is used to test the method using the estimated value K. We man-ually evaluated a sense-domain list. As a result, we set K to 50%. Table 2 shows the result using the
2
For implementation, we used a supercomputer, SPARC En-terprise M9000, 64CPU, 1TB memory.
3
http://wordnet/princeton.edu/
test data, i.e., the total number of words and senses, and the number of selected senses (Select S) that the classification accuracy of each domain was equal or higher than the result without word replacement. We used these senses as an input of MRW.
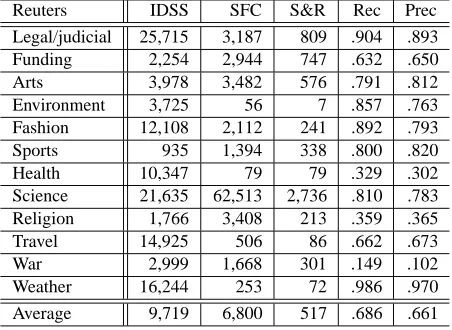
There are no existing sense-tagged data for these 20 categories that could be used for evaluation. Therefore, we selected a limited number of words and evaluated these words qualitatively. To do this, we used SFC resources (Magnini and Cavaglia, 2000), which annotate WordNet 2.0 synsets with do-main labels. We manually corresponded Reuters and SFC categories. Table 3 shows the results of 12 Reuters categories that could be corresponded to SFC labels. In Table 3, “Reuters” shows categories, and “IDSS” shows the number of senses assigned by our approach. “SFC” refers to the number of senses appearing in the SFC resource. “S & R” denotes the number of senses appearing in both SFC and Reuters corpus. “Prec” is a ratio of correct assignments by “IDSS” divided by the total number of “IDSS” as-signments. We manually evaluated senses not ap-pearing in SFC resource. We note that the corpus used in our approach is different from SFC. There-fore, recall denotes a ratio of the number of senses matched in our approach and SFC divided by the total number of senses appearing in both SFC and Reuters.
As shown in Table 3, the best performance was “weather” and recall was 0.986, while the result for “war” was only 0.149. Examining the result of text classification by word replacement, the for-mer was 0.07 F-score improvement by word replace-ment, while that of the later was only 0.02. One rea-son is related to the length of the gloss in WordNet: the average number of words consisting the gloss as-signed to “weather” was 8.62, while that for “war” was 5.75. IDSS depends on the size of gloss text in WordNet. Efficacy can be improved if we can assign gloss sentences to WordNet based on corpus statis-tics. This is a rich space for further exploration.
Cat Train Test F-score Cat Train Test F-score Legal/judicial 897 808 .499 Funding 3,245 3,588 .709
Production 2,179 2,267 .463 Research 204 180 .345
Advertising 113 170 .477 Management 923 812 .753
Employment 1,224 1,305 .703 Disasters 757 522 .726 Arts/entertainments 326 295 .536 Environment 532 420 .476
Fashion 13 50 .333 Health 524 447 .513
Labour issues 1,278 1,343 .741 Religion 257 251 .665
Science 158 128 .528 Sports 2,311 2,682 .967
Travel 47 64 .517 War 3,126 2,674 .678
[image:4.612.134.481.62.193.2]Elections 1,107 1,208 .689 Weather 409 247 .688
Table 1: Classification performance (Baseline)
Cat Words Senses S senses Cat Words Senses S senses
[image:4.612.132.484.227.358.2]Legal/judicial 10,920 62,008 25,891 Funding 11,383 28,299 26,209 Production 13,967 31,398 30,541 Research 7,047 19,423 18,600 Advertising 7,960 23,154 20,414 Management 9,386 24,374 22,961 Employment 11,056 28,413 25,915 Disasters 10,176 28,420 24,266 Arts 12,587 29,303 28,410 Environment 10,737 26,226 25,413 Fashion 4,039 15,001 12,319 Health 10,408 25,065 24,630 Labour issues 11,043 28,410 25,845 Religion 8,547 21,845 21,468 Science 8,643 23,121 21,861 Sports 12,946 31,209 29,049 Travel 5,366 16,216 15,032 War 13,864 32,476 30,476 Elections 11,602 29,310 26,978 Weather 6,059 18,239 16,402
Table 2: The # of candidate senses (WordNet)
Reuters IDSS SFC S&R Rec Prec Legal/judicial 25,715 3,187 809 .904 .893 Funding 2,254 2,944 747 .632 .650
Arts 3,978 3,482 576 .791 .812
Environment 3,725 56 7 .857 .763 Fashion 12,108 2,112 241 .892 .793
Sports 935 1,394 338 .800 .820
Health 10,347 79 79 .329 .302
Science 21,635 62,513 2,736 .810 .783 Religion 1,766 3,408 213 .359 .365
Travel 14,925 506 86 .662 .673
War 2,999 1,668 301 .149 .102
Weather 16,244 253 72 .986 .970 Average 9,719 6,800 517 .686 .661
Table 3: The results against SFC resource
selected 10 sentences from the documents belonging to each corresponding category. Thus, we tested 100 sentences for each category. Table 4 shows the re-sults. “Sense” refers to the number of average senses par a word. Table 4 shows that the average preci-sion by our method was 0.648, while the result ob-tained by the first sense heuristic was 0.581. Table
4 also shows that overall performance obtained by our method was better than that with the first sense heuristic in all categories.
3.2 EDR dictionary
We assigned categories from Japanese Mainichi newspapers to each sense of words in EDR Japanese dictionary4. The Mainichi documents are organized into 15 categories. We selected 4 categories, each of which has sufficient number of documents. All documents were tagged by a morphological analyzer Chasen (Matsumoto et al., 2000), and nouns are ex-tracted. We used 10,000 documents for each cate-gory from 1991 to 2000 year to train SVM model. We classified other 600 documents from the same period into one of these four categories. Table 5 shows categories and F-score (Baseline) by SVM.
We used the same ratio used in English data to es-timate K. As a result, we set K to 30%. Table 6 shows the result of IDSS. “Prec” refers to the preci-sion of IDSS, i.e., we randomly selected 300 senses
4
[image:4.612.73.299.401.566.2]Cat Sense IDSS First sense Correct Wrong Prec Correct Wrong Prec
Legal/judicial 5.3 69 31 .69 63 37 .63
Funding 5.6 60 40 .60 43 57 .43
Arts/entertainments 4.5 62 38 .62 48 52 .48
Environment 6.5 72 28 .72 70 30 .70
Fashion 4.7 74 26 .74 73 27 .73
Sports 4.3 72 28 .72 70 30 .70
Health 4.5 68 32 .68 62 38 .62
Science 5.0 69 31 .69 65 35 .65
Religion 4.1 54 46 .54 52 48 .52
Travel 4.8 75 25 .75 68 32 .68
War 4.9 53 47 .53 30 70 .30
Weather 5.3 60 40 .60 53 47 .53
[image:5.612.139.474.63.241.2]Average 4.95 64.8 35.1 0.648 58.0 41.9 0.581
Table 4: IDSS against the first sense heuristic (WordNet)
Cat Precision Recall F-score
International .650 .853 .778
Economy .703 .804 .750
Science .867 .952 .908
[image:5.612.338.514.283.359.2]Sport .808 .995 .892
Table 5: Text classification performance (Baseline)
Cat Words Senses S senses Prec International 3,607 11,292 10,647 .642 Economy 3,180 9,921 9,537 .571 Science 4,759 17,061 13,711 .673 Sport 3,724 12,568 11,074 .681 Average 3,818 12,711 11,242 .642
Table 6: The # of selected senses (EDR)
for each category and evaluated these senses qualita-tively. The average precision for four categories was 0.642.
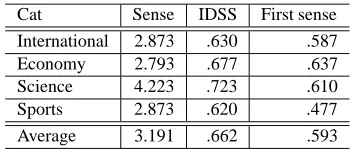
In the WSD task, we randomly picked up 30 words from the senses assigned by our method. For each word, we selected 10 sentences from the doc-uments belonging to each corresponding category. Table 7 shows the results. As we can see from Table 7 that IDSS was also better than the first sense heuristics in Japanese data. For the first sense heuristics, there was no significant difference be-tween English and Japanese, while the number of senses par a word in Japanese resource was 3.191, and it was smaller than that with WordNet (4.950). One reason is the same as SemCor data, i.e., the
Cat Sense IDSS First sense International 2.873 .630 .587
Economy 2.793 .677 .637
Science 4.223 .723 .610
Sports 2.873 .620 .477
[image:5.612.88.283.284.350.2]Average 3.191 .662 .593
Table 7: IDSS against the first sense heuristic (EDR)
small size of the EDR corpus. Therefore, there are many senses that do not occur in the corpus. In fact, there are 62,460 nouns which appeared in both EDR and Mainichi newspapers (from 1991 to 2000 year), 164,761 senses in all. Of these, there are 114,267 senses not appearing in the EDR corpus. This also demonstrates that automatic IDSS is more effective than the frequency-based first sense heuristics.
4 Conclusion
References
E. Agirre and O. L. Lacalle. 2009. Supervised domain adaption for wsd. In Proc. of the 12th Conference of the European Chapter of the ACL, pages 42–50. L. Bentivogli, P. Forner, B. Magnini, and E. Pianta. 2004.
Revising the WORDNET DOMAINS Hierarchy: Se-mantics, Coverage and Balancing. In In Proc. of COL-ING 2004 Workshop on Multilingual Linguistic Re-sources, pages 101–108.
S. Brin and L. Page. 1998. The Anatomy of a Large-scale Hypertextual Web Search Engine. In Computer Networks and ISDN Systems, volume 30, pages 1–7. P. Buitelaar and B. Sacaleanu. 2001. Ranking and
Se-lecting Synsets by Domain Relevance. In Proc. of WordNet and Other Lexical Resources: Applications, Extensions and Customization, pages 119–124. Y. S. Chand and H. T. Ng. 2007. Domain adaptation
with active learning for word sense disambiguation. In Proc. of the 45th Annual Meeting of the Association of Computational Linguistics, pages 49–56.
S. Cotton, P. Edmonds, A. Kilgarriff, and
M. Palmer. 1998. SENSEVAL-2,
http://www.sle.sharp.co.uk/senseval2/.
B. Magnini and G. Cavaglia. 2000. Integrating Subject Field Codes into WordNet. In In Proc. of LREC-2000. Y. Matsumoto, A. Kitauchi, T. Yamashita, Y. Hirano, Y. Matsuda, K. Takaoka, and M. Asahara. 2000. Japanese Morphological Analysis System ChaSen Version 2.2.1. In NAIST Technical Report NAIST. D. McCarthy, R. Koeling, J. Weeds, and J. Carroll. 2004.
Finding Predominant Senses in Untagged Text. In Proc. of the 42nd Annual Meeting of the Association for Computational Linguistics, pages 280–287. D. McCarthy, R. Koeling, J. Weeds, and J. Carroll.
2007. Unsupervised Acquisition of Predominant Word Senses. Computational Linguistics, 33(4):553– 590.
G. A. Miller, C. Leacock, R. Tengi, and R. T. Bunker. 1998. A Semantic Concordance. In Proc. of the ARPA Workshop on Human Language Technology, pages 303–308.
Netlib. 2007. http://www.netlib.org/scalapack/index.html. In Netlib Repository at UTK and ORNL.
T. G. Rose, M. Stevenson, and M. Whitehead. 2002. The Reuters Corpus Volume 1 - from yesterday’s news to tomorrow’s language resources. In Proc. of Third International Conference on Language Resources and Evaluation.
H. Schmid. 1995. Improvements in Part-of-Speech Tag-ging with an Application to German. In Proc. of the EACL SIGDAT Workshop.
V. Vapnik. 1995. The Nature of Statistical Learning The-ory. Springer.