Kinetics of Solid-State Reactive Diffusion between Au and Al
Minho O
*1and Masanori Kajihara
*2Department of Materials Science and Engineering, Tokyo Institute of Technology, Yokohama 226-8502, Japan
In the wire bonding technique, a thin Au wire is interconnected with an Al layer on a Si chip. During energization heating at solid-state temperatures, however, brittle Au-Al compounds with high electrical resistivities are formed at the interconnection by the reactive diffusion between Au and Al. In order to examine the growth behavior of the Au-Al compounds, the kinetics of the reactive diffusion was experimentally observed using sandwich Al/Au/Al diffusion couples. The diffusion couple was prepared by a diffusion bonding technique and then isothermally annealed at temperatures of 623–723 K for various times up to 103 h. Under such annealing conditions, the diffusion couple is practically considered semi-infinite. Owing to annealing, compound layers consisting of AuAl2, AuAl and Au8Al3are produced at the initial
Au/Al interface in the diffusion couple. The volume fraction in the compound layers is larger for Au8Al3than for AuAl and AuAl2in the early
stages but becomes smaller for Au8Al3than for AuAl and AuAl2in the late stages. However, there are no systematic dependencies of the volume
fraction on the annealing time and temperature. The total thickness of the compound layers is proportional to a power function of the annealing time. The exponent of the power function is smaller than 0.5 at 673–723 K. The exponent smaller than 0.5 means that the interdiffusion across the compound layers governs the layer growth and boundary diffusion predominantly contributes to the interdiffusion. On the other hand, at 623 K, the exponent is equal to unity for annealing times shorter than 8 h but smaller than 0.5 for those longer than 8 h. The exponent of unity indicates that the layer growth is controlled by the interface reaction at the migrating interface. Thus, atT¼623K, the transition of the rate-controlling process occurs at a critical annealing time of 8 h. [doi:10.2320/matertrans.M2010433]
(Received December 24, 2010; Accepted January 20, 2011; Published March 2, 2011)
Keywords: reactive diffusion, intermetallic compounds, interface reaction, gold-aluminum system
1. Introduction
The wire bonding technique is widely used in the semi-conductor industry. In this technique, a thin Au wire is usually interconnected with an Al layer on the Si chip. During heating under energization conditions at solid-state temperatures, however, Au-Al compounds are formed at the interconnection due to the reactive diffusion between Au and Al. The Au-Al compounds are brittle and possess high electrical resistivities. Thus, the formation of the Au-Al compounds deteriorates the electrical and mechanical prop-erties of the interconnection.
The solid-state reactive diffusion between Au and Al has been experimentally studied by many investigators.1–13) According to a phase diagram in the binary Au-Al system,14) six compounds appear as stable phases at temperatures lower than 773 K. They are Au4Al, Au5Al2, -Au2Al, -Au2Al,
AuAl and AuAl2. In a recent supplement of the phase
diagram,15) however, Au5Al2 is replaced by Au8Al3. Thus,
the stoichiometry Au8Al3is adopted in the present article. An
experiment of the reactive diffusion was conducted by Chang
et al.8)using diffusion couples composed of a Au wire and a thin Al layer. In this experiment, the diffusion couple was isothermally annealed at 448 K for various times up to 1008 h. During annealing, Au2Al, Au8Al3 and Au4Al are
formed at the initial Au/Al interface in the diffusion couple. However, AuAl and AuAl2 were not clearly observed.
Although the total volume of these compounds monotoni-cally increases with increasing annealing time, the volume fraction of each compound varies depending on the annealing time in a complicated manner. Similar results were reported also by Noolu et al.10) and Breach and Wulff.11)Since the
initial thickness of the Al layer in the diffusion couple is small,8)however, soft impingement of diffusion may occur in the Au layer after a certain annealing time and will influence the growth behavior of the compound. Furthermore, in the late stages, the Al layer is completely consumed by the growth of the compound. Consequently, such a finite diffusion couple may not be suitable for the reactive diffusion experiment. Nevertheless, this type of diffusion couple has been preferably used in most of the experiments.
The kinetics of the reactive diffusion was experimentally observed by Philofsky6)using semi-infinite Au/Al diffusion couples. Here, the semi-infinite diffusion couple means that the penetration distance of diffusion is much smaller than the thickness for each terminal specimen of the diffusion couple. In this experiment, the diffusion couple was isothermally annealed at temperatures of 473–733 K for various periods up to 97 h. According to the observation, all the stable compounds are formed as layers at the Au/Al interface in the diffusion couple, and the total thickness of the compound layers increases in proportion to the square root of the annealing time. Such a relationship is called the parabolic relationship. This relationship usually indicates that the growth of the compound layers is controlled by volume diffusion. Although the thickness was measured for four and five annealing times at 473 K and 673 K, respectively, it was determined for only two annealing times at 523 K, 573 K, 623 K and 733 K. The annealing time dependence of the thickness may be rather credibly estimated from the four or five experimental points. However, the two experimental points cannot guarantee that the parabolic relationship surely holds between the thickness and the annealing time. Thus, the temperature dependence of the growth rate of the compounds could not be reliably evaluated in a wide temperature range. In order to examine the growth behavior of the Au-Al compounds, the kinetics of the solid-state reactive diffusion
*1Graduate Student, Tokyo Institute of Technology
*2Corresponding author, E-mail: [email protected]
between Au and Al was experimentally observed in the present study. In the experiment, sandwich Al/Au/Al diffusion couples were prepared by a diffusion bonding technique and then isothermally annealed at temperatures of 623–723 K for various times up to 103 h. Under such annealing conditions, the diffusion couple is practically considered semi-infinite. The microstructure of the annealed diffusion couple was observed in a metallographical manner. The rate-controlling process was discussed on the basis of the observation.
2. Experimental
Polycrystalline pure Al plate specimens with a dimension of14mm5mm2mm were cut from a commercial pure Al sheet with a thickness of 2 mm and purity of 99.99%. Two parallel surfaces with an area of14mm5mm of each Al plate specimen were mechanically polished on 600–1000 emery papers. One of the polished surfaces was again mechanically polished on 1500–4000 emery papers and then finished using diamond with a diameter of 1mm. Polycrystal-line pure Au sheet specimens with a dimension of20mm
7mm0:1mm were cut from a commercial pure Au sheet with a thickness of 0.1 mm and purity of 99.99%. Each Au sheet specimen was degreased in acetone with an ultrasonic cleaner and then immediately sandwiched between two freshly prepared Al plate specimens in methanol by the technique reported in a previous study.16) Each sandwich couple was completely dried and then isothermally heat treated for diffusion bonding in an evacuated silica tube at temperatures of 623 K, 673 K and 723 K for times of 5 h, 1 h and 1 h, respectively, followed by air cooling. The diffusion couples were separately encapsulated in evacuated silica capsules and then isothermally annealed at temperatures of 623 K, 673 K and 723 K for various periods up to 102 h, followed by water quenching without breaking the capsules. Hereafter, the summation of the heat-treating and annealing times is merely called the annealing timet, and the annealing temperature is denoted byT. Cross-sections of the annealed diffusion couple were mechanically polished using 1500– 4000 emery papers and diamond with a size of 1mm and then finished with an OP-S liquid manufactured by Struers Ltd. The microstructure of the cross-section was observed with a differential interference contrast optical microscope (DICOM). Concentration profiles of Au and Al on the cross-section were measured by electron probe microanalysis (EMPA).
3. Results and Discussion
3.1 Microstructure
Typical DICOM photographs of cross-section for the annealed diffusion couple are shown in Fig. 1. Figure 1(a) indicates the photograph of the freshly finished cross-section for the diffusion couple with T¼723K and t¼24h (8:64104s). In this figure, the top and bottom regions are the Au and Al specimens, respectively. As can be seen, three layers with different contrasts are formed at the initial Au/Al interface. The contrast of the intermediate layer is consid-erably different from that of the lower layer but rather close
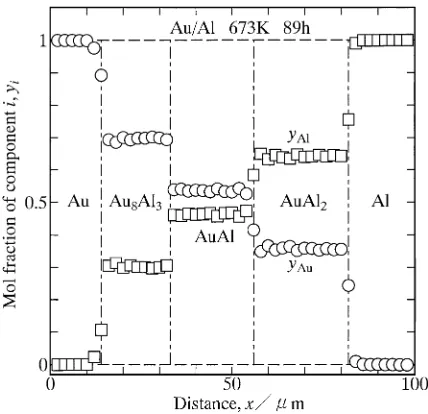
to that of the upper layer. The cross-section in Fig. 1(a) was exposed to an ambient atmosphere for 4 days and then observed in a similar manner. The resultant microstructure is shown in Fig. 1(b). Due to the exposure, the contrast of the upper layer becomes much darker than that of the inter-mediate layer. Consequently, the three layers are clearly distinguished one another in Fig. 1(b). Such a dark contrast of the upper layer may be attributed to the oxidation during the exposure. In order to identify each layer, concentration profiles of Au and Al along the direction normal to the initial Au/Al interface were measured by EPMA on the freshly finished cross-section like Fig. 1(a). A result of the diffusion couple with T¼673K and t¼89h (3:20105s) is
indicated in Fig. 2. In this figure, the ordinate and the abscissa show the mol fraction yi of component i and the distancex, respectively, and open circles and squares indicate the results of Au and Al, respectively. As can be seen in Fig. 2, the layers are Au8Al3, AuAl and AuAl2from the Au
side to the Al side. According to a recent phase diagram in the binary Au-Al system,15)six compounds appear as stable phases at T ¼623{723K. They are Au4Al, Au8Al3,
-Au2Al, -Au2Al, AuAl and AuAl2. However, Au4Al and
Au2Al were not clearly recognized even for the diffusion
couple annealed at the highest temperature ofT ¼723K for the longest time oft¼101h (3:64105s). The compound
layers consisting of Au8Al3, AuAl and AuAl2were observed
in all the annealed diffusion couples. Hereafter, the com-pound layers are merely called the intermetallic layer.
3.2 Growth behavior of intermetallic layer
From the DICOM photographs of cross-section like Fig. 1(b), the total thicknesslof the intermetallic layer was evaluated by the equation
Fig. 1 DICOM photographs of cross-section for the diffusion couple with
T¼723K and t¼24h (8:64104s): (a) fresh finishing, and (b)
[image:2.595.308.548.69.322.2]l¼A
w; ð1Þ
where wandA are the length parallel to the initial Au/Al interface and the total area of the intermetallic layer, respectively, on the cross-section. The results of T ¼
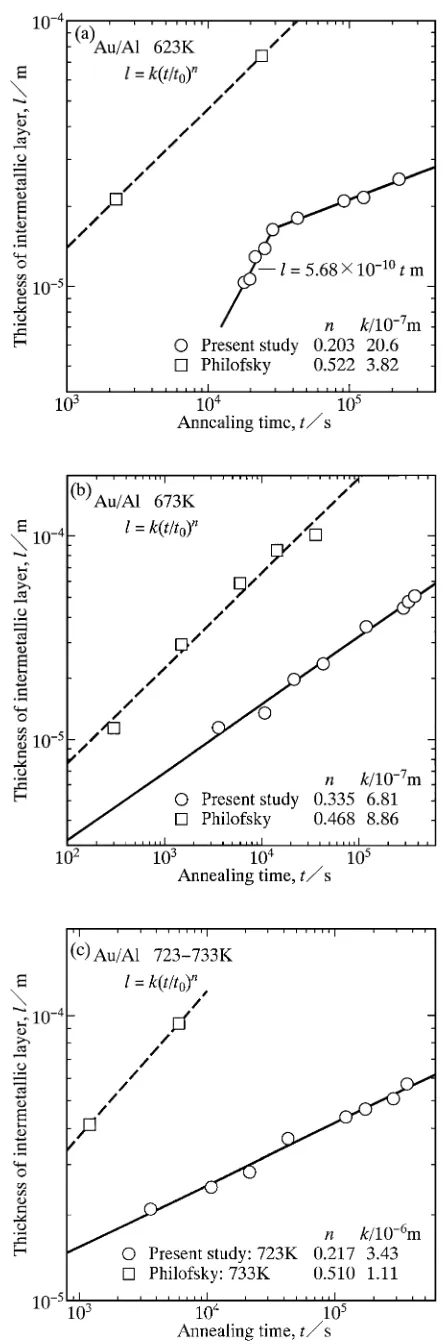
623K, 673 K and 723 K are shown as open rhombuses, squares and circles, respectively, in Fig. 3. In this figure, the ordinate and the abscissa indicate the logarithms of landt, respectively. As can be seen, the thickness lmonotonically increases with increasing annealing timet. Furthermore, the plotted points at each annealing temperature are located well on a straight line. This means that l is mathematically expressed as a power function oftby the following equation.
l¼k t t0
n
ð2Þ
Here,t0is unit time, 1 s. It is adopted to make the argument
t=t0of the power function dimensionless. The proportionality
coefficientkhas the same dimension as the thickness l, but the exponent nis dimensionless. From the open symbols in Fig. 3,kandnwere estimated by the least-squares method as shown with solid lines. AtT¼673{723K,nis smaller than 0.5. On the other hand, atT ¼623K,nis equal to unity for
t<8:08h (2:91104s) but smaller than 0.5 fort>8:08h. Thus, atT¼623K,ndiscontinuously varies depending ont
at tc¼8:08h, wheretc is the critical annealing time. This discontinuous variation of n is attributed to the transition of the rate-controlling process for the growth of the inter-metallic layer. The relationship between the rate-controlling process and the exponent nwill be discussed in detail later on.
According to a recent phase diagram in the binary Au-Al system,15)the solubility of Al in Au is around 10 at% and that of Au in Al is negligible atT ¼623{723K. Thus, the interdiffusion coefficient of the Al-rich solid phase is very close to the tracer diffusion coefficient of Au in Al, and that of the Au-rich solid phase is not so different from the tracer diffusion coefficient of Al in Au.17) In such a case, the penetration distanced of diffusion is roughly estimated by the following equation.17)
d¼2pffiffiffiffiffiDt ð3Þ
Here, Dis the tracer diffusion coefficient. The temperature dependence ofDis expressed as
D¼D0exp
Q RT
; ð4Þ
where D0 is the pre-exponential factor, Qis the activation
enthalpy, andRis the gas constant. The following parameters are reported in a literature:18) D
0¼2:2104m2/s and
Q¼134kJ/mol for Au in Al; and D0¼1:07105m2/s
and Q¼177kJ/mol for Au in Au. However, no reliable information is available for the corresponding parameters of Al in Au. Thus, as to Al in Au, the values ofD0 andQ
for Au in Au were used to evaluateD. For the longest time of t¼101h (3:64105s) at the highest temperature of
T ¼723K, the evaluation provides the penetration distances
dAlAu¼52mmanddAuAl ¼1:6mmfor Au in Al and Al in Au, respectively, but the thicknesses of the Al and Au specimens in the diffusion couple are lAl ¼2mm and lAu¼52mm, respectively. Hence,dAl
Au andd Au
Al are much smaller thanlAl andlAu, respectively. This means that the Al/Au/Al diffusion couple is surely considered semi-infinite under the annealing conditions in the present study.
As mentioned in Section 1, the kinetics of the reactive diffusion between Au and Al was experimentally observed by Philofsky6)using semi-infinite Au/Al diffusion couples. In this experiment, the diffusion couple was prepared by a butt-welding technique and then isothermally annealed at temper-atures of T ¼473{733K for various times up to t¼97h (3:49105s). After annealing, all the stable compounds were observed as layers at the Au/Al interface in the diffusion couple. The dependencies ofl ont atT ¼623K,
Fig. 2 Concentration profiles of Au and Al across the compound layers in the diffusion couple withT¼673K andt¼89h (3:20105s).
[image:3.595.61.275.70.277.2] [image:3.595.61.278.332.544.2]673 K and 733 K reported by Philofsky6)are represented as open squares with dashed lines in Fig. 4(a), (b) and (c), respectively. Like Fig. 3, the ordinate and the abscissa in Fig. 4 indicate the logarithms of l and t, respectively. At
T ¼673K in Fig. 4(b), the dashed line was obtained from the five open squares by the least-squares method. However, atT¼623K and 733 K in Fig. 4(a) and (c), respectively, the two open squares are merely connected with each other by a dashed line. On the other hand, the results ofT ¼623K, 673 K and 723 K in Fig. 3 are shown again as open circles with solid lines in Fig. 4(a), (b) and (c), respectively. In Fig. 4(c),Tis higher by 10 K for the dashed line than for the solid line, andlis larger for the former line than for the latter line. Thus, it is anticipated that the larger value of l is attributed to the higher value of T. Even at the equivalent temperatures in Fig. 4(a) and (b), however,lis greater for the dashed line than for the solid line. This means that the overall growth rate of the intermetallic layer is greater in the study by Philofsky6)than in the present study. The diffusion couple was prepared by the butt-welding technique in the former study but by the diffusion bonding technique in the latter study. Thus, the preparation method of the diffusion couple is dissimilar in the two studies. In the diffusion bonding technique, the bonding was conducted at the same temper-ature as the isothermal annealing, and the annealing timet
corresponds to the summation of the bonding and annealing times. Hence,tindicates the net annealing time. On the other hand, the heating conditions of the butt-welding technique were not explicitly explained by Philofsky.6) Hence, no information is available for the influence of the butt-welding on the growth of the intermetallic layer. If the intermetallic layer is formed during the butt-welding and t merely indicates the annealing time excluding the butt-welding time, l is overestimated for a given value of t or t is underestimated for that ofl. In such a case, the dashed line is located on the upper side of the solid line.
The reactive diffusion between Au and an Al-base alloy containing 1 mass% of Si and 0.5 mass% Cu was exper-imentally observed by Breach and Wulff13)using Au/(Al-Si-Cu) diffusion couples. Here, the thickness is 1mmfor the Al-Si-Cu alloy but sufficiently large for Au. In their experiment, the diffusion couple was isothermally annealed at 448 K for various times up to 497 h (1:79106s). Owing to annealing, Au8Al3 and Au4Al layers are produced at the interface in
the diffusion couple. Unlike the experiment by Philofsky,6) however, Au2Al, AuAl and AuAl2 were not clearly
recog-nized. Breach and Wulff reported that the parabolic relation-ship held between the total thickness l of the Au8Al3 and
Au4Al layers and the annealing time t in the range of
t¼3:42103{4:14104s. Their result for the dependence
oflontin this range is represented as open circles in Fig. 5. In this figure, like Figs. 3 and 4, the ordinate and the abscissa show the logarithms oflandt, respectively. As can be seen,l
is proportional to a power function oft. From eqs. (3) and (4), the penetration distance of Au in Al is evaluated to be 0.093mm at T ¼448K for t¼4:14104s. Although the Al-Si-Cu alloy is finally consumed by the growth of the compound layers, the thickness lAl of the alloy at each annealing time was not reported by Breach and Wulff.13)IflAl is much larger than 0.1mmatt¼4:14104s, however, the
Fig. 4 The results in Fig. 3 are shown as open circles with solid lines for (a) T¼623K, (b) T¼673K and (c) T¼723K. The corresponding results ofT¼623{733K by Philofsky6)are also indicated as open squares
Au/(Al-Si-Cu) diffusion couple is considered semi-infinite within the experimental annealing times in Fig. 5. A solid line in this figure indicates the calculation from eq. (2) by the least-squares method. According to this solid line, the exponentnof the power function is smaller than 0.5.
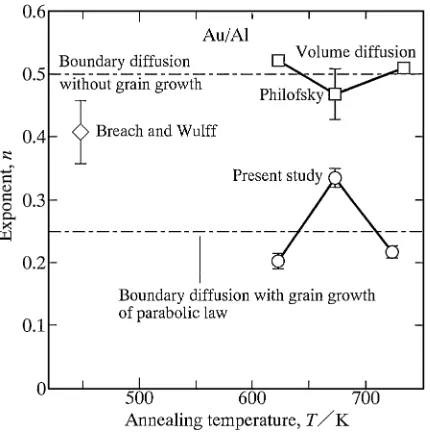
The exponent n is plotted against the annealing temper-atureTin Fig. 6. In this figure, open circles and squares with error bars show the results of the solid and dashed lines, respectively, in Fig. 4, and an open rhombus with an error bar indicates that of the solid line in Fig. 5. AtT ¼623K in Fig. 4(a), however,n¼1fort<tc¼8:08h (2:91104s), butn¼0:203fort>tc. The physical meaning ofn¼1will be discussed later on, and hence only the value n¼0:203 is indicated for T¼623K in Fig. 6. On the other hand,
at T ¼623K and 733 K in Fig. 4(a) and (c), respectively, the dashed line merely connects the two open squares with each other and thus cannot provide the standard error of n. Consequently, for the open squares in Fig. 6, n is less reliable at T¼623K and 733 K than atT ¼673K. When the growth of the intermetallic layer is controlled by the interdiffusion across the intermetallic layer and the inter-diffusion is governed by volume inter-diffusion,nis equal to 0.5. The value n¼0:5 is realized also for the layer growth controlled by boundary diffusion unless grain growth occurs in the intermetallic layer.19)If grain growth takes place in the intermetallic layer, however, n becomes smaller than 0.5 for the boundary diffusion rate-controlling process. Further-more,nis equivalent to 0.25, if the grain growth obeys the parabolic law.20) Here, the parabolic law means that the mean grain size of the intermetallic layer increases in proportion to the square root of the annealing time. As to the open circles in Fig. 6,nis rather close to 0.25, and there is no systematic dependence ofnonT. Thus, we may conclude that the layer growth is predominantly controlled by the boundary diffusion across the intermetallic layer and the grain growth takes place almost according to the parabolic law. In order to test the validity of this conclusion, the metallographical observation of the polycrystalline grain in the intermetallic layer was tried by a chemical etching technique with various etchants. Although the oxidation of Au8Al3occurs during the exposure of the cross-section to an
ambient atmosphere for 4 days as shown in Fig. 1(b), the Au-Al compounds are highly corrosion resistant against the chemical etching. As a consequence, the polycrystalline grain was not clearly observed on the DICOM photograph of the chemically etched cross-section, and thus the grain growth of the intermetallic layer could not be confirmed in a metallographical manner. On the other hand,nis close to 0.5 for the open squares in Fig. 6. In this case, however, there are two possibilities of the rate-controlling process as mentioned above. Nevertheless, the open circles deduce that the boundary diffusion considerably contributes to the rate-controlling process of the layer growth at T ¼623{ 723K. This implies that the grain growth is sluggish for the open squares. As mentioned earlier, the open squares and circles in Fig. 6 were obtained by the butt-welding and diffusion-bonding techniques, respectively. Though the heating conditions were not explicitly explained for the butt-welding technique,6) the difference of n between the open circles and squares in Fig. 6 indicates that the grain growth behavior of the intermetallic layer is dissimilar in the diffusion couples prepared by the diffusion-bonding and butt-welding techniques. As mentioned earlier, Breach and Wulff13)reported that n¼0:5 atT ¼448K. However, the open rhombus in Fig. 6 shows that n is close to 0.4 at
T ¼448K. Considering the open rhombus and circles, we may anticipate that the exponentngradually increases from 0.25 to 0.4 with decreasing annealing temperature T from 723 K to 448 K. Consequently, it is concluded that the layer growth is predominantly controlled by boundary diffusion and the grain growth becomes rather sluggish at lower temperatures.
As shown in Fig. 2, the intermetallic layer is composed of Au8Al3, AuAl and AuAl2. The volume fraction fi of
Fig. 5 The total thicknesslof the intermetallic layer versus the annealing timet atT¼448K shown as open circles by Breach and Wulff.13)A
straight line indicates the calculation from eq. (2).
Fig. 6 The exponentnversus the annealing temperatureTshown as open circles with error bars. The experimental result by Philofsky6)is used for
[image:5.595.62.278.69.278.2] [image:5.595.63.278.341.557.2]compound i in the intermetallic layer is estimated by the following equation.
fi¼
Ai
A ð5Þ
Here,Aiis the area of compoundion the cross-section, and
i¼1, 2 and 3 for Au8Al3, AuAl and AuAl2, respectively.
The results of T ¼623K, 673 K and 723 K obtained from eq. (5) are shown in Fig. 7(a), (b) and (c), respectively. In this figure, the ordinate and the abscissa indicate fi and the logarithm of t, respectively, and open circles, squares and rhombuses representf1, f2and f3, respectively. Although the
open symbols are rather scattered,f1is greater than f2andf3
in the early stages but becomes smaller than f2and f3 in the
late stages. Hence, astincreases, f1 decreases, butf2and f3
increase. This means that Au8Al3is predominantly formed in
the early stages and then replaced by AuAl and AuAl2in the
late stages. However, there are no systematic dependencies of f1, f2 and f3 ontandT.
The results of f1, f2 and f3 at T ¼673K reported by
Philofsky6) are shown in Fig. 8 with the same symbols as Fig. 7. Furthermore, in Fig. 8, open triangles and inverse-triangles indicate f4of Au2Al and f5of Au4Al, respectively,
by Philofsky.6)Since the chemical compositions of-Au
2Al
and -Au2Al are close to each other,15) -Au2Al and
-Au2Al were not distinguished by Philofsky.6) As can be
seen, f1 is greater than f2–f5. As t increases, f1 and f3
decrease, but f2, f4 and f5 increase. However, f2 and f5 are
negligible within the experimental annealing times. Thus, the layer growth behavior of each compound is dissimilar in Figs. 7(b) and 8. As mentioned earlier, the results in Figs. 7 and 8 are obtained for the diffusion couples prepared by the diffusion-bonding and butt-welding techniques, respectively. AtT ¼623{723K, the boundary diffusion plays an impor-tant role in the diffusion rate-controlling process of the layer growth. If the grain growth occurs in the compound layer, the volume fraction of the grain boundary in the compound layer monotonically decreases with increasing annealing time. Such decrease in the volume fraction diminishes the effective diffusion coefficient of the com-pound layer and hence decelerates the layer growth. This deceleration makes the exponentnsmaller than 0.5.19,20)As previously mentioned, however, the grain growth behavior of each compound is not similar to each other between the two types of diffusion couples. This means that the effective diffusion coefficient of each compound is dissimilar in Figs. 7 and 8. Hence, the difference of the layer growth behavior may be attributed to the dissimilarity in the grain growth behavior.
In spite of such a difference of the growth behavior, f1
is greater than f2–f5 fort<10h (3:6104s) atT ¼623{
723K in Figs. 7 and 8. The predominant formation of Au8Al3
in the early stages was explained by Pretoriuset al.21)using a thermodynamic model. As shown in Fig. 1(b), the oxidation resistivity in an ambient atmosphere is much smaller for Au8Al3 than for AuAl and AuAl2. As a consequence, the
predominant formation of Au8Al3 may deteriorate the
oxidation resistance of the interconnection. This deteriora-tion also influences the mechanical and electrical properties of the interconnection.
Fig. 7 The volume fractionfiversus the annealing timetshown as open
circles, squares and rhombuses for Au8Al3, AuAl and AuAl2, respectively,
[image:6.595.316.537.56.752.2]3.3 Transition of rate-controlling process
As indicated in Fig. 3, the exponentnis equal to unity for
t<8:08h (2:91104s) but smaller than 0.5 fort>8:08h at T ¼623K. Hence, at the lowest annealing temperature,
n discontinuously changes depending on t at tc¼8:08h. Here, tc is the critical annealing time. This discontinuous change of n is attributed to the transition of the rate-controlling process for the layer growth. Such transition of the rate-controlling process in the reactive diffusion is realized also for other alloy systems.16,22,23) For instance, the reactive diffusion between Ta and a bronze was experimentally observed in a previous study.16) In this experiment, diffusion couples composed of Ta and a Cu-9.3 at% Sn-0.3 at% Ti alloy were isothermally annealed at
T ¼973{1053K for various times up tot¼1462h (5:26
106s). During annealing, a uniform Ta
9Sn layer is formed at
the initial Ta/(Cu-Sn-Ti) interface in the diffusion couple. The mean thickness of the Ta9Sn layer is proportional to a
power function of the annealing time. The exponent of the power function is equal to unity at t<tc but smaller than 0.5 at t>tc. Thus, like the result of T ¼623K in Fig. 3, the transition of the rate-controlling process occurs for the growth of Ta9Sn. In this case,tc¼1:83106s,4:63105s and5:98105s atT¼973K, 1023 K and 1053 K,
respec-tively. The growth of Ta9Sn is controlled by the interface
reaction at the migrating Ta9Sn/Ta interface in the early
stages with t<tc. In the late stages with t>tc, however, the interdiffusion across the Ta9Sn layer governs the layer
growth and boundary diffusion remarkably contributes to the interdiffusion.16)
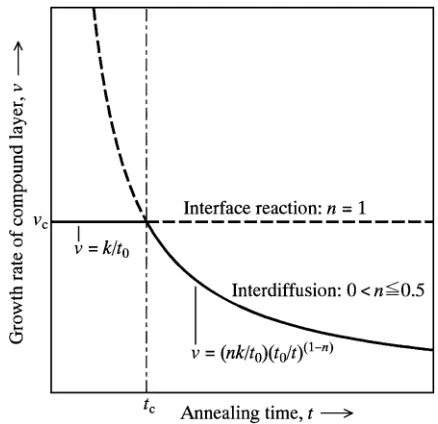
Iflis expressed as a power function oftby eq. (2) for the growth of a compound layer during solid-state reactive diffusion in a certain alloy system, the growth rate v of the compound layer is calculated for given values of k
and n by the following equation as reported in a previous study:16)
v¼dl
dt ¼ nk
t0
t0
t
1n
: ð6Þ
The dependencies of v on t for n¼1 and 0<n0:5 evaluated from eq. (6)16) are schematically drawn as a horizontal line and a smooth curve, respectively, in Fig. 9. In the case ofn¼1, eq. (6) givesv¼k=t0, and hencev is
constant independent oft. In contrast, for0<n0:5,v is infinitely large at t¼0 and monotonically decreases with increasing value of t. As a consequence, the smooth curve intersects the horizontal line att¼tc, wheretcis the critical annealing time as mentioned earlier. Nevertheless,tcmay not necessarily appear within experimental annealing times. Under realistic experimental conditions, the appearance oftc depends on the alloy system.
As reported in a previous study,24) the growth of the compound layer is determined by the mass transport across the compound layer. In the case of the diffusion rate-controlling process, the mass transport is governed by the interdiffusion. Since the diffusional flux Ji of component
i is proportional to the gradient i=l of the chemical potential across the compound layer,17) J
i is in inverse relation to l. Here, i is the difference between the chemical potentials of component i at the two parallel interfaces sandwiching the compound layer with the thick-nessl. When the growth of the compound layer proceeds in a semi-infinite diffusion couple, the chemical potential i of component i at each interface remains constant during the growth. Thus,i is also constant independent oft. At
t<tc,lis very small, and thusi=lis considerably large. In such a case, Ji is large, and hence the growth of the compound layer should be fast. Therefore, v may vary depending on t along the dashed curve indicated in Fig. 9. IfJi is very large, however, the interface reaction becomes an obstacle of the interface migration and thus the bottleneck for the layer growth. Consequently, att<tc,v cannot take
Fig. 8 The volume fractionfiversus the annealing timetshown as open
circles, squares, rhombuses, triangles and inverse-triangles for Au8Al3,
AuAl, AuAl2, Au2Al and Au4Al, respectively, at T¼673K by
Philofsky.6)
Fig. 9 Schematic relationships for the growth ratevof the compound layer versus the annealing time tobtained from eq. (6).16)A horizontal line
[image:7.595.60.280.68.285.2] [image:7.595.316.535.70.282.2]infinitely large values but becomes equal to k=t0 as shown
with the solid line in Fig. 9. On the other hand, att>tc,lis large, and hence i=l is relatively small. Under such conditions, Ji is small, and thus the interface reaction is no longer the bottleneck. As a result, at t>tc, v varies depending on t along the solid curve indicated in Fig. 9. This is the reason why the growth of the compound layer is controlled by the interface reaction at t<tc but by the interdiffusion at t>tc.
4. Conclusions
The growth behavior of the Au-Al compounds during the solid-state reactive diffusion between Au and Al was experimentally examined using the sandwich Al/Au/Al diffusion couple prepared by the diffusion bonding tech-nique. The diffusion couple was isothermally annealed in the temperature range of T ¼623{723K for various times up to t¼103h. Due to annealing, the compound layers composed of Au8Al3, AuAl and AuAl2 are produced at
the Au/Al interface in the diffusion couple. Among these compounds, Au8Al3 is predominantly formed in the early
stages and then replaced by AuAl and AuAl2 in the late
stages. However, the volume fraction of each compound does not systematically vary depending on the annealing time and temperature. The total thicknesslof the compound layers increases in proportion to a power function of the annealing time t. The exponent n of the power function is smaller than 0.5 at T ¼673{723K. This indicates that the growth of the compound layers is controlled by the interdiffusion across the layers and the interdiffusion is predominantly governed by boundary diffusion. In contrast, at T¼623K, n¼1 for t<8h, but n<0:5 for t>8h. The value n¼1 means that the interface reaction at the migrating interface controls the growth of the compound layers. Therefore, at T ¼623K, the transition of the rate-controlling process takes place at a critical annealing time of tc¼8h. Such transition should universally appear also at T >623K. Since the shortest annealing time is 1 h at both T ¼673K and 723 K, however, ts is shorter than 1 h atT ¼673{723K.
Acknowledgements
The present study was supported by the Iketani Science and Technology Foundation in Japan. The study was also partially supported by a Grant-in-Aid for Scientific Research from the Ministry of Education, Culture, Sports, Science and Technology of Japan.
REFERENCES
1) L. Bernstein: Semicond. Prod. August (1961) 35–39.
2) B. Selikson and T. A. Longo: Proc. IEEE52(1964) 1638–1642. 3) J. A. Cunningham: Solid-St. Electron.8(1965) 735–745.
4) I. A. Blech and H. Sello: J. Electrochem. Soc.113(1966) 1052–1054. 5) G. V. Browning, L. E. Colteryahn and D. G. Cummings:Physics of
Failure in Electronics, vol. 4, (RADC, 1964) p. 428. 6) E. Philofsky: Solid-St. Electron.13(1970) 1391–1399.
7) G. Majni, C. Nobili, G. Ottaviani and M. Costato: J. Appl. Phys.52
(1981) 4047–4054.
8) H.-S. Chang, J. X. Pon, K.-C. Hsieh and C. C. Chen: J. Electron. Mater.
30(2001) 1171–1177.
9) N. J. Noolu, N. M. Murdeshwar, K. J. Ely, J. C. Lippold and W. A. Baeslack III: Metall. Mater. Trans. A35A(2004) 1273–1280. 10) N. Noolu, N. Murdeshwar, K. Ely, J. Lippold and W. Baeslack III:
J. Electron. Mater.33(2004) 340–352.
11) C. D. Breach and F. Wulff: Microelectr. Reliab.44(2004) 973–981. 12) A. Karpel, G. Gur, Z. Atzmon and W. D. Kaplan: J. Mater. Sci.42
(2007) 2347–2357.
13) C. D. Breach and F. W. Wulff: Gold Bull.42(2009) 92–104. 14) T. B. Massalski, H. Okamoto, P. R. Subramanian and L. Kacprzak:
Binary Alloy Phase Diagrams, vol. 1, (ASM International, Materials Park, Ohio, 1990) p. 122.
15) H. Okamoto: J. Phase Equil. Dif.26(2005) 391–393.
16) Y. Tejima, S. Nakamura and M. Kajihara: J. Mater. Sci.45(2010) 919– 928.
17) P. G. Shewmon:Diffusion in Solids, (McGraw-Hill Book Company, New York, 1963) pp. 12–122.
18) Metals Data Book, ed. by Japan Inst. Metals, (Maruzen, Tokyo, 1993) p. 20.
19) A. Furuto and M. Kajihara: Mater. Trans.49(2008) 294–303. 20) Y. L. Corcoran, A. H. King, N. de Lanerolle and B. Kim: J. Electron.
Mater.19(1990) 1177–1183.
21) R. Pretorius, A. M. Vredenberg and F. W. Saris: J. Appl. Phys.70
(1991) 3636–3646.
22) F. Togashi and T. Nishizawa: J. Japan Inst. Metals40(1976) 12–21. 23) M. Kajihara: J. Mater. Sci.44(2009) 2109–2118.