Working patterns and food behaviour within the context of
family life.
HAMBLY, Rachel.
Available from Sheffield Hallam University Research Archive (SHURA) at:
http://shura.shu.ac.uk/19747/
This document is the author deposited version. You are advised to consult the
publisher's version if you wish to cite from it.
Published version
HAMBLY, Rachel. (2002). Working patterns and food behaviour within the context of
family life. Doctoral, Sheffield Hallam University (United Kingdom)..
Copyright and re-use policy
See
http://shura.shu.ac.uk/information.html
Sheffield Hallam University Research Archive
CITY CAMPIUS, HOWARD STREET
SHEFFIELD S1 1WB
1 0 1 6 9 8 9 2 2 9
REFERENCE
n c i u i *»I V V* 1 ■ ■ * v l l / I "2P— ■ ■ a wa
Fines
a re c h a rg e d a t 5Gp Pe r
1 2 JAN 2007
'
5 JAN
2f
Dr
6 - S 5 ^
- 6 FEB 2004
1 8 JUJ 2006
2 7 JUL 2006
I \0 3
r
L
o
f t d
c
\2007
4 _ ' 4 _ C f> 0
27 SEP * >
\ 1 U ' ° Lil-?o.p
- iProQuest N um ber: 10697049
All rights reserved
INFORMATION TO ALL USERS
The q u a lity of this re p ro d u c tio n is d e p e n d e n t u p o n the q u a lity of the c o p y s u b m itte d .
In the unlikely e v e n t that the a u th o r did not send a c o m p le te m a n u s c rip t and there are missing p a g e s , these will be n o te d . Also, if m a te ria l had to be re m o v e d ,
a n o te will in d ic a te the d e le tio n .
uest
P roQ uest 10697049
Published by ProQuest LLC(2017). C o p y rig h t of the Dissertation is held by the A u tho r.
All rights reserved.
This work is p ro te c te d a g a in s t u n a u th o riz e d c o p y in g under Title 17, United States C o d e M icro fo rm Edition © ProQuest LLC.
ProQuest LLC.
789 East Eisenhower Parkway P.O. Box 1346
Working Patterns and Food Behaviour
within the Context of Family Life
Rachel Hambly
A thesis submitted in partial fulfilment o f the requirements o f
Sheffield Hallam University
for the degree o f Doctor o f Philosophy
Abstract
In recent years, there has been concern about the impact of work on family life, particularly the effect that current working patterns may have on food behaviour (food provision, food consumption and eating patterns) within the home. Increased female employment and long working hours may affect family functioning though little has been done to model any association. There is evidence of less food preparation within the home, increased consumption o f convenience products and fragmented meal times. In addition lack o f time, irregular working hours and busy lifestyle have been identified as barriers to adopting a healthier diet Lappalainen et al (1998); suggesting those elements o f work and time may also determine the relative healthiness o f the diet. The effect this may have on future generations is unknown, but if less time is spent in food related activities within the home then there may be fewer opportunities for children to gain practical food knowledge and skills. Time constraints, experienced because of work, may possibly be eased by the use of time saving strategies and products. The main food provider's practical food knowledge, attitude and cooking skills may ameliorate the impact o f work on food behaviour. Whilst previous academic research has explored changing patterns o f work and food consumption independently, this study is original in its attempt to combine these separate disciplines. The aim of this research was to develop, build and test a theoretical model for exploring the relationship between working patterns and food behaviour. Following a systematic review o f the literature, a conceptual framework was built to identify the key dimensions o f work, food behaviour and the factors that may influence it. This was used in the development o f a postal survey instrument to measure and test the research hypotheses. The sample was made up of 642 households, with children aged between 8-10 years old, (a response rate of 22%). Data was established on household patterns o f eating and working in terms of the critical dimensions identified. This included food behaviour (food provider behaviour, eating behaviour of the household, healthy eating profile, shopping and cooking behaviours) and working patterns (hours, job satisfaction and time factors). Statistical analysis of the data was completed; descriptive statistics, analysis of variance and principal components were used to establish valid conclusions about relationships and test hypotheses.
Table of Contents
List of Tables
1
List of Figures
v
Acknowledgements
vl
CHAPTER 1 - Introduction
1.1 Introduction to Research
1
1.2 Aims and Objectives
3
1.3 Chapter Development
4
CHAPTER 2 - Literature Review
2.1 Work - The Impact on Family Life
5
2.1.1 Female Employment 6
2.1.1.1 Barriers to Female Employment 7
2.1.2 Time Spent at W ork 8
2.1.2.1 Working Hours 8
2.1.2.2 Working Time Directive 9
2.1.2.3 Gender and Working Hours 9
2.1.2.4 Part Time Work 10
2.1.3 W ork and Family: Redistributing Time and Responsibility 10 2.1.4 Perspectives on Time 12
2.1.4.1 Busy Lifestyle - "24/7" Society 12
2.1.4.2 Lack of Time - "Time Famine" 13
2.1.5 Role Overload - W ork Related Stress 13
2.1.5.1 'Wonder Woman" and "Super-Wife" 14
2.1.5.2 Job Satisfaction 15
2.2 Food Behaviour - Current Trends and Consequences
16
2.2.1 Food Provision: food shopping 17 2.2.2 Food Provision: food preparation 18 2.2.3 Convenience Food 18 2.2.4 Eating Habits 19 2.2.5 General Patterns in Food Consumption 19
2.2.5.1 Recommendations for Healthy Food Consumption Patterns 20
2.2.6 The Consequence of Current Food Behaviour 23
2.3 Developing a Conceptual Framework for Work and Food
25
Behaviour
2.3.1 Determinants of Food Behaviour 25 2.3.2 Characteristics of the Environment 26
2.3.2.1 Work - Time Factors 26
2.3.2.2 Work Patterns and Supportive Environment 28
2.3.2.3 Support in the Home 28
2.3.2.4 Income 29
2.3.3 Characteristics of the Individual 29
2.3.3.1 Education 29
2.3.3.2 Job Satisfaction 30
2.3.3.3 Nutrition Knowledge 31
2.3.3.4 Cooking Skills 31
2.3.3.5 Attitudes to Food and Nutrition 32
2.3.4 Conceptual Framework 32
CHAPTER 3 - Model Development
3.1 Developing an Operational Model
34
3.1.1 Identifying Working Pattern Variables 34
3.1.1.1 Intervening Variable - Job Satisfaction 35
3.1.2 Identifying Food Behaviour Variables 35
3.1.2.3 Mediating Variables - Nutrition Knowledge, Cooking Skills and 36
Attitudes to Food and Healthy Eating
3.1.3 Confounding Variables 36 3.1.4 Model Development 36
3.2 Hypotheses
38
CHAPTER 4 - Research Design and Methodology
4.1 Research Design
42
4.1.1 Methodological Considerations 43 4.1.2 Measuring Food Behaviour 43
4.1.2.1 Real Time Methods 44
4.1.2.2 Retrospective Methods 44
4.1.2.3 Sales Data 44
4.1.2.4 Nutrition Knowledge and Attitude 45
4.1.3 Sample Frame for the Study Population 45 4.1.4 Method of Data Collection 46
4.2 Questionnaire Design and Testing
47
* • •
4.2.1 General Considerations 47
4.2.1.1 Identifying the Main Food Provider 4 8
4.2.1.2 Questionnaire Layout 4 8
4.2.2 Paid Employment - Questionnaire Section A 48
4.2.2.1 Occupation and Type of Work 4 8
4.2.2.2 Time Committed to Work 4 9
4.2.2.3 Flexibility 4 9
4.2.2.4 Job Satisfaction 4 9
4.2.3 Family Food Provision - Questionnaire Section B 50
4.2.3.1 Food Shopping 5 0
4.2.3.2 Food Preparation 5 2
4.2.3.3 Eating Occasion 5 2
4.2.3.4 Help in the Home 5 3
4.2.3.5 Additional Comments 5 3
4.2.4 Family Food Consumption - Questionnaire Section C 53
4.2.4.1 Convenience Products 5 4
4.2.5 Characteristics of the Main Food Provider - Questionnaire Section D 54
4.2.5.1 Nutrition Knowledge 5 4
4.2.5.2 Attitude to Food and Nutrition 5 5
4.2.5.3 Education and Cooking Skills 5 5
4.2.6 Background Information - Questionnaire Section E 55
4.2.7 Pilot Study - Questionnaire Testing 56
4.3 Data Collection
57
4.3.1 Contacting the Schools 57
4.3.2 Contacting the Parents 57
4.3.3 Follow Up Letter 58
4.4 Data Analysis
59
4.4.1 Questionnaire Coding and Data Entry 59
4.4.2 Initial Analysis 59
4.4.3 Further Analysis 60
4.4.3.1 Statistical Analysis of Quantitative Data 61
4.4.4 Missing Data 62
CHAPTER 5 - Descriptive Analysis
5.1 Response Rates and Background Information
63
5.1.1 Response Rates 63
5.1.2 Socio-economic Profile 63
5.1.3 Household Members 65
5.1.3.1 The Main Food Provider 6 5
5.1.4 Car Access 65
5.1.5 Income 66
5.1.6 Health 66
5.1.7 Education 67
5.1.8 Summary 67
5.2 Working Patterns within the Study Population
68
5.2.1 Time Committed to Work 68
5.2.1.1 Employment Type 6 8
5.2.1.2 Average number of hours worked per week 6 8
5.2.1.3 Days and hours committed to work 7 0
5.2.2 Flexibility 70
5.2.3 Job Satisfaction 71
5.2.4 Hours of Work and Flexibility 72
5.2.5 Hours of Work and Job Satisfaction 73
5.2.6 Summary 73
5.3 Providing Food for the Family
74
5.3.1 Food Shopping Patterns 74
5.3.1.1 Number of food shopping trips per week 7 4
5.3.1.2 When the food shopping is done 7 4
5.3.1.3 Responsibility for food shopping 7 6
5.3.1.4 Time spent food shopping 7 7
5.3.2 Food Preparation 77
5.3.2.1 Division of labour 7 7
5.3.2.2 Time taken to prepare the family meal 7 8
5.3.3 Eating Patterns 79
5.3.3.1 Take-away and eating out 7 9
5.3.3.2 Main meal - eating patterns 8 0
5.3.3.3 Children's lunch 81
5.3.4 Help in the Home 81
5.3.5 Summary 82
5.4 Household Food Consumption
83
5.4.1 Interpretation of Household Food Consumption Data 83
5.4.1.1 Number of Portions 8 3
5.4.1.2 Frequency of Intake 8 4
5.4.2 Total Number of Food Portions Consumed 84
5.4.2.1 Starchy Foods 8 5
5.4.2.2 Milk and Dairy Foods 8 6
5.4.2.3 Fruit and Vegetables 8 7
5.4.2.4 Meat and Fish 8 7
5.4.3 Food Group Consumption 88
5.4.3.1 Food group intakes 8 8
5.4.4 Developing a Measure of Healthy Eating 89
5.4.4.1 Developing a measure of healthy eating using The Balance of Good 8 9
Health
5.4.4.2 Difficulties with using The Balance of Good Health 9 2
5.4.4.3 Developing a measure of healthy eating using COMA 9 2
recommendations (1994)
5.4.4.4 Which method for calculating healthy eating score? 9 3
5.4.4.5 Healthy eating score results 93
5.4.5 Food Consumption - Principal Components Analysis 94
5.4.6 Summary 96
5.5 Nutrition Knowledge and Attitudes to Food and Nutrition
97
and Cooking Skills
5.5.1 Nutrition Knowledge 97
5.5.1.1 Fat intake 9 7
5.5.1.2 Energy intake 98
5.5.1.3 Fruit and vegetables intake 9 9
5.5.1.4 Fibre intake 1 0 0
5.5.1.5 Sodium (salt) intake 101
5.5.2 Attitudes to Food and Nutrition 101
5.5.3 Confidence in Cooking Skills 103
5.5.4 Information Sources and Cooking Skills 103
5.5.5 Summary 104
CHAPTER 6 - Further Analysis
6.1 Further Analysis and Results
1°5
6.2 Work and Food Behaviour
107
6.2.1 Working Hours and Food Provision Activities 108
6.2.1.1 Time spent in food shopping and preparation:ANOVA 1 08
6.2.1.2 Responsibility for food shopping and food preparation: ANOVA 1 09
6.2.2 Correlation of Working Hours with Food Groups and Convenience 111
Food Intakes and Healthy Eating Scores
6.2.3 Correlation of Working Hours with Food Component Scores 112
6.2.4 Working Hours and Eating Patterns: ANOVA 113
6.2.4.1 Eating patterns during the week 1 14
6.2.4.2 Eating patterns at the weekend 115
6.2.5 Flexibility and Food Provision: Crosstabulation 115
6.2.6 Flexibility and Food Consumption: Independent Samples T-test 116
6.2.7 Flexibility and Eating Patterns: Crosstabulation 116
6.2.8 Shift Work and Food Provision: Crosstabulation 116
6.2.9 Shiftwork and Food Consumption: Independent Samples T-test 116
6.2.10 Shift Work and Eating Patterns: Crosstabulation 116
6.2.11 Summary and Initial Interpretation of Main Results 117
6.3 Job Satisfaction and Food Behaviour
118
6.3.1 Job Satisfaction and Food Provision: ANOVA 119
6.3.1.1 Time spent in food shopping and preparation:ANOVA 1 19
6.3.1.2 Responsibility for food shopping and food preparation: ANOVA 119
6.3.2 Correlation of Job Satisfaction and Food Group and Convenience 121
Food Intakes and Healthy Eating Scores
6.3.3 Correlation of Autonomy, Feedback and Environment with Food 122
Group and Convenience Food Intakes and Healthy Eating Scores
6.3.4 Correlation of Total Job Satisfaction and Food Component Scores 123
6.3.5 Correlation of Autonomy, Feedback and Environment with Food 124
Component Scores
6.3.6 Job Satisfaction and Eating Patterns 124
6.3.7 Summary and Initial Interpretation of Main Results 126
6.4 Mediating Variables and Food Behaviour: Nutrition
128
Knowledge, Attitudes to Food & Nutrition and Cooking Skills
6.4.1 Nutrition Knowledge, Attitude, Cooking Skills and Food Provision 129
Activities
6.4.1.1 Time spent in food shopping and food preparation: ANOVA 130
6.4.1.2 Responsibility for food shopping and food preparation 131
6.4.2 Correlation of Nutrition Knowledge and Attitude Scores with Food 132
Group, Convenience Food Intakes and Healthy Eating Scores
6.4.3 Correlation of Nutrition Knowledge and Attitude with Food 134
Component Scores
6.4.4 Eating Patterns and Nutrition Knowledge, Attitude and Confidence in 135
Cooking Skills
6.4.4.1 Eating patterns during the week 135
6.4.4.2 Eating patterns at the weekend 1 37
6.4.5 Summary and Initial Interpretation of Main Results 137
6.5 Confounding Variables: Income, Education and Paid and
139
Unpaid Help in the Home
6.5.1 Income and Working Hours 141
6.5.2 Income and Food Consumption 141
6.5.3 Income and Job Satisfaction 142
6.5.4 Education, Working Hours and Job Satisfaction 143
6.5.5 Education and Food Consumption 144
6.5.6 Nutrition Education and Food Consumption 145
6.5.7 Nutrition Education, Nutrition Knowledge, Attitudes, Cooking Skills 146
6.5.8 Paid and Unpaid Help in the Home and Working Hours 146
6.5.9 Paid and Unpaid Help in the Home and Job Satisfaction 147
6.5.10 Paid and Unpaid Help in the Home and Food Behaviour 147
6.5.11 Summary and Initial Interpretation of Main Results 148
CHAPTER 7 - Discussion
7.1 Overview and Discussion of Main Results
149
7.1.1 Food Shopping 149
7.1.1.1 Finding ways to manage food shopping 149
7.1.1.2 Sharing the responsibility for food shopping 151
7.1.2 Food Preparation 151
7.1.2.1 Finding the time for food preparation 152
7.1.2.2 Food preparation - being "in the right place at the right time" 153
7.1.3 Patterns of Food Consumption 154
7.1.3.1 Food consumption - time and timing 154
7.1.3.2 Healthy Eating 155
7.1.3.3 Food preferences - likes and dislikes 1 56
7.1.4 Characteristics of the Main Food Provider 157
7.1.4.1 Nutrition knowledge - putting theory into practice 157
7.1.4.2 Cooking skills 158
7.1.4.3 Attitudes to food and nutrition 158
7.1.5 Eating Patterns 159
7.1.5.1 Family scheduling 159
7.1.5.2 Social importance of food within the family 160
7.1.6 Characteristics of the Home Environment 161
7.1.6.1 Income 161
7.1.6.2 External sources of help within the home 161
7.1.6.3 Getting the children involved 162
7.2 Discussion of Methodology and Limitations
163
7.2.1 The Research Design 163
7.2.1.1 Case studies using activity diaries 163
7.2.1.2 Interviewing the main food provider 164
7.2.1.3 Family focus groups 164
7.2.1.4 Modified research design 164
7.2.2 Issues of Reliability and Validity 165
7.2.2.1 Measures of work 166
7.2.2.3 Measuring characteristics of the main food provider 168
7.2.2.4 Measuring characteristics of the home environment 169
7.2.3 Research Bias 169
7.3 Discussion of Conceptual Framework and Limitations
170
CHAPTER 8 - Conclusions
8.1 Main Findings of the Study
173
8.1.1 Contribution to Knowledge 173
8.1.2 Reviewing the Aims and Objectives 174
8.1.3 Conclusion 176
8.2 Implications and Recommendations for Further Work
178
8.2.1 Implications of the research findings 178
8.2.2 Recommendations for future work 179
BIBLIOGRAPHY
APPENDICES
Appendix A
Appendix B
Appendix C
Appendix D
Appendix E
Appendix F
Appendix G
Appendix H
Appendix I
Appendix J
Appendix K
Food and nutrition Recommendations from COMA report on
the Nutritional Aspects of Cardiovascular Disease
The Balance of Good Health - tilted plate National Food
Guide
Unemployment rates for Sheffield wards
List of primary schools contacted and used for the distribution
questionnaires
Final questionnaire
Correspondence with schools
Correspondence with parents
Illustrative example of changes to National Food Survey
results if the COMA (1994) recommendations were to be met.
Developing a Healthy Eating Score - definition of pragmatic
acceptable limits
Scoring for attitudinal statements
Food items from questionnaire used to calculate food item
List of Tables
Table 2.1 Trends in Female Employment 7
Table 2.2 Time use in a typical week, by employment status and gender, GB 1995
(Abercrombie &Warde, 1996)
11
Table 2.3 Sources of Stress at Work - Adapted from Arnold et al (1999) 14
Table 2.4 Summary of the COMA Recommendations on Nutrient and Food Intakes
(1994)
21
Table 2.5 Summary and comparison of National Food Survey Results for 1988 and
1998
22
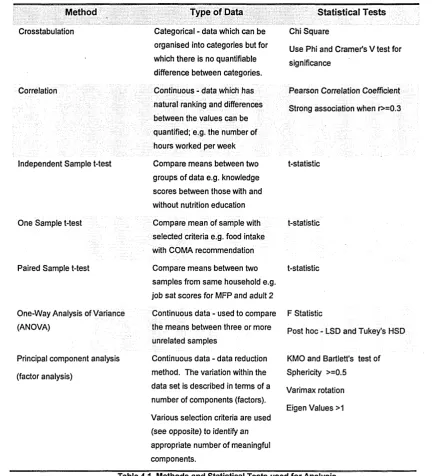
Table 4.1 Methods and Statistical Tests used for Bivariate Analysis 61
Table 5.1 Household type; shown as a percentage of the total sample 64
Table 5.2 Distribution of Occupational Groups 64
Table 5.3 Number of adults and children in the household 65
Table 5.4 Most common health disorders within the study population 67
Table 5.5 Education of Main Food Provider 67
Table 5.6 Employment Type 69
Table 5.7 Time Committed to work each week 70
Table 5.8 Patterns of Work
71-Table 5.9 Mean Scores for Job Satisfaction: Autonomy, Feedback, Environment and
Reward
72
Table 5.10 Correlation Matrix for Number of Hours Worked per Week and Job
Satisfaction
73
Table 5.11 Number of shopping trips per week 75
Table 5.12 Breakdown of Food Shopping during the week 75
Table 5.13 Main Food Shopping and Top Up Food Shopping patterns for the main
food provider and other adult
76
Table 5.14 Main Food Shopping Combinations 76
Table 5.15 Estimated time spent food shopping each week 77
Table 5.16 Food preparation patterns for main food provider and other adult 78
Table 5.17 Food Preparation Combinations 78
Table 5.18 Estimated time spent in food preparation each week 79
Table 5.19 Take-away and Eating out during the week and at the weekend 80
Table 5.20 Household eating patterns during the week and at the weekend 81
Table 5.21 Children's lunch during term time 81
Table 5.22 Food consumption data as number of portions per week 83
Table 5.24 Table 5.25 Table 5.26 Table 5.27 Table 5.28 Table 5.29 Table 5.30 Table 5.31 Table 5.32 Table 5.33 Table 5.34 Table 5.35 Table 5.36 Table 5.37 Table 5.38 Table 5.39 Table 5.40 Table 5.41 Table 5.42 Table 6.1 Table 6.2 Table 6.3 Table 6.4 Table 6.5 Table 6.6 Table 6.7
Intake of carbohydrate rich foods
Intake of milk and dairy products
Intake of fruit and vegetables
Intake of meat and fish
Intake of sugary and fatty foods
Food Groups - using food items from questionnaire
The sum of 101% results from rounding of the individual values (Adapted
from Gatenby, et al, 1995)
Illustrative example of the healthy eating score calculation, based on The
Balance of Good Health, using the data from one household in the study
population.
Illustrative example of the healthy eating score calculation, based on
COMA recommendations, using data from one household in the study
population
Calculation of Household healthy eating score using percentage of
recommended COMA portions and pragmatic acceptable limits for each
food group
Principal Component for Food Data
Fat Knowledge
Energy Intake Knowledge
Fruit and Vegetable Knowledge
Fibre Knowledge
Sodium (salt) Knowledge
Food and Nutrition Attitude Statements
Confidence in Cooking'Skills
Main Sources of Cooking Skills and Food Nutrition Knowledge
One-Way ANOVA Time spent food shopping and average working hours
per week
One-Way ANOVA Time spent in food preparation during the week and
average working hours per week
One-Way ANOVA Time spent in food preparation at the weekend and
average working hours per week
One-Way ANOVA Division of responsibility for main food shopping and
average working hours per week
One-Way ANOVA Division of responsibility for top up food shopping and
average working hours per week
One-Way ANOVA Division of responsibility for food preparation during the
week and average working hours
One-Way ANOVA Division of responsibility for food preparation at the
weekend and average working hours
Table 6.8 Table 6.9 Table 6.10 Table 6.11 Table 6.12 Table 6.13 Table 6.14 Table 6.15 Table 6.16 Table 6.17 Table 6.18 Table 6.19 Table 6.20 Table 6.21 Table 6.22 Table 6.23 Table 6.24 Table 6.25 Table 6.26 Table 6.27 Table 6.28
Correlation of Working Hours, Food Group Intakes and Healthy Eating
Scores
Correlation of Working Hours and Food Component Scores
One-Way ANOVA for mean working hours and eating pattern groups
during the week
One-Way ANOVA for mean working hours and eating pattern groups at
the weekend
One-Way ANOVA Time spent food shopping and average job satisfaction
scores
One-Way ANOVA Time spent in food preparation during the week and
average job satisfaction scores
One-Way ANOVA Time spent in food preparation at the weekend and
average job satisfaction scores
One-Way ANOVA Division of responsibility for main food shopping and
job satisfaction
One-Way ANOVA Division of responsibility for top up food shopping and
job satisfaction
One-Way ANOVA Division of responsibility for food preparation during the
week and job satisfaction
One-Way ANOVA Division of responsibility for food preparation at the
weekend and job satisfaction
Correlation of Job Satisfaction with Food Groups, Convenience Food and
Healthy Eating Scores
Correlation of Autonomy, Feedback and Environment Satisfaction Scores
with Food Group and Convenience Food Intakes and Healthy Eating
Scores for each Household
Correlation of Job Satisfaction with food Component Scores
Correlation of Autonomy, Feedback and Environment Satisfaction Scores
with Food Component Scores for each Household
One-Way ANOVA for mean job satisfaction scores and eating patterns
during the week
One-Way ANOVA for mean job satisfaction scores and eating patterns at
the weekend
One-Way ANOVA Time spent food shopping and average nutrition
knowledge and attitude scores
One-Way ANOVA Time spent in food preparation during the week and
average nutrition knowledge and attitude scores
One-Way ANOVA Time spent in food preparation at the weekend and
average nutrition knowledge and attitude scores
One-Way ANOVA Division of responsibility for main food shopping and
mean nutrition knowledge, attitude and cooking confidence scores
Table 6.29 Table 6.30 Table 6.31 Table 6.32 Table 6.33 Table 6.34 Table 6.35 Table 6.36 Table 6.37 Table 6.38 Table 6.39 Table 6.40 Table 6.41 Table 6.42 Table 6.43 Table 6.44 Table 6.45 Table 6.46 Table 6.47 Table 6.48 Table 6.49
One-Way ANOVA Division of responsibility for top up food shopping and
mean nutrition knowledge, attitude and cooking confidence scores
One-Way ANOVA Division of responsibility for food preparation during the
week and mean nutrition knowledge, attitude and cooking confidence
scores
One-Way ANOVA Division of responsibility for food preparation at the
weekend and mean nutrition knowledge, attitude and cooking confidence
scores
Correlation of Scores for Nutrition Knowledge, Attitude and Cooking
Confidence with Food Group Intakes, Convenience Food Intakes and
Healthy Eating Scores.
Correlation of Nutrition Knowledge, Attitude and Cooking Skills with Food
Component Scores
One-Way ANOVA Eating Patterns during the week and nutrition
knowledge, attitude and cooking confidence
One-Way ANOVA Eating Patterns at the weekend and nutrition
knowledge, attitude and cooking confidence
One-Way ANOVA Income and Working Hours
One-Way ANOVA Income and Food Group and Convenience
Consumption and Healthy Eating Scores.
One-Way ANOVA Income and Food Component Scores
One-Way ANOVA Income and Job Satisfaction
One-Way ANOVA Working Hours and Job Satisfaction
One-Way ANOVA Education and Food Group and Convenience
Consumption and Healthy Eating Scores
One-Way ANOVA Education and Food Component Scores
Formal Nutrition Education and Food Group and Convenience
Consumption and Healthy Eating Scores - Independent Samples t-test
Formal Nutrition Education and Food Component Scores - Independent
Samples t-test
Formal Nutrition Education and Nutrition Knowledge, Attitude and Cooking
Confidence Scores - Independent Samples t-test
Paid and Unpaid Help in the Home and Working Hours - Independent
Samples t-test
Paid and Unpaid Help in the Home and Job Satisfaction - Independent
Samples t-test
Paid and Unpaid Help in the Home, Food Group and Convenience
Consumption and Healthy Eating Scores - Independent Samples t-test
Paid and Unpaid Help in the Home and Food Component Scores -
Independent Samples t-test
List of Figures
Figure 1.1 Defining Food Behaviour 1
Figure 2.1 Distribution of Time 11
Figure 2.2 Factors Influencing Food Behaviour-Adapted from Shepherd and Sparks
(1994)
25
Figure 2.3a Herzberg’s Motivation Theory 30
Figure 2.3b Job Enrichment-Adapted from Leopold (2002:121) 30
Figure 2.4 Conceptual Model - Factors Influencing Food Behaviour 32
Figure 2.5 Conceptual Framework 33
Figure 3.1 Dimensions of Work - Identifying Work Variables 34
Figure 3.2 Dimensions of Food Behaviour - Identifying Food Behaviour Variables 35
Figure 3.3 Modelling the Association between Work and Food Behaviour 37
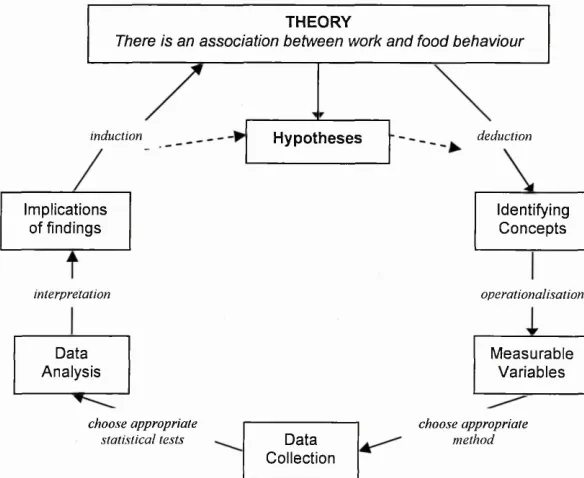
Figure 4.1 The Research Process - from de Vaus (1996:21) 42
Figure 5.1 Distribution of Income 66
Figure 5.2 Average Weekly Hours worked by the Main Food Provider and Other
Adult
69
Figure 5.3 Distribution of Job Satisfaction Totals for Main Food Provider and Other
Adult
71
Figure 5.4 Average time taken to prepare the main family meal 79
Figure 5.5 Frequency Distribution for Food Groups using Food Portion Intakes 90
Figure 5.6 Distribution of Healthy Eating Scores within the Sample 94
Figure 6.1 Research Model 105
Figure 6.2 Model of the Hypothesised Relationships between Work and Food 107,
Behaviour 118,
128,
139
Figure 7.1 Hypothetical model of time use 170
Figure 7.2 Revised conceptual model 172
Chapter 1 - Introduction
1.1 Introduction to Research
1
1.2 Aims and Objectives
3
1.1 Introduction
There is a common perception that family life has been affected by the changing nature o f work,
in particular changes in the workforce and in the time committed to work activities. Within the
context o f family life, it is possible that increased female employment and longer working hours
may have contributed to recent patterns of food behaviour; less food preparation within the
home, increased consumption o f convenience products and fragmented meal times may be
attributed to such changes in work. However, very little research has been done to understand
the nature of the association between work and food behaviour.
As there is no widely acceptable definition o f the term fo o d behaviour it will be defined for the purposes of this research as the set o f actions, relating to all aspects o ffo o d provision and fo o d consumption, which can be modified by an individual’s knowledge, skills and attitudes.
Knowledge Attitude
Skills
FOOD BEHAVIOUR
Food Provision
Food Consumption
[image:21.614.137.487.349.551.2]Eating Patterns
Figure 1.1 Defining Food Behaviour
Increasing female employment and long working hours have contributed to the time fam ine
which many households experience, especially when trying to juggle the demands o f work and
family life (Gershuny 1997, Hochschild 1997, Gershuny & Sullivan 2001, Bunting 2000,
Reeves 2001). In households with children, the experience o f time famine may be even more
acute (Gershuny 2001, Reeves 2001). However, the real cause o f time famine is still unclear
and it is not known whether physical lack o f time, fragmentation o f time, the value placed on
time or a combination of these and other factors are responsible.
Warde (1999:520) has reviewed women's magazines over the past thirty years and found
increasing reference to "speed and ease o f preparation" in recipe features and other food related articles. This may suggest that time, or lack o f it, is the driving force behind these changes. In
support of this, a recent pan-European study, that was conducted to identify the difficulties in
trying to eat healthier, identified lack o f time, irregular working hours and busy lifestyle as the
main barriers to adopting healthier eating habits (Lappalainen et al, 1998). On the other hand, Gofton (1995) argues that although food habits have changed, in particular increased use o f
convenience foods, time saving alone is not the driving force behind these changes. He
suggests that the increasing value and importance o f time generates a greater demand for
convenience products rather than lack o f time itself.
The impact that current patterns of work and time constraints may have on more general
patterns o f food behaviour is unknown. Whilst the debate has focused on issues o f time and
convenience food, little research has been carried out to determine the extent to which the
relative healthiness of the diet is affected. Current health concerns, such as the increasing
prevalence o f obesity, especially in children, has turned the spotlight on food habits and food
consumption. Eating patterns and food choices within the home have an important role to play
in the development of healthy eating habits in later life. In addition, food provisioning activities
in the home, including food shopping, food preparation and cooking, provide opportunities for
practical food knowledge and skills to be gained.
There is a need for empirical data to quantify and model the impact that work may have on food
behaviour. There is also a need to examine the attributes of the individual which may help ease
the burden o f time famine. For example, there is a need to explore how food and nutrition
knowledge, practical cooking skills and attitudes to healthy eating influence food behaviour,
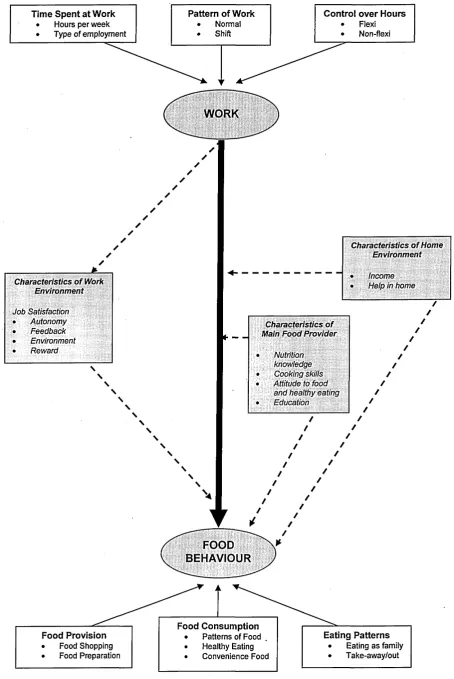
regardless o f time constraints. This research seeks to develop a model using empirical data on
work and food behaviour within the context o f family life. In addition, it aims to identify
mediating factors involved in determining food behaviour, which may or may not be dependent
1.2 Aims and Objectives
The main aim o f this thesis is to determine whether there is an association between work and
food behaviour within the context o f family life. In order to do this three main aims have been
identified. The research aims are as follows:
• To explore the nature of association between work and family food behaviour.
• To determine whether environmental and situational factors of the work and home
environment influence the association between work and food behaviour.
• To determine whether characteristics of the main food provider within the home
influence the association between work and food behaviour.
The concepts o f work and fo o d behaviour are ones that have no widely accepted definition; therefore, they must be defined specifically for the purposes o f this research. In addition, key
confounding variables must be identified, that may intervene or mediate any association
between work and food behaviour. Key confounders will be those relating to the home and
work environment and the characteristics of the main food provider. The research aims have
been broken down into a set of objectives, as follows:
1. To critically evaluate the literature and develop a conceptual framework for the association between work and food behaviour.
2. To develop an operational model identifying variables that describe work and food behaviour. In addition, to identify appropriate confounding variables (as described
above) and incorporate these into the model.
3. To collect empirical data on each of the operational variables, which can then be used to test for association using appropriate statistical analysis.
4. To review the nature o f the association between work and food behaviour, and the possible interaction of confounders, within the context o f the literature.
5. To interpret the findings and develop a hypothetical model that proposes some of the
important decision processes and coping strategies involved in the organisation and
1.3 Chapter Development
The structure of the thesis is based on three main areas: Firstly, exploring the background to the
research and developing a conceptual framework; this stage focuses on defining the concepts o f
work and food behaviour using constructs identified from the literature and incorporating these
into a suitable model. Secondly, the operationalisation of the conceptual framework and
examination o f data. Finally, a review and discussion o f the main results from both quantitative
and qualitative analysis with reference to the literature; ultimately leading to a critique of the
research design and recommendations for future work.
Chapter two concentrates on building definitions for the concepts o f work and food behaviour
and reviews the relevant literature in these areas. A conceptual framework for the research is
developed and dimensions o f work and food, relevant to the research aims, are identified.
Chapter three refines the research objectives by developing a set o f hypotheses to be explored
and presents operational model, developed from the conceptual framework, o f the association
between work and food behaviour.
Chapter four looks at the development o f the methodology and implementation o f the data
collection. Also the approach used for analysis o f data, including the choice o f statistical tests.
Chapter five presents the results from the initial data analysis; a profile o f the study population
in terms o f their work, food behaviour, characteristics o f the main food provider and resources
available within the home.
Chapter six presents the results of the further analysis. Association between the variables
shown on the operational model was explored; each section exploring different hypotheses. An
initial interpretation and summary o f the main results is given at the end o f each section.
Chapter seven summarises o f results of the quantitative analysis and critically discusses these
with reference to the qualitative results and literature. Limitations o f the methodology and
conceptual framework are discussed and a revised conceptual model is presented.
Chapter eight discusses the implications and presents the recommendations for future work.
Chapter 2 - Literature Review
2.1 Work - The Impact on Family Life
5
2.1.1 Female Employment 6
2.1.1.1 Barriers to Female Employment 7
2.1.2 Time Spent at Work 8
2.1.2.1 Working Hours 8
2.1.2.2 Working Time Directive 9
2.1.2.3 Gender and Working Hours 9
2.1.2.4 Part Time Work 10
2.1.3 Work and Family: Redistributing Time and Responsibility 10
2.1.4 Perspectives on Time 12
2.1.4.1 Busy Lifestyle - "24/7" Society 12
2.1.4.2 Lack of Time - "Time Famine" 13
2.1.5 Role Overload - Work Related Stress 13
2.1.5.1 'Wonder Woman" and "Super-Wife" 14
2.1.5.2 Job Satisfaction 15
2.2 Food Behaviour - Current Trends and Consequences
16
2.2.1 Food Provision: food shopping 17
2.2.2 Food Provision: food preparation 18
2.2.3 Convenience Food 18
2.2.4 Eating Habits 19
2.2.5 General Patterns in Food Consumption 19
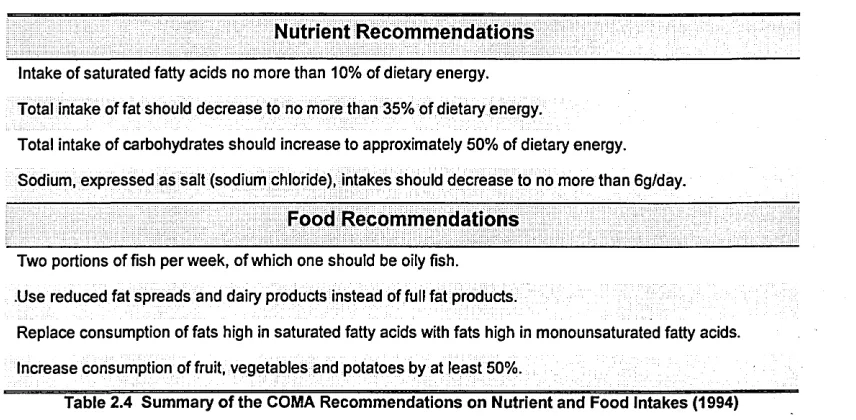
2.2.5.1 Recommendations for Healthy Food Consumption Patterns 20
2.2.52 The National Food Survey 21
2.3 Developing a Conceptual Framework for Work and Food
25
Behaviour
2.3.1 Determinants of Food Behaviour 25
2.3.2 Characteristics of the Environment 26
2.3.2.1 Work - Time Factors 26
2.3.2.2 Work Patterns and Supportive Environment 28
2.3.2.3 Support in the Home 28
2.3.2.4 Income 29
2.3.3 Characteristics of the Individual 29
2.3.3.1 Education 29
2.3.3.2 Job Satisfaction 30
2.3.3.3 Nutrition Knowledge 31
2.3.3.4 Cooking Skills 31
2.3.3.5 Attitudes to Food and Nutrition 32
2.1 Work - The Impact on Family Life
"Despite widespread acceptance o f the notion that work affects fam ily functioning, an understanding o fju st how work affects the fam ily is lacking" Barling (1995:18).
To understand the association between work and family food behaviour it is important to
consider the nature o f work and its general impact on family life. It is also necessary to
establish how work has changed over recent years and what impact these changes have had on
the organisation and management o f family life.
The social significance o f work is immense and can have a major influence on an individual's
quality o f life - "How long you live, whom you marry or live with, how much money you have, where you live and how children fare are all affected by work" (Abercrombie & Warde,
1996:65). Undoubtedly, the single biggest change that has occurred in the workforce over the
last fifty years has been the rise in female employment. Work has had both positive and
negative effects on women's quality o f life. Increased autonomy, self esteem, physical and
psychological well-being as well as the fulfilment of career aspirations are just some o f the
positive outcomes resulting from women's experience of work (Barling 1995, Rout et al 1997, White et al 1997). On the other hand women's traditional role as a wife and mother can sometimes be in conflict with work commitments; "the prevalence o f married women in the labour market undermines the traditional gender division o f labour, whereby men are responsible fo r the public sphere o f paid work and women are confined to the private sphere o f home life" (Scott, 1999:144). O f course this conflict is not only experienced by married women; the changing composition of the modem nuclear family, to include cohabiting and
single parent households, means that the nature o f any conflict that is experienced between work
and family has also altered.
As more women enter the workforce, the balance between work and family life has become the
focus of much academic and popular interest. Women's traditional role as a mother and
homemaker has been challenged by the increase in female employment (Newell 1996, Scott
1999). Family responsibilities for working women have not diminished but they must be
managed in addition to work commitments; "with more women moving into pa id employment, and their domestic work time not falling commensurately, there is inevitably an overall increase
in women's workloads" (Sullivan & Gershuny, 2000:9) The success with which this is achieved depends on a number o f factors; support within the home, time management, coping strategies,
role expectations and a family friendly work environment can all contribute to work life
balance. If balance is not achieved then role overload, increased time pressures and stress may
be the result.
These issues will be expanded and explored throughout this section focusing in particular on
gender division within the workplace and at home. The conflict and balance between the two
domains will also be examined with particular reference to the social and self-imposed
expectations of women's role as mother and employee. In addition, the development o f coping
strategies and support systems will be addressed.
2.1.1 Female Employment
Female involvement in the workforce has steadily increased since the Second World War
(Abercrombie & Warde, 1996). The workforce can be divided into three groups; those in paid
employment, the unemployed who are looking for paid work and unable to find it, and finally
those are neither in paid work nor looking for it, such as voluntary workers. Across all three
groups, female participation within the labour market has increased (Butcher & Hutchinson,
1996). However, for the purposes o f this research the workforce will only be considered in
terms of those in paid employment.
The trends in employment for different groups within the female population are shown in Table
2.1. The largest increase in employment has occurred for married/cohabiting and single women
with children. It has been suggested that more flexible working patterns, job sharing, term time
work and part time work, offer a more supportive working environment that encourages and
aids their participation within the workforce (Bevan, et al, 1999).
Despite increases in female employment, women are still disadvantaged in the workplace
compared to men. Occupational segregation exists between the sexes; women are more likely
to be employed in low grade jobs and in different occupations to men (Abercrombie & Warde,
2000:201-202). In addition to this gender segregation, women are divided by age and
educational status within the workforce; younger and highly educated women are more likely to
be in professional and managerial occupations whilst part-time and less skilled occupations are
carried out by older and women with fewer educational qualifications (Abercrombie & Warde,
Employment Rates (%)
Spring 1997 Spring 2000
All women aged 16-59
All married/cohabiting
Married/cohabiting without children
Married/cohabiting with children
All single
Single without children
Single with children
Table 2.1 Trends in Female Employment
67.5 68.9
71.0 73.0
74.7 76.2
67.7 70.1
60.3 61.7
65.2 66.8
43.4 48.6
Adapted from Spring 2000 Labour Force Survey
2.1.1.1 Barriers to Female Employment
According to a government study - Trends in Female Employment (2000) - the increase in
employment is unevenly distributed amongst female employees, especially those with
dependent children. In particular, the age o f the children influences the level of participation
within the workforce, with lower levels o f employment being found in those with children less
than five years old. Participation is even lower still in lone mothers who have children within
this age range. Whilst practical barriers to employment, such as lack o f affordable and flexible
childcare arrangements, have lessened to a certain extent, they are still a problem for many who
wish to return to work (Bower, 2000).
Recent Government initiatives such as the New Deal for Lone Parents, Working Families Tax
Credit and the National Childcare Strategy are aimed at supporting mothers who wish to work.
However, this level o f support is not always mirrored within organisations. The need to create a
supportive and "family friendly" working environment, that allows employees to reconcile work
and family responsibilities has been highlighted by the European Union (EU) (Moss, 1996).
The European Commission’s White Paper on European Social Policy (1994) has suggested that
there is an urgent need, in the interests of society as a whole, for working life and family life to
be mutually reinforcing.
Research that has focused on women's experience o f work has found that women are still
disadvantaged in terms o f career advancement. The underlying acceptance and adoption o f
traditional male models of career development may hinder women within the workplace; both in
terms of career advancement and role conflict (Mavin, 2000 & 2001). In a review o f women
managers, White et al (1997) found that role conflict was managed through the adoption of coping strategies such as careful planning and redistributing household responsibilities.
However, some women did not report role conflict and said that work took priority over other
areas of their life, including family; a view that is synonymous with a more male orientated
attitude towards work (Scott, 1999).
2.1.2 Time Spent at Work
Cooper (1999:569) states that work in the 1990s is epitomised by "the long working hours culture". Increasing working hours and part-time employment have led to a decline in the traditional “nine-to-five” pattern o f working (ONS, 1998b, 1999). Whilst these trends may
seem contradictory they can be explained by the different groups o f workers in which they are
observed. Total working hours have increased for all full time employees and part time hours
have increased for women. These trends, in addition to an overall decrease in unemployment,
have led to an increase in the amount of time being spent at work across the population as a
whole (Abercrombie & Warde, 1996); particularly in groups that previously had little
involvement in the workplace.
2.1.2.1 Working Hours
UK employees work the longest hours in Europe (ONS, 1999). The average number o f hours
for a European employee is 40 hours whilst the average number o f hours worked per week in
the UK has steadily risen from 42.6 hours in 1984 to 44 hours in 1998 (ONS, 1999). In addition
a quarter o f all full time employees within the UK work more than 48 hours per week, which far
exceeds that o f European workers (ONS, 1999).
The time spent at work can be measured in terms o f contract hours and work done outside these
hours. According to Kodz et al (1998) a high proportion o f UK employees work more than 10 hours in excess o f their contracted hours. Some o f the reasons for working such long hours
include pressure o f workload, individual commitment towards work, long hours culture within
the organisation and a need to improve take-home pay. The cost to the individual can include
increased stress, ill health, an adverse impact on personal and family relationships, not to
mention reduced employment opportunities for those who are unable or unwilling to work
longer hours (Schabracq & Cooper 2000, Savery & Luks 2000).
Few studies have directly investigated the effect o f long working hours and their impact on
family life. Now the average family is a working family, where both partners work, there may
be a link between long hours and the breakdown of the family; there is a need for research to
"see what these hours are doing directly to families and to the development o f children - yet imcharted territory" Cooper (1999:570).
2.1.2.2 Working Time Directive
The Working Time Directive became law in the UK on 1 October 1998. It was introduced to
combat the long hours experienced by many workers (European Commission, 1998).
The main requirements include;
• a maximum 48 hour working week, over a rolling 17 week period
• at least one 24 hour break per week
• daily rest periods o f 11 hours
• three weeks guaranteed holiday
• additional protection for night workers
Although the directive is now law in this country, individuals can opt out o f the 48 hour limit if
they make an agreement with their employer.
In their research looking at the implementation o f the Working Time Directive, Kodz et al
(1998) have identified two main types o f intervention to tackle long working hours and the
culture of long hours; first, changing work patterns by introducing more flexibility; second,
changing company culture to increase awareness of the issues involved, including providing
support and training for individuals.
The Working Time Directive may aid the adoption of more family friendly practices within
organisations. However, due to the opt out clause, which only applies in the UK, some feel the
directive is all but redundant; including an opt out option is a missed opportunity to improve the
working lives o f millions of people in the UK Bewick (2001).
2.1.2.3 Gender and Working Hours
Although long working hours are an issue for many UK employees only 7% o f women in
employment work longer than 48 hours per week (ONS, 1999). This inequality can be partially
explained by the greater number o f part time hours worked by women (ONS, 1998b). Very
often women are unable to work longer hours due to family and household responsibilities,
which still fall predominantly on women’s shoulders (Court, 1995). Equal opportunities are
undoubtedly legally available for women to enter most occupations but some would argue that
there is still discrimination evident in the rate at which the sexes progress in their chosen
profession (Mavin, 2001). Shorter hours may be seen as a sign o f lack o f commitment by
employers and reduce opportunities for promotion (Kodz, et al, 1999).
However, it is important to emphasise that not all women want to work longer hours. Many are
happy working fewer hours and would welcome the opportunity to have more flexibility and
control over the hours they work; especially if it means achieving a better balance between work
and family life (Bower, 2000). Recent research shows that up to 40% o f full time working
women would prefer to work fewer hours, while less than 10% would prefer to increase their
working hours (Boheim & Taylor, 2001).
2.1.2.4 Part Time Work
Part time employment, which has increased since the 1980s, was initially viewed as a means of
reducing unemployment (Smith et al, 1998). However, this has not been the case and rather than unemployment rates falling due to the availability o f part time work, the overall
employment rate has increased due to the greater involvement of women in the labour market.
In every EU country the rates for women’s part time employment exceed those for men but as
Smith et al (1998) observe this cannot be explained simply in terms o f women’s working time preferences. Many women would appreciate the opportunity to work full time hours, not only
because of the financial benefits, but because of fulfilling career aspirations and enhanced
autonomy (Doyal, 1994).
Unfortunately, for working women with family responsibilities, full time employment is not
always an option mainly because o f inadequate childcare provision. This was identified as a
priority in the governments 1997 pre-budget report that states that it is a priority to develop “a national childcare strategy to enable more parents to be available fo r work fo r longer periods o f the day”. However, even with these opportunities available, women are still more likely than men to work part time out o f choice (Boheim & Taylor, 2001). According to Fagan & O'Reilly
(1998:22) implicit "gender compromise", resulting from the traditional roles o f men and women, drives women into part time employment; this allows compromise between the rise in
female employment and the disproportionate division of household labour.
2.1.3 Work and Family: Redistributing Time and Responsibility
Time use can be considered in
terms of its allocation to work
and non-work activities but this
does not differentiate between
the ways in which time is used
outside work. Non-work time
encompasses essential activities
such as caring duties _ and
domestic responsibilities and
real free time to be spent in
leisure pursuits. Therefore, a Figure 2.1 Distribution of Time
more helpful definition would
be to describe "work" as paid work, "leisure" as ffep time and "essential" activities as family and
caring responsibilities. On this basis, time use can be divided into five domains - Figure 2.1.
The distribution and organisation of time within each o f these domains is dependent on many
factors; work commitments, family responsibilities, caring duties, participation in leisure
pursuits, money and the availability of resources are just some of the factors involved. Gender
division of time use can be partly explained by differences in employment status and unequal
distribution of household and domestic responsibilities (Gershuny et al, 1994). In general, men are more likely to be in full time employment and work longer hours than women, as previously
discussed, although the gap is starting to close. The real discrepancy between the sexes, is the
amount of time spent in household chores; women in both full time and part time employment
allocate more time than men (Gregson & Lowe 1994, Doucet 1995, Schindler-Zimmerman &
Addison 1997, Gershuny & Sullivan 2000). Table 2.2 shows typical use o f time in an average
week by employment status and gender.
Full Time Part Time
Weekly time spent on: Male Female Female Housewives Retired
• Employment & travel3 4 8 .3 /7 /5 4 2 .6 /7 /5 2 0 .9 /7 /5 0 .3 /7 /5 O J / 7/5
• Essential activitiesb 2 4 .1 3 9 .6 5 2 .1 5 8 .4 3 3 . 0
• Sleep0 4 9 .0 4 9 .0 4 9 .0 4 9 .0 4 9 . 0
• Free time 4 6 .6 3 6 .8 4 6 . 0 6 0 .3 8 5 .3
Free time / weekday 4 .5 3 .3 5 .4 8 .4 1 1 .6
Free time / weekend 1 2.1 1 0 .3 9 .5 9 .3 1 3 .6
Table 2.2 Time use in a typical week, by employment status and gender, GB 1995 (Abercrombie & Warde, 1996)
“Travel to and from place o f work.
bEssential domestic work and personal care, including essential shopping, child-care, cooking, personal hygiene and appearance. cAn average o f 7 hours sleep per night is assumed.
Sleep
Work Leisure
TIM E U SE
E ssen tial
A ctivities PersonalNeeds
With the increase in female employment, domestic duties have to be combined with paid
employment. Despite women working longer hours outside the home they are still responsible
for the majority o f household labour (Gershuny & Sullivan, 2000). The allocation o f time for
essential household activities, such as cleaning, washing, food preparation and cooking has had
to be redistributed to take into account working hours. The redistribution and reorganisation of
time has occurred in four ways:
• Less time is spent in household duties.
• Greater fragmentation in the time spent in household chores.
• Household duties being shared more equally between men and women.
• Greater use is made o f time saving products and services.
2.1.4 Perspectives on Time
In previous sections the increase in female employment and amount o f time committed to work
have been considered in addition to the redistribution and management o f household
responsibility. If time use is considered in terms o f households or family units, then there has
undoubtedly been an increase in the total amount o f time committed to work and a change in the
nature o f time use; directly related to the increase in female employment. Several perspectives
have developed on the impact that time and time use has on the individual and family; these
have been the focus o f much academic and popular literature.
2.1.4.1 Busy Lifestyle - "24/7" Society
The pace of life has accelerated in recent years and the term "24/7" (referring to 24 hours 7 days
a week) has become synonymous with busy lifestyle and increased demands on time, "the accelerated pace o f daily life - and resultant stress or sense o f being rushed, can be p u t down to people's new appetite fo r consumption, s e lf expression and entertainment" (Peters 2000). An
increase in anti-social patterns of work may result from the demands o f a 24/7 society, as
employees are forced to work whatever hours are demanded o f them (Summerskill, 2000). In
this case it is not only increased working hours that impact on time distribution within the
household but also the timing of working hours. Gershuny and Sullivan (2000:21-22) have identified "changingpatterns o f time-use" and the "sequencing o f time-use" as important factors in the development o f time related pressures. Individual's and families must adopt time saving
strategies taking into account the needs and schedules family members. The success with which
they can do this will depend on their ability to cope, with both the demands on time and the
2.1.4.2 Lack of Time - "Time Famine"
The experience o f not having enough time, feeling rushed and pressured is a widely reported
phenomenon in both popular and academic literature. The terms "time fam ine", "time bind" and
"time squeeze" have been adopted to describe this lack o f time, commonly attributed to the pressures o f modem day living (Gofiton 1995, Hochschild 1997, Gershuny & Sullivan 2000).
Although little empirical research has been carried out to quantify the experience o f time
famine, it is commonly associated with increased levels o f stress and behavioural changes, as
people either cope with or succumb to the time squeeze.
In households where two parents work full time famine is becoming more common as women
juggle work, childcare and household responsibilities (Cooper, 1999). The "work rich but time poor" experience of working families has been cited as one of the main causes o f role overload
and increased stress; most commonly in women but more frequently experienced by men
(Gofton 1995, Rout et al 1997, Hochschild 1997). Although the contribution that men make to
household responsibilities has increased - from 15 minutes per day in 1961 to 45 minutes in
1995 (Gershuny, 1997); also see Table 2.2 - Hochschild (1997) suggests that women workers
still bear the brunt o f these time pressures; "any increase in men's domestic work time has been negligible, both over time and in response to their partner's employment status" (Gershuny & Sullivan, 2000:9).
2.1.5 Role Overload: Work Related Stress
Stress is 'described as the circumstances under which "the pressures experienced exceed the individual's ability to cope" Arnold et al (1998:422). Managing work and family responsibility can lead to increased stress in individual's who do not have effective strategies in place to cope
with these pressures. The ability to cope describes the "behavioural strategies that individuals use to manage stressful situations" (Strobe & Jonas, 2001:545).
Stress symptoms can manifest themselves in number of physical and behavioural outcomes and
in more severe cases can contribute to the aetiology o f serious health conditions. Whilst the
symptoms associated with stress can often be readily identified, the underlying cause can be
more difficult to locate and is often related to a combination of factors. As individuals have
different thresholds for the amount o f pressure that they can cope with before experiencing stress
symptoms, the pressure threshold and their ability to cope will determine the severity o f the symptoms experienced.
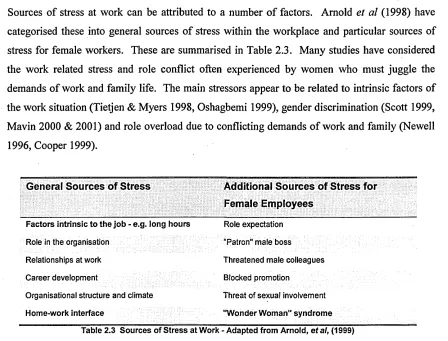
Sources o f stress at work can be attributed to a number o f factors. Arnold et al (1998) have categorised these into general sources of stress within the workplace and particular sources of
stress for female workers. These are summarised in Table 2.3. Many studies have considered
the work related stress and role conflict often experienced by women who must juggle the
demands o f work and family life. The main stressors appear to be related to intrinsic factors o f
the work situation (Tietjen & Myers 1998, Oshagbemi 1999), gender discrimination (Scott 1999,
Mavin 2000 & 2001) and role overload due to conflicting demands o f work and family (Newell
1996, Cooper 1999).
General Sources of Stress Additional Sources of Stress for Female Employees
Factors intrinsic to the job > e.g. long hours
Role in the organisation
Relationships at work
Career development
Organisational structure and climate
Home-work interface
Role expectation
"Patron" male boss
Threatened male colleagues
Blocked promotion
Threat of sexual involvement
"Wonder Woman" syndrome
Table 2.3 Sources of Stress at Work - Adapted from Arnold, ef al, (1999)
2.1.5.1 " Wonder Woman" and "Super-Wife'
As dual career families become more common, stress resulting from juggling work and home
commitments has also increased; as discussed in previous sections. The "Wonder Woman"
syndrome refers to the pressures working women may experience if they have family and
household responsibilities in addition to their work commitments (Arnold et al, 1999). The myth of the "Super-Wife" - a woman who takes the conflicting demands of wife, mother and work all in her stride - has been linked with exhaustion and stress and increased feelings o f guilt
(Summerskill, 2001); also identified by White et al (1997:33) as an "energy deficit" between work and family. Newell (1996) suggests that it is here that employers and organisations can
step in to ease the burden and pressure on working women; adequate childcare provision and
family friendly policies may play an important role. In addition, Barling (1995:18) suggests
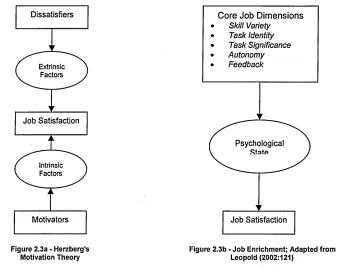
that "the quality o f the employment experience, and not the employment status nor the quantity o f employment, is critical to understanding the effects o f work on family". The employment experience may be explained in terms o f job quality or work related stress; one o f the main
indicators o f these is job satisfaction which can be considered in terms o f intrinsic and extrinsic
[image:36.613.80.528.28.369.2]2.1.5.2 Job Satisfaction
When considering the overall benefits o f waged employment, the nature o f the job and domestic
circumstances have been identified as limiting factors, especially for female workers Doyal
(1994). General work stressors have been identified above but it has also been suggested that
particular job characteristics and job quality have more influence on stress (Ginn & Sandell
1997, Tietjen & Myers 1998, Burke 2001); "research on jo b characteristics shows considerable variance in the ways in which people experience their work, and that the differences are predictive o f psychological well-being" (Barling, 1995). However, it must be noted that some
studies have attributed the higher levels o f stress experienced by female empl