Abstract— Welding is a process which helps to join metals by adding metals between weldments by diffusion process.. One of the process by which metals are joined by creating friction on metals. It is called solid state welding. A rotating hard cylindrical pin is pressed on metals to be welded by friction. In FSW, there are only three process variables to control: rotation speed, travel speed and pressure, all of which are easily controllable. Four rotational speeds were used keeping the feed rate constant. The plunge depth is related directly to the pressure was varied depend on the work material. Analysis was carried by measuring surface roughness (RA), tensile,
micro hardness and metallographic tests. At rotational speed of 1925 RPM, aluminum to aluminum welding had given ultimate tensile strength up to 86 percent. Copper to copper joint process resulted that at rotational speed of 2275 RPM is the best result. Tensile value of 74 % was obtained compared to copper base material. The surface roughness Ra value low compared to copper base metal. The Vickers hardness value was high compared to base metal. Aluminum to copper metal joint the best resulted at 2275 RPM. The result was the lowest compared to similar metal joints. The value of 427 MPa of ultimate tensile strength (UTS) was archived. The metallographic test showed that a crack occurred at the bottom of welding joint. The hardness test showed that the hardness at the joint increased drastically. At high rotational speed of 2975, low surface roughness was obtained in all the weldments at low feed rate and low plunge depth.
Index Terms—Solid state, FSW, Ultimate Tensile strength, Micro-hardness
I. INTRODUCTION
riction Stir Welding (FSW) is a relatively new state of the art solid state welding process. The metal joining techniques is derived from the conventional friction. In FSW, a non-consumable rotating tool with a specially designed pin and shoulder is inserted into the abutting edges of sheets or plates to be joined and traversed along the line of joint. Frictional heat is generated by contact friction between the tool and work material which softens the material. The plasticized work material is stirred by the tool and forced to flow to the side and back of the tool as the tool advances [1]. Friction stir welding (FSW) was invented
Dr .Sivaprakasam Thamizhmanii ([email protected]) is working as Senior Lecturer.
Mr. Mohd Azizee Sukor was a student at Universiti Tun Hussein Onn Malaysia.
Dr. Prof. Sulaiman ([email protected]) as Professor of Faculty of Mechanical and Manufacturing Engineering. All the authors are represented by Universiti Tun Hussein Onn Malaysia, 86400, Parit Raja, Batu Pahat, Johor, Malaysia.
at The Welding Institute (TWI) of UK in 1991 as a solid-state joining technique, and it was initially applied to aluminum alloys [2-3]. The basic concept of FSW is remarkably simple. The principle application FSW is shown in the Fig.1 The tool serves two primary functions: (a) heating of work piece, and (b) movement of material to produce the joint. As the temperature cools down, a solid continuous joint between the two plates is then formed. FSW yields fine microstructures, absence of cracking, low residual distortion and no loss of alloying elements that are the main advantages of this solid phase process. Tang et al. [4] presented experimentally measured temperature distributions of the work materials in FSW. Gang and Feng [5] proposed simple heat transfer model for predicting the temperature distribution in the work piece. Chao and Qi [6-7] developed a moving heat source model in a finite element analysis and simulated the transient temperature, residual stress and residual distribution of the FSW. FSW process can be applied to joining other alloy materials such as steels, aluminum, titanium etc. It is well known that current tool materials used in the FSW for aluminums are not adequate for production applications. FSW is at presently entering into initial stages of commercialization and the research has mainly been considered in the area of process development, including tool design and process control [8]. It is well understood that the effect of some important parameters such as rotational speed and welding speed on the weld properties is the major topics for researchers. In all the above cases, FSW parameters are selected by trial and error to fix the major topics for researchers [9]. Lakshminarayanan, et al. [10] conducted study on AA2219 aluminum alloy at spindle rotation of 500−1600 RPM and frictional speed of 0.37−2.25 mm per sec. They found that defect free FSW on AA2219 metals produced under a wide range of rotational speeds and welding speeds.
Fig.1. Working principle of FSW [14].
Solid State Friction Stir Welding (FSW) on
Similar and Dissimilar Metals
Sivaprakasam Thamizhmanii,Mohd Azizee Sukor, and Sulaiman
Fig.2.Different regions of FSW: (a).unaffected zone,(b).Heat Affected Zone (HAZ) (c). Thermo-Mechanically Affected Zone (TMAZ), and (d). Friction Stir Processed (FSP) [12-13].
Yang Yong et al.[11] conducted study on dissimilar metals such as 5052 aluminum alloy and AZ 31 magnesium alloy. They found that sound weld was obtained at rotational speed of 600 RPM with welding speed of 40 mm/min. The microstructure of the stir zone is greatly refined. Elangovan and Balasubramaniam [12] conducted study on 2219 aluminum alloy material by FSW process. They have used five different tool pin profiles – straight, cylindrical, threaded cylindrical, triangular and square with three welding speeds. Square pin profiled tool produced defect free Friction Stir Processed (FSP) irrespective of welding speeds. Of the three welding speeds used to fabricate the joints, the joints fabricated at a welding speed of 0.76 mm per seconds showed superior tensile properties, irrespective of tool pin profiles. FSW joints usually consist of four different regions as shown in Fig. 2. They are: (a) unaffected base metal (b) heat affected zone (HAZ) (c) thermo-mechanically affected zone (TMAZ) and (d) friction stir processed (FSP) zone. The formations of above regions are affected by the material flow behavior under the action of rotating non-consumable tool. However, the material flow behavior is predominantly influenced by the FSW tool profiles, FSW tool dimensions and FSW process parameters (13].
II. EXPERIMETALPROCEDURES
Commercially available Aluminium alloy 6061-T6 and copper C12200 having 100 mm in length, 75 mm in width and 1 mm in thickness was used. The metal plates were butt welded and stir them together with a rotating straight cylindrical tool. The tool used is plain cylindrical hard worn end milling cutter. The operating parameters for the FSW are given in the Table 1. A welding fixture for this FSW is shown in the Fig.2. The material to be welded by FSW was clamped on a Mild Steel back plate. The tool was arranged to rotate in the clock wise direction and work piece was moved opposite direction which is called as advancing side. The macrostructure and, consequently, the mechanical properties of the Stirred Zone is mainly governed by the retreating side material, the dissimilar weld was produced with copper C12200 (higher strength) positioned on the retreating side and aluminium alloy 6061-T6 on the
to be tested on the tensile test. Four tensile specimens were machined from the central part of the joint according to ASTM E8M-01 [15] subsize standard for sheet type material (gauge length 25 mm, width 6 mm, and overall length 100 mm). All samples were produced with minimal defects and conformed to specified dimensions with a tolerance of 0.1mm. None of the tensile samples were flat machined in order to smooth the surface or to make the cross-section area constant along the gauge length. The specimens were tested at room temperature using a 10 KN Servopulser Series Servo-hydraulic Testing Machines with front-opening hydraulic grips. The cross head speed is fixed at 30 mm/min. Table 2 shows the dimensions of the test specimen as per ASTM [15].
TABLE 1
OPERATING PARAMETERS
Weld Parameter Parameter Value
Tool tilt angle 0.0°
Tool axis position and joint-line relative to dimensional origin (exit position)
y = 0.0mm (nominal)
Start position from dimensional origin (exit position)
x = 130mm
Tool rotation speed 1925, 2275, 2625 & 2975 RPM
Plunge feed rate ~5s
Plunge Depth (Depth of tool) 0.2mm (Aluminium to aluminium)
0.5mm (Copper to copper) 0.4mm (Aluminium to copper)
Welding speed 100 mm/min constant traverse
End dwell time (from traverse stop to the start of tool extraction)
~5s
End position x = 20mm
TABLE 2
TEST SPECIMEN DIMENSION IN MM [15]
Nominal Width Subsize Specimen
G— Gage length 25± 0.1
W— Width 6± 0.1
T— Thickness thickness of material
R— Radius of fillet, min 6
L— Overall length 100
A— Length of reduced section, min 32
B— Length of grip section 30
C— Width of grip section, approximate 10
[image:2.595.306.541.467.743.2]Fig.3. Test specimen as per ASTM [15].
Samples for microstructural investigations were cut from the base material and FSW zones. The metallographic samples were then mounted using cold mounted tecnique and prepared using silica carbide sand paper grade 240,320,400,600 and 1000 and polished with diamond paste on a microcloth. The Aluminium side were chemically etched with Keller’s reagent and the copper side were etched with premix containing of 100 ml of water, 4 ml of saturated sodium chloride, 2 g of potassium dichromate, and 5ml of sulfuric acid. FSW butt joint, 50 mm at the beginning and 20 mm at the end were removed to exclude possible unstable welding. The macrostructure and microstructure were examined using an Olympus BX60M optical microscope. Fig. 4 shows the microstructure measured at various points. The roughness was measured on the weld bead by using Mitutoyo SJ-400 surface roughness tester. Micro-hardness test was measured using a HMV Shimadzu microhardness tester. A load range of 100 grams-force employed with loading time of 10 seconds. The Vickers hardness measurements were calculated using standard. Fig.6 shows the joining of welded portion and welded samples for roughness measurement.
Fig.4. Micro hardness test position.
Fig.5. Welding layout.
Fig.6. Welded sample used for roughness.
III. RESULSTANDDISCUSSION A. Surface Roughness
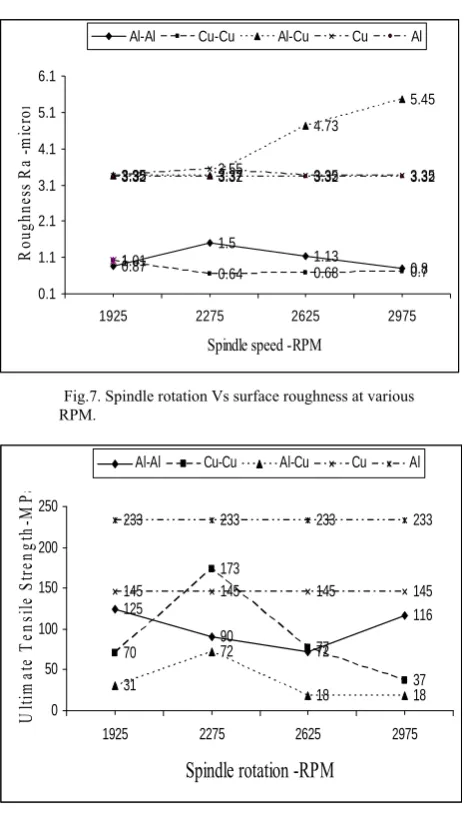
Fig.7. Spindle rotation Vs surface roughness at various RPM.
Fig.8. Spindle rotation Vs ultimate tensile strength (UTS) at various RPM.
At 2975 rotational speed of the tool with plunge depth of 0.50 mm produced low surface roughness which is 700 microns. The variation between Al to Al and Copper to Copper was very narrow.
B. Ultimate Tensile Strength (UTS)
[image:4.595.51.284.66.251.2]The ultimate tensile strength (UTS) is a measure of maximum load at which the materials begin to deform plastically. Aluminum to aluminum joints, the UTS at rotational speed of 1925 RPM was high which was 86.3% and 2625 RPM was low which was low by 50%. Aluminum to copper and copper to copper combination revealed that at speed of 2275 RPM was high and 2975 RPM was low. The UTS values for copper to copper joint compared with base material are 74% and 16% respectively. Fig.8 shows UTS at various operating parameters.
Fig.9. Fracture strength at various parameters.
C. Fracture Strength
All the sample were tested for fracture strength and was lower than ultimate tensile strength for aluminum to copper and copper to copper at speed 1925 RPM and the results approximately same. Fig. 9 shows uniform elongation of aluminum to aluminum joint. But the difference between uniform elongation and elongation at break point for aluminum to aluminum was low compared to base metal. Copper to copper and aluminum to copper joint, the entire samples showed narrow gap. The uniform elongation is lower than base metal. Uniform elongation, Elu is the elongation determined at the maximum force sustained by the test piece just prior to necking or fracture, or both atkes place [15].
D. Micro Hardness- Aluminum to Aluminum
Fig. 10, 11 and 12 show micro section for the test conducted at various rotational speeds for Al to Al, Al to Cu and Cu – Cu. At rotational speed of 2625 RPM high hardness was at 0.5mm from weld centre which is at the advancing side. Hardness is stable through entire points. At speed of 2275 RPM and 2975 RPM high value was measured at 2.5mm from weld centre which is at the advancing side. Only at speed of 1925 RPM the hardness at welding region is low than base metal hardness. Fig.10 show the micro-hardness obtained for aluminum. The micro hardness obtained for Al to Al is shown in the Fig. 13 for various rotational speed.
(a) 1925 RPM (b) 2275 RPM 0.87
1.5
1.13
0.8 1.01
0.64 0.68 0.7
3.35 3.37
4.73
5.45
3.35 3.55 3.35 3.35
1
3.32 3.32 3.32 3.32
0.1 1.1 2.1 3.1 4.1 5.1 6.1
1925 2275 2625 2975
Spindle speed -RPM
R ou ghne ss R a -m ic ro n
Al-Al Cu-Cu Al-Cu Cu Al
125 90 72 116 70 173 77 37 31 72 18 18 145 145 145 145 233 233 233 233
0 50 100 150 200 250
1925 2275 2625 2975
Spindle rotation -RPM
U ltim at e T en sil e S tr en gth -M Pa
Al-Al Cu-Cu Al-Cu Cu Al
112 75 69 105 69 158 56 36 31 58 14 15 113 113 113 113 208 208 208 208
0 50 100 150 200 250
1925 2275 2625 2975
Spindle rotation - RPM
Fr ac tu re s tr engt h -M Pa
[image:4.595.305.544.611.709.2]
(c) 2625 RPM (d) 2975 RPM Fig.10. Micro-cross section of samples Al-Al
(a) 1925 RPM (b) 2275 RPM
(c) 2625 RPM (d) 2975 RPM Fig.11.Micro- section of aluminum to copper
E. Copper to copper
Copper to copper joint present that the hardness was stable at retreating side and slightly erratic at the advancing side. The copper to copper is more linear compared to aluminum to aluminum and aluminum to copper joint for rotational speed of 1925 RPM, 2625 RPM and 2975 RPM. Maximum hardness value was below the base metal hardness. At rotational speed of 2275 RPM which was the good combination during the tensile and metallographic test which exposes that the hardness value was slightly higher compare to base metal.
(a) 1926 RPM (b) 2275 RPM
(c) 2675 RPM
Fig.12. Micro section of copper to copper
F. Aluminum to Copper
Dissimilar joint between aluminum to copper has revealed same pattern for all rotational speeds. The hardness was low at advancing side which is aluminum side. The hardness values then continued to increase from 3.5mm to 2.5mm from weld centre on the aluminum side. The hardness value was on par with the hardness of copper base metal. The increase shows that the two materials were blended to each other.
IV CONCLUSION
The FSW welding for different metals was successfully carried out and the conclusions were drawn accordingly: 01. In all the test that was carried on aluminum to aluminum, the best parameter was at speed 1925 RPM. Tensile test result showed that it reached value of 86.3% of the UTS compared to aluminum base metal.
02. Copper to copper joint process result proved at rotational speed of 2275 RPM is the best parameter for FSW and 74% was reached compared to copper base material. There was no defect on the welding zone in all the experimental work. The surface roughness Ra was low compared to copper base metal. The Vickers hardness value was high compared to base metal in cu to cu.
03. Aluminum to copper joint the best result was 2275 RPM. The UTS value of 427 MPa was low compared to similar metal joints. The metallographic test shows that crack occurred at the bottom of welding joint at the end of tests. The hardness test showed that the hardness at joint was increased drastically.
ACKNOWLEDGMENT
The authors would like thank Ministry of Higher Education Malaysia for providing financial support through short research grant Vot. 0778.
REFERENCES
[1] W.M. Thomas, E.D. Nicholas, J.C. Needham, M.G. Murch, P. Templesmith, C.J. Dawes, G.B. Patent Application, 1991 No. 9125978.8.
[2]C. Dawes, W. Thomas, TWI Bulletin 6, November/December 1995, p. 124.
[3] X.K.Zhu and Y.J.Chao, Numerical simulation of transient temperature and residual stress in friction stir welding of 304 L stainless steel, Journal of Materials Processing Technology, 2004, 146, , 263-272. [4] W. Tang, X. Guo, J.C. McClure, L.E. Murr, A. Nunes, Heat input and
temperature distribution in friction stir welding, J. Mater. Process. Manuf. Sci. 1998, 7, 163–172.
[5] Gould, Z. Feng, Heat flow model for friction stir welding of aluminum alloys, J. Mater. Process. Manuf. Sci. 1998, 7, 185–194. [6] Y.J. Chao, X. Qi, Thermal and thermo-mechanical modeling of friction stir welding of aluminum alloy 6061-T6, J. Mater. Process. Manuf. Sci. 1998, 7, 215–233.
[7] Y.J. Chao, X. Qi, Heat transfer and thermo-mechanical modeling of friction stir joining of AA6061-T6 plates, in: Proceedings of the First International Symposium on Friction Stir Welding, Thousand Oaks, CA, USA, 1999.
[8] R.S. Mishra and Z.Y. Ma, Friction stir welding and processing, Materials Science and Engineering R 50 (2005) 1–78.
[10] Lakshminarayanan A.K., Malarvizhi S and Balasubramanian V, Developing friction stir welding window for AA2219 aluminium alloy, Trans. Nonferrous Met. Soc.China,, 2011, 21, 2339-2347. [11] Yan Yong, Zhang Da-tong, Qiu Cheng Cheng and Zhang Wen,
Dissimilar friction stir welding between 5052 aluminum alloy and AZ31 magnesium alloy, Trans.Non ferrous Met.Sc. China 2010, 20s 619-s623.
[12] Elangovan K and Balasubramanian V, Influences of tool pin profile and welding speed on the formation of friction stir processing zone in AA2219 aluminum alloy, Journal of materials processing technology ,2008, 200, 163–175.
[13] Chen Y., Liu, H., Feng J., Friction stir welding characteristics of different heat-treated-state 2219 aluminum alloy plates. Mater. Sci. Eng. A, MSA, 2006, 19864.
[14] Cao, G., Kou, S., Friction Stir Welding of 2219
aluminum: behavior of (Al2Cu) particles. 2005, Weld. J., 1s–8s. [15] ASTM, E.-8., Standard test method for tension testing of metallic
materials, ASTM 2000.