Time-Efficient Genetic Algorithm for Peak Power
Reduction of OFDM Signal
Noritaka Shigei
∗, Hiromi Miyajima
∗†, Keisuke Ozono
∗‡Abstract— Orthogonal frequency division multi-plexing (OFDM) is superior in spectral efficiency and is widely used in today’s digital communication. One of the drawbacks of OFDM is that the peak-to-average power ratio (PAPR) of the transmitted signal tends to be high. In order to overcome this problem, peak power reduction methods based on tone injec-tion have been proposed. The peak power reducinjec-tion problem solved with tone injection is a combinatorial problem. In this paper, we apply genetic algorithm (GA) to the reduction method based on tone injec-tion. The proposed method utilizes a tree-structured fitness table to reduce the computation time. The ef-fectiveness of the GA method is demonstrated by nu-merical simulations in terms of PAPR, bit error rate (BER) and computaiton time. We also investigate ef-fective fitness functions and crossover operators. It is shown that a uniform crossover operation is most effective. Further, it is shown that our GA method is superior in terms of computation time compared to a conventional GA method and a random search method.
Keywords: OFDM, PAPR, tone injection, genetic al-gorithm, tree-structured table
1
Introduction
Recent advance in digital signal processing technology demands faster wireless communication. Orthogonal fre-quency division multiplexing (OFDM) [1] is superior in spectral efficiency and is widely used in today’s digital communication. One of the drawbacks of OFDM is that the peak-to-average power ratio (PAPR) of the trans-mitted signal tends to be high. In order to overcome this problem, various peak power reduction methods have been proposed[2, 3, 4, 5, 6, 7]. Tone injection is an effec-tive technique to overcome the PAPR problem[6, 7]. The peak power reduction problem solved with tone injection is a combinatorial problem. In [6], a greedy searching algorithm has been proposed. Its main drawbak is to easily get a stack shallow local minimum. In [7], the so-lution space is reasonably reduced by introducing some
∗Graduate School of Science and Engineering, Kagoshima
Uni-versity, 1-21-40 Korimoto, Kagoshima 890-0065, Japan (corre-sponding author N. Shigei to provide email: [email protected])
[image:1.595.310.544.200.276.2]†email: [email protected] ‡email: [email protected]
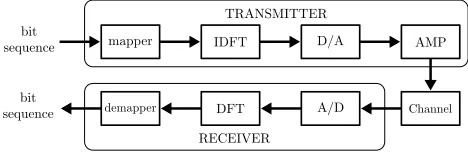
Figure 1: Flow of OFDM from a transmitting end to a receiving end.
constraints into the tone injection technique, and a peak power reduction method based on neural network (NN). However, the reduction performance is high.
In this paper, we apply genetic algorithm (GA) to the reduction method based on tone injection. The pro-posed GA method utilizes a tree-structured fitness table to reduce the computation time. The effectiveness of the GA method is demonstrated by numerical simulations in terms of PAPR and bit error rate (BER). We also inves-tigate effective fitness functions and crossover operators. It is shown that a uniform crossover operation is most effective. Further, it is shown that our GA method is superior in terms of computation time compared to the conventional GA method and a random search method.
2
OFDM and Tone Injection
2.1
OFDM
OFDM uses multiple subcarriers that are orthogonal to each other. LetT be the OFDM symbol time. The sub-carriers are spaced 1/T Hz apart from each other. The flow of OFDM from a transmitting end to a receiving end is shown in Fig.1.
At the transmitter side, a bit sequence bL−1, bL−2, · · ·,
b0to be transmitted is converted into a sequence of
com-plex symbols X0, X1, · · ·, XN−1 by mapper. In this
conversion, each M-bit subsequence in L-bit sequence is mapped to a complex number according to the used digital modulation scheme such as phase-shift keying (PSK) and quadrature amplitude modulation (QAM). When using M-QAM, Xn represents log2M-bit
L = Mlog2M and m = log2M. Samples of OFDM
signal Y0,Y1,· · ·,YN−1are generated by IDFT (Inverse
Discrete Fourier Transform) as follows:
Yn=
1
N
N∑−1
k=0
Xkej 2π
Nnk. (1)
The IDFT operation can be performed by IFFT (Inverse Fast Fourier Transformation) in O(NlogN) steps. The samples are converted to an analog signal, and then the signal is amplified and is fed to the transmission channel.
The demodulation process is performed in reverse order of transmitter’s operations. From the received OFDM signal, N samplesYe0, Ye1, · · ·, YeN−1 are extracted with
T /N sampling interval. SymbolsXe0, Xe1,· · ·,XeN−1 are
restored by DFT (Discrete Fourier Transform) as follows:
e Xn=
N∑−1
k=0
e Yke−j
2π
Nnk. (2)
The restored symbol sequenceXe0,Xe1,· · ·,XeN−1is
con-verted to a bit sequence ˜bL−1, ˜bL−2,· · ·, ˜b0. IfXen=Xn
for all n ∈ {0,1,· · ·, N −1}, the receiver retrieves the transmitted bit sequence bL−1,bL−2,· · ·, b0 with no
er-ror, that is, for alll∈ {0,1,· · · , L−1}, ˜bl=bl.
The OFDM signal often has a very high peak power com-pared to its average power, because the signal is produced as a synthetic signal of a number of subcarriers. The de-gree of the peak power is evaluated by peak-to-average power ratio (PAPR) defined as follows:
PAPR = max0≤k<N|Yk|
2
E{|Yn|2}
, (3)
whereE{|Yn|2}is the average power of the OFDM signal.
2.2
Tone Injection
[image:2.595.319.534.68.232.2]Tone injection suppresses the peak power by relocating some complex symbols from their original position to other position[6, 7]. Assume that the used digital mod-ulation scheme is M-QAM with an √M ×√M lation grid, and the minimum distance between constel-lation points is d. The original position of a complex symbol, which will be referred as original symbol, is lo-cated at a grid point of the √M ×√M grid, and the destination of relocation is located outside of the grid. In Fig.2, the original symbols for 16-QAM are shown as 16 black circles. Let the original position of a complex sym-bol representing a bit sequencebn= (bL−1, bL−2,· · · , b0)
beXn. In [6], the set of complex symbols ˆXnrepresenting
bn is given by the following equation:
ˆ
Xn=Xn+pnD+jqnD, (4)
where D =ρdM, ρ≥ 1 andpn and qn are any integer
[image:2.595.119.218.120.150.2]numbers. For pn = qn = 0, ˆXn is the original symbol
Figure 2: Symbol relocation of tone injection for 16-QAM andρ= 1.
0 1 5 4 20 21 17 16 2 3 7 6 22 23 19 18 10 11 15 14 30 31 27 26 8 9 13 12 28 29 25 24 40 41 45 44 60 61 57 56 42 43 47 46 62 63 59 58 34 35 39 38 54 55 51 50 32 33 37 36 52 53 49 48 Re Im 49’ 53’ 52’ 36’ 37’ 33’ 32’ 16’ 17’ 21’ 20’ 4’ 5’ 1’ 34’ 42’ 40’ 8’ 10’ 2’ 0’ 48’ 50’ 58’ 56’ 24’ 26’ 18’
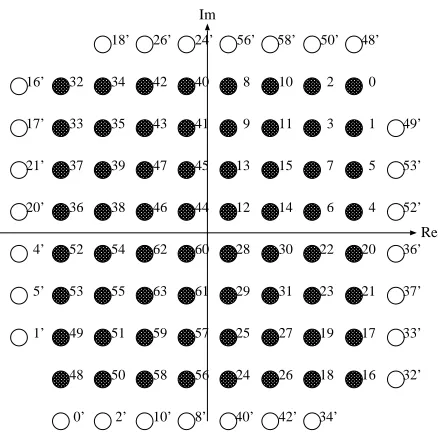
Figure 3: The used constellation map of 64-QAM.
Xn. Forpn̸= 0 and/orqn ̸= 0, ˆXnis a relocated symbol,
which is located outside of the√M×√M grid. In Fig.2, the relocated symbols from Xn = −d2 +j32d for ρ = 1, |pn| ≤1 and|qn| ≤1 are shown as 9 white circles.
The PAPR reduction task based on tone injection is to determinepn andqn, for alln, so as to minimize PAPR.
That is, the task is a combinatorial optimization problem. However, the number of solutions are enormous even if the range of pn andqn are limited. Therefore, A greedy
algorithm proposed in [6] is as follows:
(Step 1) Find the complex symbol Xn or ˆXn that most
contributes to the peak power.
(Step 2) Find the most effective pn and qn for PAPR
[image:2.595.319.538.294.510.2](Step 3) Repeat steps 1 and 2 until obtaining a sufficient PAPR reduction.
The following drawbacks of this method have been noted[6, 7]: (1) any average power increases results in a reduction in SNR margin, (2) unnecessary power in-creases can lead to higher secondary peaks, and (3) the greedy searching algorithm tends to get a stack shallow local minimum, which will result in a poor PAPR reduc-tion performance.
In [7], two constraints, which are effective to relax the above drawbacks (1) and (2), have been introduced in peak power reduction based on tone injection. The con-straints are as follows: (a) movable symbols are limited to the symbols located along the outer circumference of the original constellation, and (b) for a movable symbol the destination of relocation is limited to one place, which is an almost symmetrical position of the original posi-tion with respect to the origin. The constraints (a) and (b) will reduce the peak powers of subcarriers compared with the without the constraints, because the magnitude of any complex symbol with the constraints is not larger than the one without the constraints. Further, the con-straint (a) is validated by the observation that the outer circumferential symbols will contribute more to the peak power than the inner symbols.
In this paper, we also introduce the above constraints and use the constellation map of 64-QAM as shown in Fig.3. In Fig.3, the original symbols are shown as 64 black circles and the relocated symbols are shown as 28 white circles. In the figure, the black circle with a number
m∈ {0,1,· · · ,63} is the original symbol X(m), and the
white circle with a number m′ is the replacement of the original symbolX(m).
Although the above constraints reduce the solution spaces, the number of solutions is still enormousness. As-suming that N symbols to be transmitted randomly oc-cur, the average number of solutions is 2167N, which is
approximately 5.2×1033and 2.7×1067forN= 256 and
512, respectively. As a solution against the drawback (3), we will present a searching algorithm based on GA in the next section.
3
Proposed Method
[image:3.595.337.521.71.115.2]We apply genetic algorithm (GA) to the peak power re-duction method based on tone injection. The GA, which is a search heuristic based on the process of natural evo-lution, can find a good solution for optimization problems by evolving the population of solutions with genetic op-erators such as selection, mutation and crossover[8]. GAs have been employed for solving many combinatorial op-timization problems in various fields[9, 10, 11, 12], and it has been shown that GAs can find a near-optimal solu-tion in a much shorter time compared to the convensolu-tional
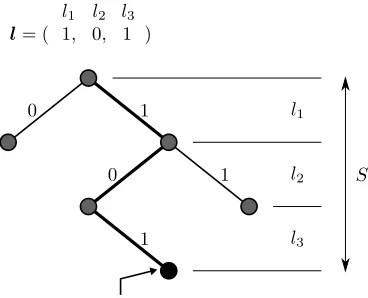
Figure 4: An example of chromosome for N = 8 and
S= 3.
methods such as random search and exhaustive one, espe-cially in large solution spaces. The proposed method uses GA to find an effective combination of moved symbols for PAPR reduction.
3.1
Genetic Representation
In GA, a solution is coded as a string, called chromo-some. Let A ={X(0), X(1),· · · , X(M−1)} be the set of
all the original complex symbols. Let M be the set of the movable original complex symbols. That is, for Fig.3,
M={X(0), X(1), X(2), X(4), X(5), X(8), X(10),X(16),
X(17), X(18), X(20), X(21), X(24), X(26), X(32), X(33),
X(34) X(36), X(37), X(40), X(42), X(48), X(49), X(50),
X(52),X(53), X(56),X(58)}.
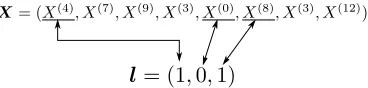
Let X = (X0, X1, · · ·, XN−1) be the vector of original
complex symbols to be transmitted. Let S = {Xn ∈ M|0 ≤ n≤ N−1} and S = |S| be the set of movable symbols in X and the size of S, respectively. Let n(s) be the function of integer s ∈ {1,2,· · ·, S} such that
|{Xi∈ M|0≤i≤n(s)}|= s and Xn(s) ∈ M. That is,
the functionn(s) returns thes-th smallest index number
nofXn among{Xn∈ M|0≤n≤N−1}.
A solution (chromosome) for X is coded as an S -dimensional binary vector
l= (l1, l2,· · ·, lS), (5)
where ls∈ {0,1}, and ls= 1 and ls = 0 mean that the
symbol Xn(s) is moved and is not moved, respectively.
Fig.4 shows an example of the chromosome coding. Note that the length of a chromosome depends onX. When the symbols to be transmitted randomly occur, the aver-age length is 167N.
3.2
Fitness Function
When PAPR by Eq.(3) is used as evaluation function, a smaller PAPR value means a better solution. In order that a better solution has a larger evaluation value, we use the following evaluation function as GA’s fitness function:
f =
(
1 PAPR
)α
, (6)
3.3
Mutation and Crossover Operators
The used mutation operator operates on each locus of chromosomes. Given a chromosome l = (l1, l2,· · · , lS),
each locus l∈ {l1, l2,· · ·, lS}is updated as follows:
l←− {
(l+ 1) mod 2 with probabilityPm
l with probability 1−Pm.
(7)
Another approach is to perform the mutation for each chromosome. However, according to our preliminary sim-ulation, this approach is not good.
We consider four types of crossover operator: one-point, two-point, three-point and uniform. For every types, the crossover points are randomly selected.
3.4
The Algorithm
The evaluation of a solution involves IFFT operation, which requires O(NlogN) steps. In order to reduce the computation time, the proposed algorithm utilizes a tree-structured fitness table. Once a solution is evaluated, its fitness value is registered in the table. When thereafter the same solution appears, its fitness value is obtained by referring to the table instead of by calculation.
If the search time is much smaller than the one of IFFT, a significant reduction of the computation time will be achieved. The fitness table also should be efficient in terms of memory. Therefore, we use a binary tree as the fitness table. The binary tree is as follows: (1) the height isS, (2) an edge between levelss−1 ands(1≤s≤S) is associated withls, (3) for each node at levels−1, the
left and right edges are associated withls= 0 andls= 1,
respectively, (4) the existence of the path corresponding to a solution l = (l1, l2,· · ·, lS) means that the fitness
[image:4.595.336.520.551.700.2]value of lis already registered, and (5) the fitness value of a solution lis memorized in the leaf node of the path corresponding to l. An example of the tree-structured table is shown in Fig.5. Since the search and the regis-tration of the fitness value of a solution ltrace from the root node to the corresponding leaf node, they completes in at mostS steps. As mentioned before, the average of
S is 167N. Therefore, the search and the registration of a fitness value completes inO(N) steps.
The algorithm of the proposed GA is shown below.
Algorithm
Step 1: Set the current generationg←1. Set the best fitnessfbest←0.
Step 2: Randomly generateKindividualsl1,l2,· · ·,lK
in the form of Eq.(5).
Step 3: For eachk∈ {1,2,· · ·, K}, search for the fitness
fk in the tree-structured fitness table. Iffk is not found,
calculatefk according to Eq.(6), and registerfk into the
fitness table.
Letfmax= maxk∈{1,2,···,K}fk. Letkmax∈ {1,2,· · ·, K}
such that fkmax = fmax. If fmax > fbest, then fbest ←
fmax andlbest←lkmax.
Step 4: Ifg > G, then go to Step 10.
Step 5: For eachk∈ {1,2,· · ·, K}, calculate the selec-tion probability
Pk =
fk
∑
i∈{1,2,···,K}fi
.
DrawKsamplesl′1,l′2,· · ·,l′K with replacement froml1,
l2,· · ·,lK with probabilitiesP1,P2,· · ·,PK. Step 6: For each pairl′2k+1 andl′2k+2 (0≤k≤ K
2 −1),
perform the crossover operation with probability Pc.
Step 7: For each locus ls in l′1, l′2 · · · l′K, perform the
mutation operation with probabilityPm.
Step 8: Copy l′1, l′2, · · ·, l′K to l1, l2, · · ·, lK,
respec-tively.
Step 9: g←g+ 1 and go to Step 3.
Step 10: Returnlbest as the final solution.
In GA, as the generation progresses, the large portion of the population converges to particular solutions. This property will make it possible for Step 3 to reduce the computation time.
In Step 6, one of the four types of crossover operator is used. The best type will be shown in the next section.
4
Numerical Simulations
The simulations assume an AWGN (Additive White Gaussian Noise) channel, where a white noise with SNR 20dB is added to the signal from the amplifier. The used
10-3 10-2 10-1 100
4 4.2 4.4 4.6 4.8 5 5.2
Pr(PAPR>PAPR
0
)
[image:5.595.54.282.74.240.2]PAPR0 [dB] 1 point α=7 2 point α=7 3 point α=8 uniform α=8
Figure 6: PAPR for different crossover methods.
nonlinear power amplifier model has the following input-output characteristic.
F[ρ] = ρ
(1 +ρ6)1/6, (8)
where F[ρ] is the gain of the amplifier and ρis the ratio of the mean input amplitude to the saturation amplitude.
The number of subcarriers is N = 128, the population size isK= 30, the maximum generation number isG= 50, and the probabilities for crossover and mutation are
Pc = 0.9 and Pm = 0.01, respectively. Each result is
calculated from 100000 trials.
4.1
PAPR Reduction Performance
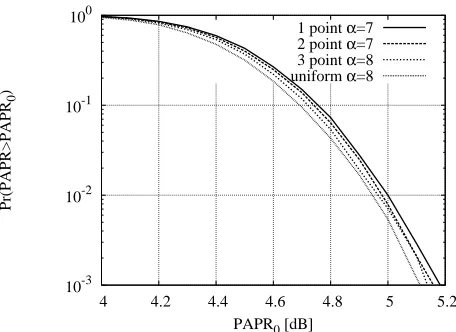
At first, for each crossover operator type, the effective value of parameterαin the fitness function is investigated in terms of PAPR. From the results, for 1-point, 2-point, 3-point and uniform crossovers, the best values forαare
α= 7,α= 7,α= 8 and α= 8, respectively.
The results with the best α are summarized in Fig.6. PAPR0at the horizontal axis is the upper limit of the
lin-ear amplification range, and Pr(PAPR>PAPR0) at the
vertical axis is the probability that PAPR exceeds the limit PAPR0. This figure shows a tendency that the
PAPR reduction performance improves with the num-ber of crossover points and the uniform crossover oper-ator provides the best performance. Therefore, in the following, the proposed method assumes to use uniform crossover andα= 8.
Next, the proposed method is compared with a conven-tional method based on neural network (NN)[7] and a random search. The result is shown in Fig.7. In the fig-ure, “NN”, “Random” and “Proposed” are the method based on NN (NN method), a random search and the proposed method, respectively. All the methods use the same constellation map shown in Fig.3. The random
search randomly generates 1500 solutions and returns the best solution as the final solution. According to the re-sult, the proposed method achieves the best performance among them.
We also measure the computation time for the random search and two types of GA methods. The first type of GA method is the proposed method. The other type of GA method is the conventional one that does not use the tree-structured fitness table and that calculates the fitness for all the individuals. The computation time is calculated in terms of CPU time. The random search, the conventional GA method and the proposed GA method take 35.16ms, 36.18ms and 22.78ms, respectively. Our proposed method achieves about 1/3 reduction in the computation time. The total number of unique individ-uals occurring through all the generations of GA is ap-proximately 1000. Since the total number of individuals through all the generations is 1500, the amount of re-duction in the computation time is proportional to the amount of the duplicated individuals.
4.2
Bit Error Rate Performance
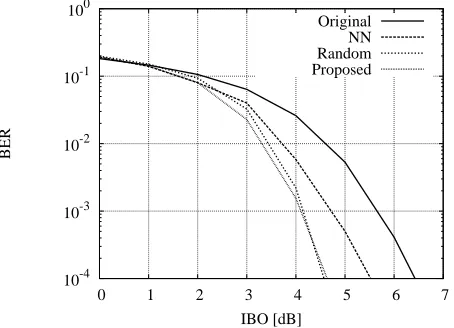
The proposed GA method is compared with the conven-tional NN method and the random search in terms of bit error rate (BER).
BER = (Total number of error bits)
(Total number of transmitted bits) (9)
The result is shown in Fig.8, where IBO (Input Back-Off) defines the degree of nonlinearity of an amplifier and is given by the following equation.
IBO = (Saturation amplitude)
(Mean input power) (10)
In Fig.8, “Original” is the case of no PAPR reduction. The result shows that the proposed method achieves the best BER performance.
5
Conclusions
10-4 10-3 10-2 10-1 100
4 4.5 5 5.5 6
Pr(PAPR>PAPR
0
)
[image:6.595.54.282.75.240.2]PAPR0 [dB] NN Random Proposed
Figure 7: Performance comparison of PAPR reduction with conventional methods.
10-4 10-3 10-2 10-1 100
0 1 2 3 4 5 6 7
BER
IBO [dB]
Original NN Random Proposed
Figure 8: BER performance.
Acknowledgments
This work is supported by Grant-in-Aid for Scientific Re-search (C) (No.20500070) of Ministry of Education, Cul-ture, Sports, Science and Technology of Japan.
References
[1] Weinstein, S., Ebert, P., “Data Transmission by Frequency-Division Multiplexing Using the Discrete Fourier Transform,” IEEE Trans. on Communica-tion Technology, Vol.19, Issue 5, pp.628-634, 1971.
[2] Li, X., Cimini, L.J., Jr., “Effects of Clipping and Fil-tering on the Performance of OFDM,” IEEE Com-munications Letters, Vol.2, No.5, pp. 131-133, 1998.
[3] Armstrong, J., “New OFDM Peak-to-Average Power Reduction Scheme,” Proc. of IEEE Vehicular Tech-nology Conference, pp. 756-760, 2001.
[4] Jones, A.E., Wilkinson, T.A., Barton, S.K., “Block Coding Scheme for Reduction of Peak to Mean Envelope Power Ratio of Multicarrier Transmis-sion Scheme,” Electronics Letters, Vol.30, No.25, pp.2098-2099, 1994.
[5] Cimini, L.J., Jr., Solenberger, N.R., “Peak-to-Average Power Ratio Reduction of an OFDM Sig-nal Partial Transmit Sequences,” IEEE Communi-cations Letters, Vol.4, No.3, pp. 86-88, 2000.
[6] Tellado, J., Cioffi, J., “Peak Power Reduction for Multicarrier Transmission,” Proc. of IEEE Commu-nication Theory Mini-Conference, GLOBECOM ’98, pp.219-224, 1998.
[7] Ohta, M., Ueda, Y., Yamashita, K., “PAPR Reduc-tion of OFDM Signal by Neural Networks without Side Information and its FPGA Implementation,” IEEJ Trans. on Electronics, Information and Sys-tems (in Japanese), Vol.126, No.11, pp. 1296-1303, 2006.
[8] Goldberg, D.E., Genetic Algorithms in Search, Op-timization and Machine Learning, Kluwer Academic Publishers, 2002.
[9] Kitabi, A., Jenkins, W.K., “Use of the Genetic Algo-rithm to Improve Bit Error Rates in CDMA Wire-less Communication Systems,” Conference Record of the Thirty-Fifth Asilomar Conference on Signals, Systems and Computers, Vol.2, pp.1540-1544, 2001.
[10] Thamvichai, R., Bose, T., Haupt, R.L., “Design of 2-D Multiplierless IIR Filters Using the Genetic Algo-rithm,” IEEE Trans. on Circuit and Systems-I: Fun-damental and Applications, Vol.49, No.6, pp.878– 882, 2002.
[11] Li, Y., Ang, K.H., Chong, G.C.Y., Feng, W., Tan, K.C., Kashiwagi, H., “CAutoCSD-Evolutionary Search and Optimisation Enabled Computer Auto-mated Control System Design,” International Jour-nal of Automation and Computing, Vol.1, No.1, pp.76-88, 2004.
[image:6.595.55.282.303.467.2]