© 2019 by the Serbian Biological Society How to cite this article: Vidonja Uzelac T, Tatalović N, Mijović M, Nikolić-Kokić A, 245 Oreščanin-Dušić Z, Bresjanac M, Blagojević D. Effects of ibogaine per os treatment on redox homeostasis in rat kidney. Arch Biol Sci. 2019;71(2):245-52.
Effects of ibogaine
per os
treatment on redox homeostasis in rat kidney
Teodora Vidonja Uzelac1, Nikola Tatalović1, Milica Mijović2, Aleksandra Nikolić-Kokić1,
Zorana Oreščanin-Dušić1, Mara Bresjanac3 and Duško Blagojević1,*
1Department of Physiology, Institute for Biological Research “Siniša Stanković”, University of Belgrade, Bulevar despota Stefana 142, 11060 Belgrade, Serbia
2Institute of Pathology, Faculty of Medicine, University of Priština, Anri Dinana bb, 38220 Kosovska Mitrovica, Serbia 3Institute of Pathophysiology, Faculty of Medicine, University of Ljubljana, Zaloška 4, 1001 Ljubljana, Slovenia
*Corresponding author: [email protected]
Received: February 8, 2019; Revised: February 17, 2019; Accepted: February 19, 2019; Published online: February 21, 2019
Abstract: Our previous results showed that a single oral dose (1 or 20 mg/kg body weight) of the anti-addiction agent
ibo-gaine induced in rats 6 and 24 h after administration glycogenolytic activity in hepatocytes, followed by a mild oxidative stress. In this work, we examined the in vivo effect of the same doses of ibogaine on rat kidney morphology, antioxidant enzyme (superoxide dismutases (SOD1 and 2), catalase, glutathione peroxidase, glutathione reductase (GR) and glutathione-S-transferase) activities, and oxidative stress (TBARS) and redox (-SH groups) parameters. The dose of 1 mg/kg ibogaine induced an elevation in SOD1 activity and decreased GR activity after 6 and 24 h. GR activity was decreased at 6 and 24 h after 20 mg/kg ibogaine administration, suggesting changed redox homeostasis. After 24 h, we observed an increase in moderate morphological changes, without changes in urinalyses, indicating that kidney function was not measurably affected. Nevertheless, kidney-function monitoring during and following ibogaine use in human subjects is advisable.
Keywords: ibogaine; kidney; antioxidant enzymes; lipid peroxidation; proximal tubules
INTRODUCTION
Ibogaine, in addition to its traditional use in African tribal communities for spiritual purposes [1], has also been used as an anti-addictive agent [2,3]. For this pur-pose, single doses, ranging from 1 to 25 mg/kg (given per os), have been suggested. The dose of 20 mg/kg has been found to be safe, but based on several safety fac-tors, a maximum oral dosage limit of less than 1 mg/kg was suggested [4,5]. In our recent work, we showed that ibogaine at a single dose of either 1 or 20 mg/kg body weight (b.w.) per os caused depletion of liver glycogen 6 and 24 h post treatment, suggesting extensive utilization of glucose. In addition, thiobarbituric acid reactive sub-stances (TBARS) were elevated 6 h after application of 1 mg/kg b.w., suggesting a mild prooxidant effect, but the increase was insufficient to promote a systemic change in hepatic antioxidant enzyme activities [6]. Previous in vitro findings showed that ibogaine affected cellular energy metabolism as it leads to the rapid discharge of ATP pools in yeast [7] and erythrocytes [8], which is
associated with an increase in the amount of certain metabolic enzymes involved in glycolysis and Krebs cycle [9], reactive oxygen species (ROS) production and increased activities of antioxidative enzymes [10]. Therefore, ibogaine is considered a pro-antioxidant, although it does not possess antioxidant properties [11]. However, in vitro and ex vivo experiments were performed with much higher doses than those applied in vivo (after per os application), where its pro-antioxidant ability was not so convincingly shown. Results revealed that in vivo intragastric application in rats and mice led to much lower concentrations of ibogaine and its main metabolite, noribogaine, in blood plasma as compared to doses used in vitro [6,12].
super-oxide dismutase (SOD2), catalase (CAT), glutathione peroxidase (GSH-Px), glutathione reductase (GR) and glutathione S-transferases (GST), after 6 and 24 h in rat kidney. We also measured the amounts of TBARS and -SH groups as markers of lipid peroxidation and the thiol-based redox state, respectively. Because ibogaine and its metabolite noribogaine are metabolized by the kidneys, we performed histological examination of the kidney cortex and basic urinalysis (red blood cells (RBC), white blood cells (WBC), glucose, bilirubin, ketones and nitrites, pH, specific density, protein, urobilinogen and ascorbic acid concentrations).
MATERIALS AND METHODS
Animals
All procedures complied with the EEC Directive on the protection of animals used for experimental and other scientific purposes and were approved by the Ethical Committee for the Use of Laboratory Animals of the Institute for Biological Research “Siniša Stanković”, University of Belgrade (decision No. 02-03/16). Three-month-old male Wistar rats, body weight 305±15 g, were housed under standard laboratory conditions (light/dark 12/12 h, at 22°C). Water and food were available ad libitum.
Experimental design
Ibogaine hydrochloride (PubChem CID: 197059, purity 98.93%), was a kind gift from the Sacrament of Transition, Maribor, Slovenia, and from Remøgen, Phytostan Enterprises Inc., Canada (purity 99.9%), and was provided by M.B. from the LNPR project funded by the ARRS Program P3-0171. Ibogaine stock
(dis-solved in dH2O, concentration 2 mg/mL) was prepared
fresh and protected from light till administration. The animals were randomly divided into three groups: control, ibogaine low dose (1 mg/kg b.w.), and ibogaine high dose (20 mg/kg b.w.). Each group was randomly divided into two subgroups to be decapitated after 6 h or decapitated after 24 h. All animals received 1 mL
of liquid (dH2O or ibogaine solution of appropriate
concentration) per 100 g b.w. via intubation. The
control group was treated with dH2O. The control
group contained 6 animals (3 animals per subgroup),
and the ibogaine-treated groups contained 12 animals per group (6 animals per subgroup). The design of the experiment was as follows: control groups Cont6 and Cont24; ibogaine (1 mg/kg b.w.) groups L6 and L24; ibogaine (20 mg/kg b.w.) groups H6 and H24. The numbers 6 and 24 indicate the times post ibogaine administration when the animals were killed.
Tissue preparation
After decapitation, both kidneys were removed. The anterior part of the right kidney (one third of the kidney) was fixed in 4% paraformaldehyde (pH 7.4, 24 h). The left kidney and the rest of the right kidney tissue were frozen in liquid nitrogen and kept at -70°C until use.
Preparation of tissue and determination of enzyme activities
For determination of antioxidative enzyme and GST activities, kidney samples were homogenized (3x10 s, pause 10 s) and sonicated (3x15 s; 10 kHz, pause 15 s) on ice in 0.25 M sucrose, 50 mM Tris, 1 mM EDTA buffer, pH 7.4, and centrifuged at 4°C, 105000 x g, for 90 min. For determination of the concentrations of TBARS, total and non-protein -SH groups, sonicated homogenate prepared in non-sucrose buffer 50 mM Tris, 1 mM EDTA, pH 7.4, was centrifuged at room temperature at 9000 x g for 15 min. The activity of antioxidant enzymes were measured in supernatants spectrophotometrically. The activities of total SOD and SOD2 were determined by the adrenaline method [13]. For determination of SOD2, samples were incubated with 8 mM KCN at room temperature for 30 min. The activity of SOD1 was calculated as the difference between total SOD and SOD2 activities. One SOD unit (U) is defined as the amount of enzyme required to decrease the rate of adrenaline auto-oxidation by 50% at pH 10.2. The activity of CAT was measured by
monitoring H2O2 consumption at 230 nm, according to
to Habig et al. [17], with 1-chloro-2,4-dinitrobenzene and glutathione used as substrates and monitoring the increase in absorbance at 340 nm [17].
Determination of the concentrations of TBARS and -SH groups
The level of lipid peroxidation in kidney was estimated according to the method described by Rehncrona et al. [18]. A mixture of equal volumes of the sample and 0.6% 2-thiobarbituric acid were heated at 95°C for 10 min. After interrupting the reaction at 0°C for 10 s, the absor-bance at 532 nm was measured. TBARS concentration was determined using malondialdehyde as a standard.
The concentrations of total -SH groups were mea-sured according to Ellman’s protocol customized for microtiter plate [19]. Samples were mixed with Ellman’s reagent (5,5’-dithiobis-(2-nitrobenzoic acid)) and after 10 min the absorbance at 412 nm was measured. For determination of non-protein -SH groups, proteins were precipitated by the addition of a sulfosalicylic acid.
Protein determination
Protein concentrations in kidney samples were mea-sured by the method of Lowry [20] using bovine serum albumin as a standard.
Preparation for histological analysis
After the kidney samples were dehydrated by increasing the concentrations of ethanol and xylol, each sample was embedded in Histowax (Histolaboduct AB, Göteborg, Sweden) and cut into 5-μm sections on a rotary micro-tome (Leica, Germany). Preparation for Hematoxylin Eosin (H&E) staining included deparaffinization in xylol, rehydration using decreasing concentrations of ethanol in water and finally staining with hematoxylin and eosin (H&E) stain [21]. Digital images of kidney tissue were captured using a Leica DM LS2 light mi-croscope and Canon PowerShot S70 camera.
Qualitative analysis of the kidney
Qualitative H&E analysis included histomorphological examination of the kidney cortex (epithelial cells of renal proximal tubules, shape of the tubular lumens,
morphology of glomeruli) and medulla. The shape of the tubular lumen is a direct consequence of size, especially the water content of the epithelial cells lin-ing the tubule lumen. When the cells are of normal volume, the lumen of the tubule assumes a round or oval shape. When the volume of the cells is increased, the lumen assumes an irregular, stellate appearance. A semi-quantitative method for describing shape and visibility of epithelial cell nuclei was used to classify them as either (i) normal and rounded and clearly visible, or (ii) rounded, less visible or focally absent.
The described morphological changes were classi-fied as ‘slightly abnormal’ when the shape of the tubular lumen was regular (oval or round) in at least 75% of all examined tubules, and when rounded nuclei were present in all cells but were poorly visible in less than 50% of all examined tubules. Morphological changes were classified as ‘moderately abnormal’ when (i) the proportion was reversed and the shape of the lumen tubules was regular (oval or round) in up to 20% of all examined tubules, and in up to 75% the shape of the tubules was stellate, and also when (ii) the nuclei were rounded and poorly visible in at least 50% of all examined cells, and were focally-absent in less than 50% of all tubules.
Urinalysis
The presence of RBC and WBC, glucose, bilirubin, ketones and nitrite in the urine, the pH, specific gravity and concentrations of total proteins (g/L), urobilinogen (I.U.) and ascorbic acid (mmol/L) were determined using commercial Uriscan urine strips, YD Diagnostics (Yongin, Republic of Korea).
Data analysis and statistical procedures
RESULTS
The activity of SOD1 was increased at 6 h af-ter administration of the low dose of ibogaine (group L6 – 1 mg/kg b.w.) as compared to the control, and it remained elevated after 24 h (L24) (Fig. 1A). There was no statistically significant difference between the higher dose of ibogaine (groups H6 and H24) as compared to the control. On the other hand, GR activity (Fig.1E) was decreased at 6 h after administration of both doses (com-pared to the control), and decreased activity persisted after 24 h. No changes in SOD2, GSH-Px and GST activities after ibogaine application were observed (Fig. 1B, D, F, respectively), regardless of the dosage and time. Although a general increase in GSH-Px was observed when a dose of 20 mg/kg b.w. was administered, neither ANOVA nor post-hoc test showed statistical significance (p=0.0532) with respect to the control. The differences between the treated animals and the control were not statistically significant when catalase activity was examined (Fig. 1C). There were no changes in the concen-tration of TBARS, total and non-protein -SH groups in any of the treated group as compared to the control (Fig. 2).
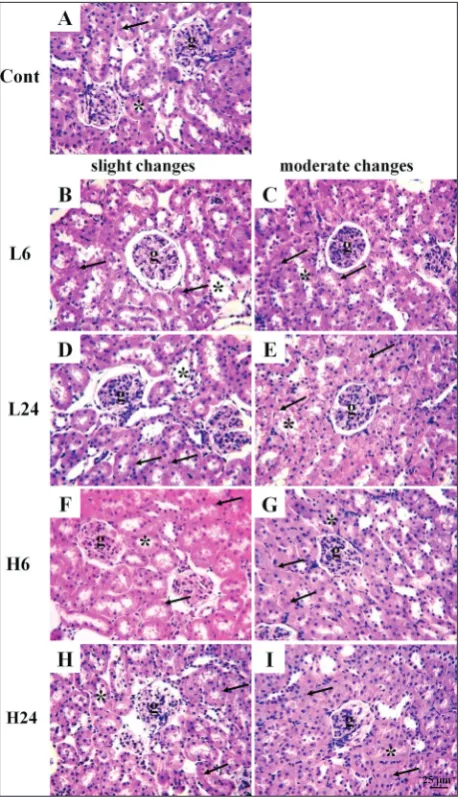
Histological analysis of the kidney showed visible changes of slight and mod-erate intensities in animals treated with ibogaine, while in animals from the con-trol group no changes were detected (Fig. 3). The proportion of moderate changes compared to slight changes was elevated at 24 h after treatment with both doses (Fig. 4). The effect was more visible for the higher dose. Dystrophic changes are vis-ible in the epithelial cells of renal proximal tubules located adjacent to the glomeruli. The lumens of the tubules had an irregular stellate shape, due to the increase in vol-ume of tubular cells. Voluminous tubular cells had a cytoplasm with a characteristic granular appearance due to the presence of a large number of acidophilus granules corresponding to enlarged mitochondria.
Fig. 1. Activity of enzymes in rat kidney. A – superoxide dismutase 1 (SOD1); B –
superoxide dismutase 2 (SOD2); C – catalase (CAT); D – glutathione peroxidase
(GSH-Px); E – glutathione reductase (GR); F – glutathione S-transferase (GST).
Results are expressed as the mean±SEM. Statistical significance was calculated
by one-way ANOVA (p<0.05, F values are presented) and post hoc compared by
Tukey’s HSD test (p<0.05); *** – p<0.001; ** – p<0.01; * – p<0.05. Cont – control group, L – groups treated with ibogaine 1 mg/kg b.w., H – groups treated with 20 mg/kg b.w.; numbers 6 and 24 indicate the times (h) after ibogaine administration.
Fig. 2. Concentrations of TBARS (A), total -SH groups (B) and non-protein -SH
groups (C) in rat kidney. Results are expressed as the mean±SEM. Statistical
Cell nuclei were rounded, less visible or focally absent. The borders between voluminous individual cells were less clear. The majority of glomeruli as well as the renal interstitium were without morphological changes.
Urine analysis showed no presence of RBCs, WBCs, glucose, bilirubin, ketones or nitrite in either the treated groups or the control. The concentrations of total proteins, urobilinogen and ascorbic acid, as well as the pH value and specific gravity were not different in the treated groups when compared to the control (data not shown).
DISCUSSION
Although ibogaine can act as a antioxidant, pro-moting increased antioxidant activity in a dose- and time-dependent manner in different in vitro and ex vivo model systems, including yeast [7] and human eryth-rocytes [8], our recent in vivo findings [6] showed that ibogaine treatment influenced hepatic redox homeostasis, but not to a sufficient extent to remodel antioxidant enzyme activities at 6 and 24 h post ibogaine applica-tion. However, in vitro and ex vivo experiments were performed with much higher doses than used in vivo and per os application, where its pro-antioxidant ability in the liver was not as convincing [6]. Results showed that in vivo intragastric application in rats and mice led to much lower ibogaine and noribogaine concentrations in blood plasma [6,12] when compared to doses used in vitro. Therefore, the pro-antioxidant role of ibogaine was questioned. Here we explored the effect of ibogaine on the kidneys, which are energetically very active, with a
Fig. 3. Representative micrographs showing kidney morphology in control group and groups treated with ibogaine (H&E, 400x).
A – Kidney cortex with preserved glomeruli, normal epithelial
cells and round or oval lumen of proximal tubules; B, D, F, H – slight changes (the lumen of proximal tubules are round or oval, while the volume of the tubular cells is slightly increased; nuclei are focally less visible); C, E, G, I – moderate changes (the lumen of proximal tubules are irregular, stellate, while the volume of the tubular cells is markedly increased; nuclei are less visible or focally-absent). Cont – control group, L – groups treated with ibogaine 1 mg/kg b.w., H – groups treated with 20 mg/kg b.w.; numbers 6 and 24 indicate the times (h) after ibogaine administration; g –
glomerulus, * – lumen of proximal tubule, ↑ – nucleus.
high metabolism. Kidneys are prone to oxidative stress and acute kidney injury has a mitochondrial and ROS origin [23]. It was also shown that redox disturbances can contribute to renal morphologic alterations in proximal tubules in rats treated with antipsychotic drugs [24]. After ingestion, ibogaine is rapidly converted to noribogaine and excreted via the kidneys and the gastrointestinal system [25,26]. It was shown that ibogaine is present in mice kidneys 4 h after per os application and that it was relatively rapidly converted to noribogaine [27]. However, in our experiment, GST activity was no dif-ferent from the control, suggesting ordinary xenobiotic metabolic activity. Kubiliene et al. [12] determined the pharmacokinetic properties of ibogaine and noribogaine in mice tissues after intragastral application of 26.3 mg/kg of ibogaine. The authors established that the kidneys were systematically exposed to ibogaine that is rapidly metabolized to noribogaine [12]. A similar result was reported in mice treated intragastrally and in human postmortem studies [27,28]. Although kidneys metabolize ibogaine, our results showed no changes in total GST activity, suggesting no difference in the overall microsomal xenobiotics metabolism in kidneys and the absence of extreme conditions that could led to oxidative stress from this origin.
The increased activity of SOD1 at 6 and 24 h after application of a dose of 1 mg/kg b.w. suggests oxida-tive pressure from the increased amount of superox-ide. Additionally, GR activity was also lower after 6 and 24 h, indicating a compensatory decrease in the glutathione-dependent antioxidant pathway, as basic antioxidant defense was provided by the SOD-CAT axis. The decrease in GR activity could be the conse-quence of the decline in available NADPH due to the effect of ibogaine on ATP pool depletion and overall drain in cellular energy. However, GR activity was also decreased after 6 and 24 h when the animals were treated with 20 mg/kg b.w. It would appear that the decrease in GR activity observed for both doses and time points was a reflection of NADPH unavailability after ibogaine application. Additionally, it could be a compensatory decline in NADPH consumption that lasted until cellular glucose metabolism homeostasis was restored and a stable homeostatic energy level was reestablished. There were no changes in -SH groups after ibogaine treatment, which indicates preserved thiol redox homeostasis. Although there were no changes in TBARS levels (as an indication of oxidative stress
at the level of lipid peroxides), morphological changes were observed (and rated as slight to moderate) at 24 h after ibogaine treatment.
Histological analysis indicated higher mitochondrial activity, which was in accordance with the postulated elevation of ROS production, mainly of superoxide, that coincided with elevation in SOD activity. Histological analyses suggest that compensatory elevation of SOD1 activity after 6 h (at the level of the whole kidney) was insufficient to prevent the damage to epithelial cells observed after 24 h (which could be of prooxidative origin). Cells of the proximal tubule require intense ATP production to reabsorb solutes through active transport. Furthermore, ATP supports cell-surface ATPase activity which prevents cell swelling due to the passive entry of sodium ions and water. If ibogaine depleted ATP, regular ionic homeostasis was disturbed and the mito-chondria were activated to produce ATP. Mitomito-chondrial morphology is dependent on the cell’s requirement for energy, and different mitochondrial and energetic states have been linked with acute kidney injury [23]. However, there were no differences in urine parameters between control and ibogaine-treated animals. The concentrations of bilirubin and urobilinogen as well as urine-specific density showed no signs of kidney and liver damage. Blood cells and proteins due to kidney damage (tubulopathy and glomerulopathy) were not present in the urine, and neither were RBCs or WBCs due to urinary tract damage. Glucose in urine could be the consequence of high blood glucose concentration and/or kidney damage; however, our recent results showed that there was no difference in blood glucose concentration between control and ibogaine-treated animals [6]. The absence of nitrite and WBCs in the urine showed that there were no signs of kidney or urinary tract infection. The nutritive status of rats was also confirmed as normal as judged by the concentration of ascorbic acid, pH and absence of ketone bodies after ibogaine treatment. Hence, there were no indicators of elevated utilization of fats instead of glucose, ingestion of ascorbic acids, starvation or metabolic discomfort such as diarrhea or tubular acidosis.
CONCLUSION
ac-tivity in kidneys. GR acac-tivity was also decreased after application of 20 mg/kg, suggesting disturbed redox homeostasis. Normal urinalysis results after ibogaine treatment revealed that kidney function was not mea-surably affected. Treatment with both doses of ibogaine provoked moderate changes in kidney morphology after 24 h, indicating a precautionary assessment of kidney activity during and after ibogaine use.
Funding: This study was supported by a grant from the Ministry of Education, Science and Technological Development of the Republic of Serbia, Project No: 173014 (“Molecular mechanisms of redox signaling in homeostasis, adaptation and pathology”), and by an ARRS Grant P3-0171 (M.B.).
Author contributions: D. Blagojević conceptualized and defined the research idea and created the research design; T. Vidonja Uzelac, N. Tatalović, Z. Oreščanin-Dušić, A. Nikolić-Kokić and M. Bresjanac searched the literature; D. Blagojević selected the statistical tests; T. Vidonja Uzelac and N. Tatalović performed most of the experiments, Z. Oreščanin-Dušić and A. Nikolić-Kokić as-sisted in the execution of the experiments. M. Mijović performed the histopathological analysis, N. Tatalović and D. Blagojević performed the statistical analyses; T. Vidonja Uzelac wrote the first draft of the manuscript; D. Blagojević A. Nikolić-Kokić, N. Tatalović, M. Bresjanac, and M. Mijović wrote the second draft of the manuscript; M. Bresjanac and Z. Oreščanin-Dušić, edited the manuscript.
Conflict of interest disclosure: The authors declare that there is no conflict of interests.
REFERENCES
1. Popik P, Layer R, Skolnick P. 100 years of ibogaine: neu-rochemical and pharmacological actions of a putative anti-addictive drug. Pharmacol Rev. 1995;47(2):235-53. 2. Alper K, Lotsof H, Kaplan C. The ibogaine medical
subcul-ture. J Ethnopharmacol. 2008;115(1):9-24.
3. Sheppard S. A preliminary investigation of ibogaine: case reports and recommendations for further study. J Subst Abuse Treat. 1994;11(4):379-85.
4. Schep L, Slaughter R, Galea S, Newcombe D. Ibogaine for treating drug dependence. What is a safe dose? Drug Alco-hol Depend. 2016;166:1-5.
5. Glue P, Winter H, Garbe K, Jakobi H, Lyudin A,
Lenagh-Glue Z, Hung CT.Influence of CYP2D6 activity on the
pharmacokinetics and pharmacodynamics of a single 20 mg dose of ibogaine in healthy volunteers. J Clin Pharmacol. 2015;55(6):680-7.
6. Vidonja Uzelac T, Tatalović N, Mijović M, Koželj G, Nikolić-Kokić A, Oreščanin-Dušić Z, Bresjanac M, Blagojević D.
Effects of ibogaine per os application on redox homeostasis
in rat liver and erythrocytes. Arch Biol Sci. 2018;71(1):133-44.
7. Paškulin R, Jamnik P, Obermajer N, Slavić M, Štrukelj B. Induction of energy metabolism related enzymes in yeast Saccharomyces cerevisiae exposed to ibogaine is adaptation to acute decrease in ATP energy pool. Eur J Pharmacol. 2010;627(1-3):131-5.
8. Nikolić-Kokić A, Oreščanin-Dušić Z, Spasojević I, Slavić M, Mijušković A, Paškulin R, Miljević Č, Spasić M, Blagojević D. Ex vivo effects of ibogaine on the activity of antioxida-tive enzymes in human erythrocytes. J Ethnopharmacol. 2015;164:64-70.
9. Paškulin R, Jamnik P, Živin M, Raspor P, Štrukelj B. Ibo-gaine affects brain energy metabolism. Eur J Pharmacol. 2006;552(1-3):11-4.
10. Oreščanin-Dušić Z, Tatalović N, Vidonja-Uzelac T, Nesto-rov J, Nikolić-Kokić A, Mijušković A, Spasić M, Paškulin R, Bresjanac M, Blagojević D. The effects of ibogaine on uterine smooth muscle contractions: relation to the activity of antioxidant enzymes. Oxid Med Cell Longev. 2018;2018:5969486.
11. Paškulin R, Jamnik P, Danevčič T, Koželj G, Krašovec R, Krstić-Milošević D, Blagojević D, Štrukelj B. Metabolic plasticity and the energy economizing effect of ibogaine, the principal alkaloid of Tabernanthe iboga. J Ethnopharmacol. 2012;143(1):319-24.
12. Kubiliene A, Sveikata A, Zevzikovas A, Sadauskiene I, Iva-nov L. Investigation into pharmacokinetic properties of active alkaloid ibogaine and its metabolite noribogaine. Acta Pol Pharm. 2017;74(5):1591-7.
13. Misra H, Fridovich I. The role of superoxide anion in the autoxidation of epinephrine and a simple assay for superox-ide dismutase. J Biol Chem. 1972;247(10):3170-5.
14. Beutler E. Red cell metabolism: a manual of biochemical methods. 3rd ed. New York: Grune and Stratton; 1982. 102 p. 15. Paglia D, Valentine W. Studies on the quantitative and quali-tative characterization of erythrocyte glutathione peroxidase. J Lab Clin Med. 1967;70(1):74-7.
16. Glatzle D, Vuilleumier J, Weber F, Decker K. Glutathione reductase test with whole blood, a convenient procedure for the assessment of the riboflavin status in humans. Experien-tia. 1974;30(6):665-8.
17. Habig N, Pabst M, Jakoby N. GST: 1st enzymatic step in mercapturic acid formation. J Biol Chem. 1974;249:7130-9. 18. Rehncrona S, Smith D, Akesson B, Westerberg E, Siesjo
B. Peroxidative changes in brain cortical fatty acids and
phospholipids, as characterized during Fe2+- and ascorbic
acid-stimulated lipid peroxidation in vitro. J Neurochem. 1980;34(6):1630-8.
19. Ellman G. Tissue sulfhydryl groups. Arch Biochem Biophys. 1959;82(1):70-7.
20. Lowry O, Rosebrough N, Farr A, Randall R. Protein measurement with folin phenol reagent. J Biol Chem. 1951;193(1):265-75.
21. Luna L. G. Manual of histologic staining methods of the armed forces institute of pathology. 3rd ed. New York: McGraw-Hill; 1968.
23. Ralto KM, Parikh SM. Mitochondria in acute kidney injury. Semin Nephrol. 2016; 36(1):8-16.
24. Nikolić-Kokić A, Mijušković A, Tatalović N, Nestorov J, Miler M, Oreščanin-Dušić Z, Nikolić M, Milošević V, Blagojević D, Spasić M, Miljević Č. Effects of anti-psychotic drug administration on antioxidative defense enzymes in male rat kidney. J Toxicol Environ Health. A 2016;79(20):905-11.
25. Alper K. Ibogaine: A Review. Alkaloids Chem Biol. 2001;56:1-38.
26. Papadodima SA, Dona A, Evaggelakos CI, Goutas N, Atha-naselis SA. Ibogaine related sudden death: a case report. J Forensic Leg Med. 2013;20(7):809-11.
27. Kubiliene A, Ivanauskas L, Kiliuviene G, Marksiene R, Sadauskiene I, Ivanov L. Cumulation of Tabernanthe Iboga alkaloid and its metabolite in organs of mice. J Med Plants Res. 2012;6(11):2194-9.