Research Article
a
August
2017
Computer Science and Software Engineering
ISSN: 2277-128X (Volume-7, Issue-8)
Application of Interrupted Time Series Modelling to Prime
Motor Spirit Distribution in Nigeria
Ette Harrison Etuk Department of Mathematics,
Rivers State University, Nigeria
Imo Udo Moffat
Department of Mathematics/Statistics, University of Uyo,
Nigeria
Azubuike Samuel Agbam Department of Banking and Finance,
Rivers State University, Nigeria
DOI: 10.23956/ijarcsse/V7I7/01706
Abstract— An inspection of the time-plot of monthly Prime Motor Spirit (PMS) distribution in Nigeria from 2009 to 2015 reveals an abrupt jump in January 2013 with the series continuing at that level till 2015. Clearly the trend of the series was interrupted in January 2013 and it is believed that this perturbation was due to the deregulation of the downstream sector of the crude oil industry. A t-test comparison of the pre- and the post-intervention means is highly significant (p < 0.0001) indicating the impact of the intervention. A model of the ARIMA family was to be fitted to the pre-intervention data which were observed to have a downward trend and be non-stationary. Differencing once rendered it stationary. An adequate ARIMA(2,1,0) model was fitted to the original pre-intervention series. Post-intervention forecasts were obtained on the basis of this model. These forecasts were subtracted from their respective post-intervention counterpart observations. These differences were modelled to obtain the transfer function of the intervention. The resultant intervention model closely fits the post-intervention data and may be used to explain and control the situation.
Keywords— Prime motor spirit, intervention, arima modelling, Nigeria, distribution
I. INTRODUCTION
A commodity consumed on a constant basis and extensively in Nigeria is Prime Motor Spirit (PMS) otherwise known as gasoline or petrol. It is used for electricity generation for automobiles and other uses. It is a major component of crude oil which is drilled in commercial quantities in the country which is one of the major producers in the world. Part of the consumed PMS comes from the refineries in the refined form and some other part comes as import. This work is a study of the distribution of the commodity. It has been observed that the distribution of the product between 2009 and 2015 is such that there was an abrupt rise in January 2013 probably due to the deregulation of the downstream sector of the petroleum industry of the country in January 2012. In particular it is the aim of this study to propose an intervention model to explain the impact of this intervention to the monthly distribution of the product.
The approach adopted is the Box-Tiao [1] technique for which autoregressive integrated moving average (ARIMA) modelling is done and from which an intervention transfer function is obtained. This approach has been extensively and successfully used to model cases of interventions. For instance, Guerard [2] demonstrated the superiority of this approach to the application of random walk with drift in the forecasting a quarterly earnings per share series. A comparative analysis of ARIMA transfer functions has been made by Helfenstein [3]. Sridharan [4] used intervention analysis to
show that abolition of parole in January 1995 had the effect of reducing crime rates. Ray et al. [5] have found the
performance of ARIMA intervention to be superior to that of the conventional ARIMA modelling for forecasting yields of cotton at Gujarat, Maharashtra in India. By the use of this approach the establishment of Federal Road Safety Corps in Nigeria has been shown to have the impact of reducing the number of accidents on Nigerian roads temporarily by Oreko
et al. [6]. Bell et al. [7] evaluated the impact of healthcare intervention on the smoking habits of some pregnant women and observed that it produced the expected effect of increased quitting of the habit by the pregnant women on delivery. Etuk and Victor-Edema [8] proposed an intervention model for monthly Naira/Euro exchange rates. This is to mention a few cases.
Section I of this work is an introduction to the paper. Section II discusses the materials and methods used in this work. Section III discusses the results of data analysis and Section IV is the conclusion. After the References there is an Appendix which is a listing of the data analysed in this research work.
II. MATERIALS AND METHODS
A. Data
Data for this work are monthly Nigerian PMS distribution data from January 2009 to December 2015 from the website
of the Nigerian National Petroleum Corporation (NNPC) http://nnpcgroup.com/. They are expressed in metric tonnes and
are listed out in the appendix of this paper.
B. Interrupted Time Series Modelling
Estimation of the ’s and ’s is done by the least squares procedure.
Let post-intervention forecasts Ft be made on the basis of the model and suppose Zt = Xt – Ft, t T. Then according to
Pennsylvania State University [9]
))
2
(
1
(
))
1
(
)^
2
(
1
(
*
)
1
(
C
T
t
C
C
Z
t
(3)The overall intervention model is given by
t t d
t
t
I
Z
L
A
L
B
Y
)
(
)
(
(4)
where It = 0, t < T and It = 1, t T.
C. Computer Package
The computer software used in this work is Eviews 7. This package uses the least square procedure for estimation purposes.
III. RESULTS AND DISCUSSION
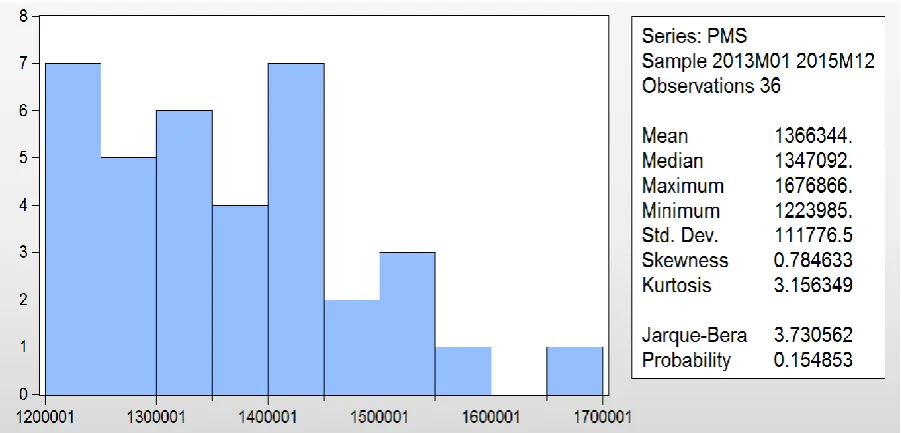
Figure 1 shows that the monthly distribution of PMS experienced an intervention in January 2013. This is probably due to the deregulation of the downstream sector of the Nigerian crude oil industry in January 2012. The intervention point is January 2013 one year after the deregulation was put in place by the then President, Goodluck Ebele Jonathan. The time plot of the pre-intervention distribution in Figure 2 shows a downward trend. Figures 3 and 4 are the histograms of the pre- and post-intervention data respectively. A student’s t-test of their mean difference is statistically significant with p < 0.0001. This is an indication of the impact of the intervention of the distribution of the commodity. However, application of t-test in this situation is not ideal as its application is in violation of the independence requirements of the data because they constitute a time series.
ISSN(E): 2277-128X, ISSN(P): 2277-6451, DOI: 10.23956/ijarcsse/V7I7/01706, pp. 46-51
Figure 2: Pre-intervention PMS Distribution
Figure3: Histogram of Pre-intervention PMS distribution
where t 49. The overall intervention model is given by
Y
t
F
t
I
tZ
t (7)where
)
3468
.
0
5688
.
0
1
(
L
L
2F
t t
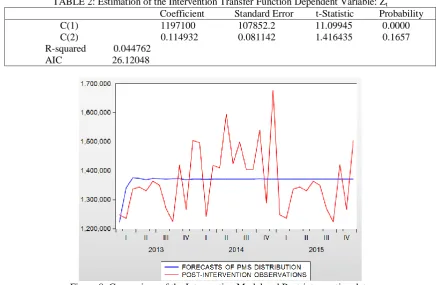
and It = 0, if t < 49 and It = 1, if t 49. A comparison of the interventionforecasts and post-intervention observations in Figure 8 shows a close agreement. This corroborates the t-test conclusion
of a significant impact of the deregulation policy.
Figure 5: Correlogram of the differences of the pre-intervention data
TABLE 1: ESTIMATION OF THE ARIMA(2,1,0) PRE-INTERVENTION MODEL
Dependent Variable: (1-L)Xt
Variable Coefficient Standard Error t-Statistic Probability
AR(1) -0.568779 0.141765 -4.012121 0.0002
AR(2) -0.346790 0.142485 -2.433861 0.0192
R-squared 0.278940
ISSN(E): 2277-128X, ISSN(P): 2277-6451, DOI: 10.23956/ijarcsse/V7I7/01706, pp. 46-51
Figure 6: Correlogram of the residuals of the ARIMA(2,1,0) pre-intervention model
Figure 7: Histogram of the residuals of the ARIMA(2,1,0) pre-intervention model
TABLE 2: Estimation of the Intervention Transfer Function Dependent Variable: Zt
Coefficient Standard Error t-Statistic Probability C(1) 1197100 107852.2 11.09945 0.0000 C(2) 0.114932 0.081142 1.416435 0.1657 R-squared 0.044762
AIC 26.12048
[6] B. U. Oreko, C. C. Nwobi-Okoye, S. Okiy and A. C. Igboanugo, “Modelling the impact of intervention measures on total accident cases in Nigeria using Box-Jenkins methodology: A case study of Federal Road
Safety Commission,” Cogent Engineering, vol. 4, no. 1., 2017.
[7] R. Bell, S. V. Gliniaia, Z. Waal, A. Close, E. Moloney, S. Jones et al. “Evaluation of a complex healthcare
intervention to increase smoking cessation in pregnant women: interrupted time series analysis with economic
evaluation,
www.tobaccocontrol.bmj.com/content/tobaccocontrol/early/2017/02/10/tobaccocontrol-2016-053476.full.pdf accessed on 26 July 2017.
[8] E. H. Etuk and U. A. Victor-Edema, “Box-Tiao intervention modeling of monthly EUR-NGN exchange rates
due to Nigerian economic recession,” Journal of Science and Engineering Research, vol. 4, no. 3, pp. 59-65,
2017.
[9] The Pennsylvania State University, Welcome to STAT 510! Applied Time Series Analysis. Department os
Statistics Online Program. www.onlinecourses.science.psu.edu/stat510/ accessed 9th November 2016.
APPENDIX Data
Year 2009 2010 2011 2012 2013 2014 2015