Mercury Interactive Topaz Web Performance Management
Summary
This APM monitors and manages processes, systems, applications and users. It saves customers money by leveraging their information assets, streamlining tasks and enabling non-IT staff to play a part in managing data. Table of Contents Overview Analysis Pricing Competitors Strengths Limitations
Recommended Gartner Research Insight
List Of Tables
Table 1: Overview: Mercury Interactive Topaz
Table 2: Features and Functions: Mercury Interactive Topaz Table 3: Products of the Topaz Platform
Corporate Headquarters Mercury Interactive 1325 Borregas Avenue Sunnyvale, CA 94089, U.S.A. Tel: +1 408 822 5200 Fax: +1 408 822 5300 Internet: www.mercuryinteractive.com Overview
Table 1: Overview: Mercury Interactive Topaz
Product Type Application performance management
Product Function Monitor business processes, systems, applications and Web sites for performance and availability.
Version Number 4.5
Release Date August 2003
Base Price (US$) 250,000
Target Markets Global 10,000 Companies
Table 2: Features and Functions: Mercury Interactive Topaz
Feature Product/Function Monitoring
Inside firewall SiteScope, Business Process Monitor, Real User Monitor and Client Monitor Outside firewall Global Monitor, Managed Services, SiteScope and Business Process Monitor Desktop/personal
computer endpoint including digital certificates
Real User Monitor and Client Desktop Monitor
Legacy custom management applications
Using terminal emulators (for example, 3270 emulation) with Business Process monitors; OpenAPI (application programming interface), Monitor Development Kit (MDK)
Voice Infrastructure Not Applicable Sources for data
collection
SiteScope, Client Monitor, Real User Monitor (switch based), Business Process Monitor, using existing network systems management infrastructures; generic applications using file, database and Simple Network Management Protocol (SNMP) adapters.
Intelligent thresholds Thresholds are set and configured manually, but base lines can be generated. Platforms
Console Accessible on all platforms (Web based) Agents Wintel, Solaris
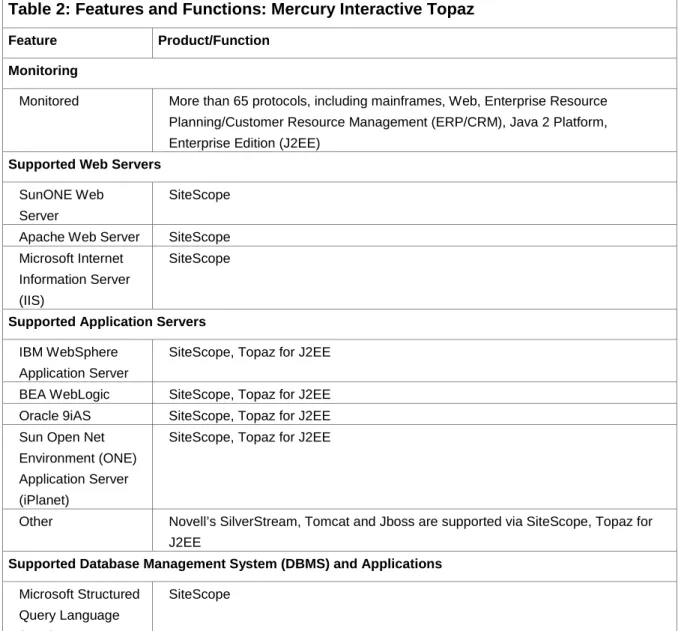
Table 2: Features and Functions: Mercury Interactive Topaz
Feature Product/Function Monitoring
Monitored More than 65 protocols, including mainframes, Web, Enterprise Resource Planning/Customer Resource Management (ERP/CRM), Java 2 Platform, Enterprise Edition (J2EE)
Supported Web Servers SunONE Web
Server
SiteScope
Apache Web Server SiteScope Microsoft Internet
Information Server (IIS)
SiteScope
Supported Application Servers IBM WebSphere
Application Server
SiteScope, Topaz for J2EE
BEA WebLogic SiteScope, Topaz for J2EE Oracle 9iAS SiteScope, Topaz for J2EE Sun Open Net
Environment (ONE) Application Server (iPlanet)
SiteScope, Topaz for J2EE
Other Novell’s SilverStream, Tomcat and Jboss are supported via SiteScope, Topaz for J2EE
Supported Database Management System (DBMS) and Applications Microsoft Structured Query Language (SQL) Server SiteScope Oracle8i SiteScope Informix No Sybase No Systeme, Anwendungen, Produkte in der Datenverarbeitung (SAP) R/3 SiteScope BroadVision SiteScope Supported Management Platforms
Tivoli For configuration, alerts, events and data Computer
Associates
For configuration, alerts, events and data
BMC Software For configuration, alerts, events and data Hewlett-Packard
Concord
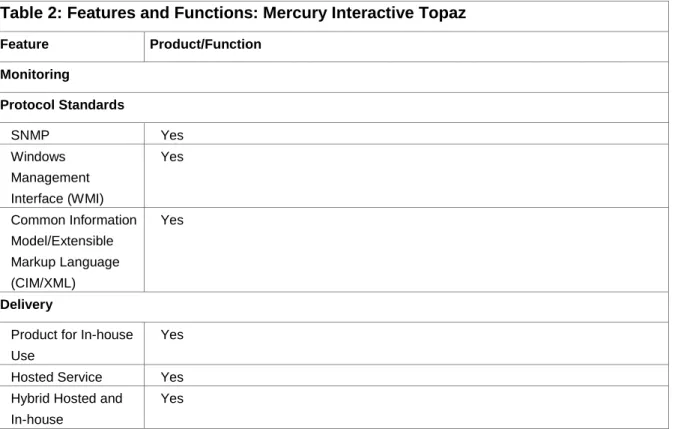
Table 2: Features and Functions: Mercury Interactive Topaz Feature Product/Function Monitoring Protocol Standards SNMP Yes Windows Management Interface (WMI) Yes Common Information Model/Extensible Markup Language (CIM/XML) Yes Delivery
Product for In-house Use
Yes
Hosted Service Yes Hybrid Hosted and
In-house
Yes
Analysis
Topaz from Mercury Interactive is a suite of application performance management (APM) products. Topaz modules monitor business processes embedded in packaged enterprise (such as Siebel or Oracle) or custom developed (such as with J2EE) applications for performance and availability bottlenecks. Modules in the suite also help determine the root cause of performance and availability problems associated with business process, applications or system-level failures. Like other APM vendors, Mercury Interactive Topaz saves customers money by leveraging the customers’ existing information assets, by streamlining administration tasks and by enabling non-IT staff to participate in managing their online information. Founded in 1989, Mercury Interactive is a publicly held company with at least $400 million in annual revenue and more than 2,200 employees. Mercury’s Business Technology Optimization (BTO) strategy is supported by three product lines, consisting of Application Delivery, Application Management and IT Governance, which address the development, deployment and production phases of the application life cycle. Within this architecture, Topaz tools support the production phase of the application life cycle. The Table, “Products of the Topaz Platform” summarizes the primary products of the Topaz platform.
Table 3: Products of the Topaz Platform
Product Description Core Products
Topaz Console A central repository for gathering data, analyzing results, as well as administering alerts and configuring Topaz.
Table 3: Products of the Topaz Platform
Product Description Core Products
Monitors and Adapters Topaz Real User Monitor (formerly Topaz Prism)
Monitors real-user traffic at the packet layer. Collects packet layer information to determine where traffic is coming from, how long it takes to get to the Web server (that is, network latency, retries and download time) and estimate how many users are gaining access to a service or application.
Topaz Client Monitor (formerly Observer)
Monitors the client desktop, provides real user performance and availability metrics
Topaz Business Process Monitors (formerly
ActiveAgent)
Simulator tracks user processes for end-to-end transaction monitoring
Topaz SiteScope Collects performance data from external DBMSs, such as applications and application servers. This agent-less system is also available stand-alone. Topaz EMS
Adapters
Collects performance data from BMC Patrol, Computer Associates Unicenter, HP OpenView and Tivoli Tivoli Enterprise Console (TEC) and NetView.
Topaz Open Application Programming Interface (API) (formerly Topaz Open DataSource)
API can accept data from any monitor and deliver it to the Topaz console, enabling programmers to incorporate data from any source into the Topaz console.
Topaz Global Monitors (formerly Rent-a-POP)
Monitors processes across the Internet through Mercury’s global monitoring infrastructure
Newer Applications Topaz Auto Root Cause Analysis (RCA)
Isolates and identifies root cause of problems in the production environment
Topaz Business Availability (TBA)
Real-time digital dashboard indicating availability of business processes, applications and underlying systems
Topaz for Service Level Management (SLM)
Provides availability and performance metrics in real time and historically, as well as correlating to service-level and operational-level agreements.
Stand-alone Products Topaz for J2EE and Topaz J2EE Deep Diagnostics
Monitoring and diagnostics for J2EE applications and systems: monitors end-user processes, application components and backend systems, facilitates triage and reduces problem resolution time. Deep Diagnostics adds visibility and analysis reports.
Table 3: Products of the Topaz Platform Product Description Core Products Service Offerings Topaz Managed Services (formerly ActiveWatch)
This hosted service offers deployment of the Topaz platform managed by Mercury Interactive. Users can gain access to the Topaz Console internally or from one of Mercury’s 80 global points of presence.
Topaz Professional Services
Offers a custom solution. Can include Implementation Services, On-site Scripting and Upgrade Services.
Topaz Rapid Delivery
Supplements either Managed Services or Professional Services with migration to internal deployment.
Solutions
Business Availability Center for Siebel
Enables users to measure and manage Siebel business processes while improving Siebel application performance and availability.
Business Availability Center for SAP
Enables users to measure and manage SAP business processes while improving SAP application performance and availability
Business Availability Center for Oracle
Enables users to measure and manage Oracle business processes while improving Oracle application performance and availability
Business Availability Center for
PeopleSoft
Enables users to measure and manage PeopleSoft business processes while improving PeopleSoft application performance and availability
Business Availability Center for Contact Centers
Helps both IT and business to improve agent productivity through improving the underlying technologies of customer interaction channels. It correlates IT
bottlenecks to the Contact Center performance and provides the ability to maintain Service-Level Agreements (SLAs) between IT and lines of business as well as business partners, such as outsourcers.
Console
The browser-accessible Topaz Console provides a single point-of-access for data gathered by Mercury Interactive components, such as: Topaz Business Process Monitor, Topaz Real User Monitor, Topaz Auto Root-cause Analysis (RCA), Topaz Client Monitor, Topaz Managed Services, Topaz OpenAPI, Topaz Diagnostics and Topaz SiteScope. These components communicate with the console via Hypertext Transfer Protocol (HTTP) or HTTP Secure Sockets. Topaz Console presents performance data at several levels and supports role-based custom views. From the highest level, the “Chief Information Officer (CIO) Cockpit” presents performance data of all applications at a glance. The user can then drill down on any problem to get detailed information on both real-time and historical performance data.
The Topaz Console works with Topaz Diagnostics to identify the source of performance bottlenecks. The console also provides the user interface for administering/monitoring profiles (used to define the corporate IT assets to be monitored, their thresholds and others) and user accounts. When the Topaz console receives an out-of-bounds value, it can alert the administrator via pager, cell phone, SNMP trap or e-mail. These alerts can be configured based on the severity and frequency of problems.
With Topaz Diagnostics, customers can reduce the time spent locating the source of problems and thereby resolve issues faster. Topaz Diagnostics identifies infrastructure problems that cause end-user performance issues. Customers who use Topaz Diagnostics can:
• Break down transaction response times to determine the source of problems • Identify the cause of failures
• View user experiences in real-time
• Pinpoint network bottlenecks to specific hops • Isolate problematic page components
Topaz Diagnostics consists of utilities that work independently to determine the cause of performance problems. They include content verification, transaction breakdown and WebTrace. Content Verification and WebTrace work over HTTP and Secure Hypertext Transport Protocol (HTTPS), Transaction breakdown works directly over Transmission Control Protocol/Internet Protocol (TCP/IP).
Content Verification
Topaz Diagnostics can verify the content within applications, including text images, links, tables and other page components, to determine whether the correct information has been returned to a user. It is also able to track HTTP and WinInet errors to validate content. If an error occurs, Topaz Diagnostics will alert the operations groups and identify the problematic page.
Page Component Breakdown
This report provides information about individual page components—such as image banners, third-party data feed—to determine impact on performance. For each component (Graphic Interchange Format [GIF], Joint Photographic Experts Group [JPEG], Hypertext Markup Language [HTML] text and others), operations groups can view Domain Name Service (DNS) lookup time, initial connection time, time to first buffer, download time, number of HTTP errors, size of component and redirection information.
Transaction Breakdown
Analyzing the TCP/IP stack, Topaz Diagnostics breaks down a transaction’s end-to-end response time into DNS lookup time, initial connection time, network time, server time and client time. Using this information, administrators can identify the cause of poor performance—network, server or external issues. Users can view real-time or historical breakdowns of transaction performance.
WebTrace
When a network-related problem occurs, HTTP-based WebTrace traces the transaction’s path through the Internet. It measures the amount of time spent on each network segment, including the average DNS time, route time, number of hops and total errors from any location. Using this information, administrators can identify the network segment and Internet service provider (ISP) responsible for the problem.
Monitors and Adapters
Topaz monitors and adapters span three categories. Transaction monitors track both real and simulated transactions. Data collectors integrate performance information generated by database management systems, Enterprise Management Systems (EMS) and custom monitors (through an API). Internet monitors track processes and measure service delivery across the Internet through Mercury’s private
infrastructure. Please see Table “Products of the Topaz Platform” for more detail on individual monitors and adapters.
Newer Applications
Recent additions to the Topaz platform are designed for complex, distributed environments. They provide user-centric views of management data and component-based views for IT. They encourage end-user involvement in the management process.
Topaz for Service Level Management (Topaz for SLM) helps administrators to create and maintain SLAs with their clients as well as internal operational level agreements (OLAs) throughout the IT tiers. Topaz for SLM is applicable to the following areas: Service Level Reporting, Proactive Service Delivery, Decision Support and Outsourced Services Management. Topaz supports SLAs in the following ways:
• Provides real time and historical metrics to determine realistic performance and availability goals for individual and for total applications, processes, users or systems
• Defines, manages and correlates SLAs and OLAs • Provides a business-centric SLM solution
• Enables real time and historical SLM
• Monitors performance on an ongoing basis and reports violations of service levels • Generates alerts before the service violations occur
• Generates trending reports
• Generates high-level reports as well as detailed reports on specific transactions for select time periods
• Generates customized reports
Topaz for SLM can use process-oriented data from other Topaz modules as well as data from any existing testing data from Mercury Interactive application-testing solutions.
Topaz Auto RCA helps organizations identify the most probable causes of performance problems. It provides a view of the application infrastructure. Underlying Topaz Auto RCA is patent-pending technology that combines statistical analysis with a rules algorithm based on Mercury Interactive’s domain expertise. Topaz Auto RCA covers end-user, network and server performance metrics.
When a problem occurs, Topaz Auto RCA filters out irrelevant data and selects the Top 5-10 “prime suspects.” First-tier operations personnel can then prioritize among these candidates and direct the information to the appropriate specialist for correction.
Topaz Auto RCA uses statistical methods based on a patent-pending model to correlate end-user problems with system data gathered by Topaz or other Mercury testing products. This statistical model is combined with predefined rules based on Mercury’s experience with a wide variety of application infrastructures. Administrators can expand the existing rules with their own specific application knowledge. Summary and drill-down reports allow knowledge to be shared between members of applications, operations and management teams.
relevance. Topaz Business Availability presents real-time performance data for business processes while mapping these processes to the underlying IT infrastructure.
It provides several views of the data to suit various user-defined custom roles and the specific task at hand. At the top level, executives can see a high-level view of all the applications and business processes. IT managers can drill down to display the underlying IT infrastructure associated with these applications and processes. The drill-down can be viewed by data centers, by technology clusters, by geographies and others.
In effect, this application is a business interface in a set of IT availability metrics that have been arranged by business processes and massaged into a comprehensible graphical representation. The metrics are collected from a variety of Mercury and third-party sources and are then presented as actionable information that both business and IT teams can understand. It collects metrics from many environments (for example, ERP, CRM, Web and Citrix) and from back-end infrastructure monitoring mechanisms and collects metrics from help desk systems. Note, however, that reports and displays of the digital cockpit are pre-defined. Using the current version, the administrator is limited in the level of report customization. Stand-alone Products
Topaz for J2EE
Specifically for J2EE applications in a production environment, Topaz allows application administrators to drill down from an end-user transaction through the backend component (for example, network or application server), down to the J2EE tier (servlets, Enterprise Java Beans [EJB]), Java Database Connectivity [JDBC] and others) and finally down to individual methods and SQL statements to help determine the problem. In addition, Topaz J2EE Deep Diagnostics uses Total Trace technology to gather information about individual instances of transactions to solve such J2EE performance problems as intermittent slow methods, memory leaks and thrashes, deadlock and synchronization problems. Topaz J2EE Deep Diagnostics provides visibility across multiple Java Virtual Machines (JVMs), down to individual instance and source code level.
Solutions
Business Availability Center for Siebel
Topaz for Siebel helps users measure and manage Siebel business processes while improving the Siebel application performance and availability. It includes add-on modules on top of both the data collectors and the application. It enables the user to feed in Siebel components and applications and provides an online topology map and dashboard of Siebel status based on end-user experience as well as infrastructure components and tasks. It also includes an Auto RCA model specific for the Siebel environment. The Siebel Infrastructure Monitor (SIM) dynamically identifies the Siebel components and provides metrics templates for each of them. It then monitors status and task information of Object Manager component group and individual components. It also monitors aggregated and specific metrics of the various Siebel servers.
Business Availability Center for SAP
Topaz for SAP helps IT operations and applications staff measure and manage end-to-end SAP business processes while improving the SAP application performance and availability. It includes add-on modules on top of both the data collectors and the application. It enables the users to feed in their SAP components and applications and provides an online topology map and dashboard of SAP status based on end-user experience as well as infrastructure components and tasks.
Business Availability Center for Oracle
Topaz for Oracle helps IT operations and applications staff measure and manage Oracle business processes while improving the Oracle application performance and availability. It includes add-on modules on top of both the data collectors and the application. It enables the user to feed in Oracle components and applications and provides an online topology map and dashboard of Oracle status based on end-user experience as well as infrastructure components and tasks.
Business Availability Center for PeopleSoft
Topaz for PeopleSoft helps IT operations and applications staff measure and manage PeopleSoft business processes while improving the PeopleSoft application performance and availability. Topaz for PeopleSoft includes add-on modules on top of both the data collectors and the application. It enables the user to feed in PeopleSoft components and applications and provides an online topology map and dashboard of PeopleSoft status based on end-user experience as well as infrastructure components and tasks.
Business Availability Center for Contact Centers
This product helps both IT and businesses to improve agent productivity through improving the underlying technologies of customer interaction channels. By monitoring and managing the end-user experience of both customers and agents, it correlates IT bottlenecks to the Contact Center performance and provides the ability to help maintain SLAs between IT and lines of business as well as business partners (for example, outsourcers).
Customer Support
Standard Customer Support provides access to Mercury’s customer support Web site that includes
online request for customer support assistance, online case tracking and status updates, knowledge base with solutions to previously asked questions or problems and an online customer community where users gather to discuss product implementation.
Preferred Customer Support adds unlimited toll free phone support. Access to support engineers is
provided real time.
Premium Customer Support offers customer support management services. Geared toward users with
large deployments of Mercury products, this program generally results in a close relationship between the customer and Mercury support personnel. This program is currently available only in the U.S. and Canada.
Hosted Service
Topaz Managed Services offers a deployment of the Topaz platform, managed by Mercury Interactive personnel. With Topaz Managed Services, users can measure their performance internally or from Mercury’s 80 global points of presence. Topaz Managed Services lets users who don’t have the time, expertise or infrastructure for an internal deployment manage business availability, performance and service levels with Topaz.
Pricing
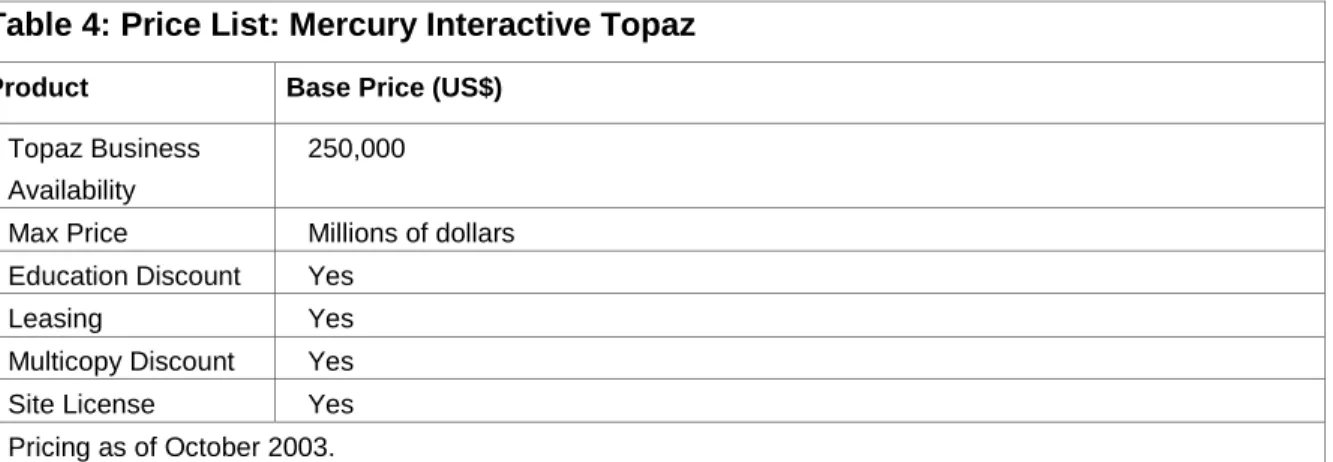
Table 4: Price List: Mercury Interactive Topaz
Product Base Price (US$) Topaz Business
Availability
250,000
Max Price Millions of dollars Education Discount Yes
Leasing Yes
Multicopy Discount Yes Site License Yes Pricing as of October 2003. GSA Pricing No. Competitors BMC • IT Master Cell • Enterprise Manager • Patrol, Patrol Express Empirix OneSight HP • OpenView • NNM • Transaction Analyzer IBM • TEC • TBSM • SLA Advisor Strengths
Wide Variety of Products
Large range of testing tools for both pre-deployment and post-deployment environments streamlines the training effort
Offers Single Source
Single source for testing and IT governance tools streamlines customer management of procurement and maintenance
Helps Support SLM
Separate views for administrators and end users support real-time and historical SLM initiatives, as well as OLAs.
Improved Support for Distributed Environments
Support for highly distributed environments is growing. Deep Diagnostics
Topaz Application Management has recently added deep diagnostics for J2EE applications and is able to compete with the “niche” vendors that specialize in that space. Additionally, Topaz Application Management has specific diagnostics for Siebel and Exchange and will add more specialty monitoring and diagnostics over time.
Supports Both Testing and Monitoring
The product combines testing with production monitoring, which lets users take the scripts in testing and rerun them in the Topaz product for monitoring, which helps provide life cycle support.
Limitations
Not a One-Stop Shop
Compared to other vendors, such as Computer Associates, Mercury does not offer a complete enterprise product line. It is missing such features as a service desk product, software distribution and mainframe tools. Nor does it go into depth into software such as Oracle, the way competitors such as BMC do. Similarly, the software does not really have a network management solution, though the vendor calls SiteScope one.
Limited Diagnostics
Except for the deep diagnostics for J2EE, the software doesn’t provide much in the way of detailed diagnostic information.
Integration Problems
Some technologies, such as the Topaz and SiteScope products, were acquisitions. Consequently, the integration is not necessarily seamless between the products. As the company continues on, acquisitions are always going to add integration issues.
Recommended Gartner Research
Web Performance Management: An Overview, DPRO-117384 Empirix OneSight Web Performance Management, DPRO-117408
ProactiveNet 5.1 Enterprise Solution for Web Performance Management, DPRO-118091 Vendor Rating: Mercury Interactive, VDR-18-7561
Mercury’s Growth Strategy Comes With Challenges, FT-18-4258
Insight
The strengths of the Topaz platform—its wide range of applications, expansive coverage of the Internet backbone and vendor with established customer base and revenue—put Topaz in a leadership position within the market. While other vendors seek to add greater intelligence and automation capabilities to their products, Topaz is taking a different approach, expanding its scope to establish thresholds and understand variations in acceptable thresholds. The Topaz philosophy is consonant with many administrators, who will most likely take a wait-and-see approach to the self-learning capabilities of performance managers. Meanwhile, they will appreciate the expansion of management coverage to new functions, like security, that are mission critical to their corporations.
Hedy Alban began her IT career as a programmer, reconstructing a relational database structure by analyzing hex dumps. Today, she brings to her customers almost two decades of experience in programming, system administration, research analysis and publication development. In addition to managing several publications targeting IT professionals, she has managed the delivery of information services to major vendors in the IT industry. Hedy is a member of the OASIS Web Services Distributed Management Committee.