ABSTRACT
Construction projects become complicated and fragmented so that many specialty contractors are involved. In such changed environments, a general contractor’s overhead costs are increasing comparable to direct costs. In addition to an increase of volume, activities consisting of overhead costs play an important role in coordinating different participants who include different specialty contractors and client.
This paper reviews traditional overhead control and critiques problems thereof through literature review, interviews with professionals, and data collection. It proposes a new overhead cost control method, called profit-point analysis (PPA) applying activity-based costing (ABC). It is followed by a case study presented to exemplify the new method.
KEY WORDS
Construction overhead costs, activity-based costing (ABC), profit point analysis (PPA), nurturing relationship
1 Ph. D. Candidate at University of California at Berkeley, [email protected]
2 Research Director at Lean Construction Institute (LCI) and Associate Adjunct Professor at University
INTRODUCTION
Construction projects become complicated and fragmented so that many specialty contractors are involved. In such altered environments, a general contractor’s overhead costs increase comparable to direct costs. In addition to the increase of volume, activities contributed to overhead costs play an important role in coordinating different participants that include different specialty contractors and client.
However, the construction industry has not changed the method of controlling overhead costs in construction projects. Traditionally, construction overhead uses resource-based costing and volume-based allocation (Kim and Ballard 2001, Holland and Hobson 1999). Resource-based costing is the method in which costs are assigned by each resource, and volume-based allocation is the method of cost allocation in which costs are allocated to cost objects in accordance with the volume of direct labor hours, direct labor costs or contract amount.
This paper criticizes the traditional overhead costing in construction projects and proposes a new costing method as an application of activity-based costing. It is followed a case study to exemplify the new method. The study is confined to the perspectives of a general contractor, who is subcontracting most works. It is noted that numbers regarding a case study are modified because they are confidential to a company.
PROBLEMS IN TRADITIONAL OVERHEAD COSTING
The current method of overhead costing would result in the following problems:
COST DISTORTION HINDERS PROFITABILITY ANALYSIS
Construction projects have different cost codes for each resource such as project engineer or manager. They treat overhead costs separately and do not assign overhead costs to work divisions such as earthwork or to participants such as subcontractors. However, they assign overhead costs to work divisions in proportion to direct labor hours or direct labor costs when owners request the assignment of overhead costs (Sommer 2001). Such volume-based allocation results in cost distortion (Cokins 1996, Johnson and Kaplan 1987, Horngren et al. 1999).
The problem of current practice regarding overhead assignment is that companies do not know real costs for each work division and those for each participants such as subcontractors because either they do not assign overhead costs or they use a uniform cost driver (i.e., direct labor costs) for assignment of overhead costs. Therefore, it is difficult to find where money is being made and lost because progress payments for each work division or building from clients contain overhead costs. In other words managements have difficulty in doing a profitability analysis.
LITTLE MANAGEMENT ATTENTION TO ACTIVITIES OR PROCESSES OF EMPLOYEES
Little management attention is paid to activities or processes since every cost is assigned and reported resource by resource. In other words, little management attention is paid to supporting activities. As a result, managements do not have information on how much resources and what services are provided to participants such as subcontractors. It does not help nurture relationships with the subcontractors.
PROFIT POINT ANALYSIS
This study adopts activity-based accounting (ABC) tool because activity-based costing has been advocated as a means of overcoming the systematic distortions of traditional cost accounting and of bringing relevance back to managerial accounting. It is necessary to review activity-based costing because the proposed method is based on activity-based costing
ACTIVITY-BASED COSTING
Traditional cost accounting has been criticized for cost distortion and the lack of relevance during the last 20 years (Johnson and Kaplan 1987). A traditional system reports where and by whom money is spent on, but fails to report the cost of activities and processes (Miller 1996). Many organizations, including petroleum and semiconductor companies in the manufacturing industry, have adopted the new costing method, activity-based costing (ABC).
There are two purposes of activity-based costing. The first is to prevent cost distortion. Cost distortion occurs because traditional costing combines all indirect costs into a single cost pool. This pool is allocated on the basis of some resource common to all of the company’s products, typically direct labor. Cost distortion is prevented in ABC by adopting multiple cost pools (activities) and cost drivers. The second purpose is to minimize waste or non-value-adding activities by providing a process view. This objective can be achieved by activity analysis and (or) the function of monitoring activities.
PROFIT POINT
This study assumes that contracts between a client and a general contractor, and between a general contractor and subcontractors are fixed cost-based contracts. Suppose there is a general contractor who is using 100% outsourcing (specialty contracting) in performing a project. Project management costs under the assumed condition depend largely on how to manage different subcontractors, each of which performing one or a few work division(s). The suggested overhead costs analysis method would determine the costs (especially, management costs) at each point (we call it “profit point”) where a company and subcontractors are interfaced. This would result in revealing the flow of costs and profits. A profit point is the point where organic relations between the participants are met, rather than neglected. It is noted, though, that the proposed cost analysis model does not take into account the relationship between subcontractors.
PROFIT POINT ANALYSIS
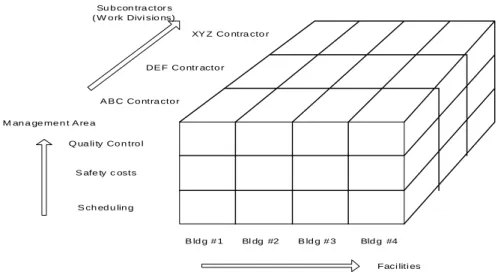
Profitability information compiles from a company’s management activities, which will be collected at “profit points” in a construction site by using an activity form. Then the result of activity analysis is applied to multiple cost objects. In our model, management areas, work divisions / participants, and facilities are regarded as cost objects. Figure 1 shows a three-dimensional cost object in our model from the perspective of a project.
Su b con tra ctor s ( W o rk Divi sio ns) A B C Co ntra cto r DE F Co ntr acto r XY Z Co ntra cto r Q ua li ty Co n tro l S afe ty c osts S ch ed u lin g M an a ge me n t A re a Faci liti es B ld g # 1 Bl dg #2 B ld g # 3 Bld g #4
Figure 1: Multiple Cost Objects
In addition to cost information for work divisions, costs for each management area will also be known. It would give a company insight into the relationship between a company and its subcontractors because management areas such as safety control are the core of a company’s business activities in a project. On the other hand, current accounting systems put every cost information to cost accounts which combine profit points. It might result in preventing a company from understanding the relationship with subcontractors.
A case study was performed to find the usefulness and limitations of this analysis, which is discussed in the following section.
CASE STUDY – SUN MICROSYSTEMS PROJECT PHASE III
PURPOSES
There are three purposes of this case study, which are as follows:
• The case study is to test the feasibility of PPA (profit point analysis),
• The case study is performed to explore difficulties / limitations of implementation, and
• The case study is implemented to find usefulness of PPA results.
METHODS AND PROCEDURES
The case study lets each employee use the new method and collect data from employees. For the purpose of data collection, a database is made using Microsoft Access 2000. As a way to test and validate the new method, a set of information that the new method creates will be presented to several professionals. Then, professionals and researchers will be able to implement a qualitative analysis for evaluating the new method. There are six sequential procedures to meet the purpose of this case study, which are as follows:
• The first step is to identify the current practice with which overhead costs are controlled in the project. In this step we use document collection and interviews with a project manager.
• The next step is to identify the drawbacks that our research is trying to solve with the tool (PPA) to be tested.
• Then as a consultant we give instructions and explanations regarding PPA tool to case study participants.
• Activity forms are to be distributed to participants and participants are required to fill out the forms (Data Collection).
• Data analysis using different queries in MS Access 2000
• The results are discussed with participants, and participants are interviewed on difficulties and improvement areas, etc. (Qualitative Analysis)
PROJECT BACKGROUND
The project selected for the case study is “Sun Microsystems Phase IIIA” located in Newark, CA. Sun Microsystems is one of the leading providers of industrial-strength hardware and services that power the network. The project is to build the office and laboratory center for the client, Sun Microsystems, Inc. Phase IIIA project includes fully completing the three office and laboratory buildings (Building #18, 19, and 20) and all site works. Construction of the three other buildings (Building #21, 22, and 23) will follow this Phase IIIA.
This project is a lump-sum contract and partial Design-Build project in which a contractor, DPR, Inc., is in charge of designing MEP (Mechanical, Electrical, and Plumbing) portions while a separate designer for civil works, KMD, is hired by a client. It is a 18-month project (Nov 2000 - May 2002). The value of change orders is much greater than the original base construction contract values3. It is due to the fact that the design was not completed at the time of contract. Note that numbers on tables are modified because they are confidential.
Results1. Problem Identification
The characteristics of current practice in controlling overhead costs are described as follows:
• Costs are assigned directly to accounts which are resources (employees). • Project overhead costs are not distributed or allocated to different cost objects
such as specialty contractors or work divisions.
• Home office overhead costs are allocated to projects based on the amount of contract. (This information is acquired from the interview with a cost engineer at DPR head office)
The following problems are identified through discussion with managements:
• Even though in altered environments overhead costs have become more important than before, the management of overhead costs, costs for non-production sector, has not been given enough attention. As a result, the function of supporting activities has also not been given enough attention.
• Since the current volume-based allocation of overhead costs does not provide accurate allocation to cost objects such as projects or work divisions, the company hardly gets accurate information on profit relationships with clients and specialty-contractors.
• The cost reports on overhead costs include information on costs for each resources, but lack information on relationship with other project participants such as clients or specialty-contractors.
Results 2. Cost Objects
Three different types of cost objects are set up for the case study: activities, management areas, and work divisions. First, the resources are assigned to activities. Then activities are allocated to two other cost objects.
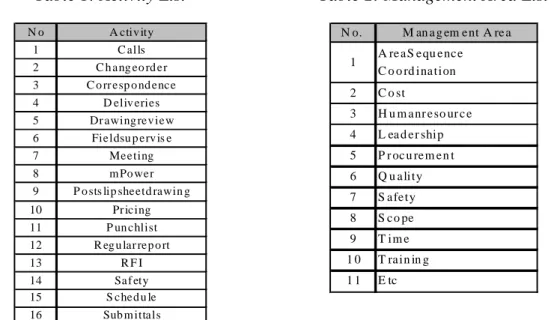
Activities: There are sixteen activities identified via interviews with key personnel. “mPower” is defined as the activity that generates the internal cost accounting system, called “mPower.” “Postnslipsheetdrawing” is defined as the activity that is to post and slip the sheets of drawing. “Regularreport” is defined as the activity that generates weekly and monthly reports to head office and client. “RFI” represents the activity related to receiving, processing, and generating RFI (Request For Information). The activity list shown in Table 1, however, includes the mix of generators of activities and activities themselves. For example, change order, safety, and schedules are the results of activities, which include multi activities such as calls and meeting.
Table 1: Activity List Table 2: Management Area List
N o A ctiv ity 1 C alls 2 C h ang eo rd er 3 C o rr esp o nd ence 4 D eliv eries 5 Dr awing rev iew 6 Fieldsu p erv is e 7 Meeting 8 m Po wer 9 P o sts lip sheetd rawin g 10 Pr icing 11 P un chlist 12 R eg u lar rep o rt 13 R F I 14 Saf ety 15 S ched u le 16 Sub m ittals N o. M an a g em e nt A re a 1 A re a S e qu e nc e C o o rd ina tion 2 C o st 3 H u m a nr e so ur c e 4 L ea d e r ship 5 P r oc u re m e n t 6 Q u a lity 7 S a fe ty 8 S c o pe 9 T im e 1 0 T ra in in g 1 1 E tc
Management Area: First, we set up eight project management functions as indicated in PMBOK (1996). Then we expanded management functions (areas) to eleven (11) management areas or functions including one undefined category. “AreaSequenceCoordination” is defined as a management area relating to coordinating the sequence of operations and area interventions. It is closely related to “Time management” but the management area of “Time management” in this case study is confined to updating the master and 3-week look-ahead schedule. Note that “Safety” is contained in both activity list and management area list.
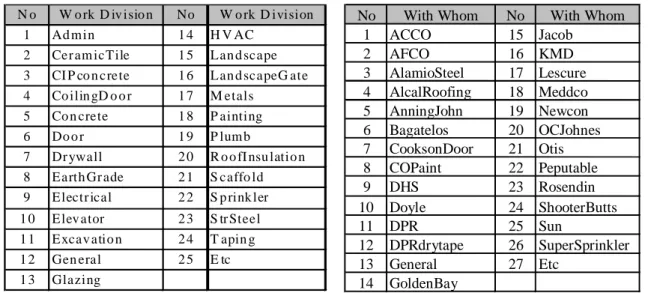
Work Division: Another cost object group, “work division,” indicates the scope of work of the project such as earthwork, electrical, or HVAC. Through discussions with key personnel, we created twenty-five (25) work divisions including one open division. “Admin” in Table 3 is defined as a group of activities relating to work division of an administration.
With Whom: We are concerned about the party with whom DPR resources (overhead) are consumed. This cost object group is called “With Whom” and its costs are called “dealing costs”. The list in Table 4 shows the names of subcontractors, architects, and client.
Table 3: Work Division List Table 4: With Whom List
N o W o rk D iv isio n No W o rk D ivision
1 Ad m in 1 4 H V AC
2 Cer am icTile 1 5 Lan d scape
3 CI P co n crete 1 6 Lan d scapeG ate
4 Co ilin gD o o r 1 7 M etals
5 Co n crete 1 8 P ainting
6 Do o r 1 9 P lum b
7 Dr ywall 2 0 R o o fI nsu latio n
8 Earth Gr ade 2 1 S caffo ld
9 Electr ical 2 2 S p rink ler
1 0 Elev ator 2 3 S tr Steel
1 1 Excav atio n 2 4 T apin g
1 2 Gen eral 2 5 E tc
1 3 Glazing
No With Whom No With Whom
1 ACCO 15 Jacob 2 AFCO 16 KMD 3 AlamioSteel 17 Lescure 4 AlcalRoofing 18 Meddco 5 AnningJohn 19 Newcon 6 Bagatelos 20 OCJohnes 7 CooksonDoor 21 Otis 8 COPaint 22 Peputable 9 DHS 23 Rosendin 10 Doyle 24 ShooterButts 11 DPR 25 Sun 12 DPRdrytape 26 SuperSprinkler 13 General 27 Etc 14 GoldenBay
Results 3. Data Analysis
Table 5: Activity Costs
N o Activity Activ ity C o sts ($ ) Per ce nta ge
1 C alls $ 4 ,1 4 5 .1 2 1 4 %
2 C ha n geo rd e r $ 3 ,2 3 2 .4 0 1 1 % 3 C or re sp o nd e n ce $ 6 ,0 1 2 .8 2 2 0 %
4 Deliver ies $ 6 3 .2 6 0 %
5 D ra win gr evie w $ 2 3 1 .6 6 1 %
6 F ield sup er vise $ 3 ,9 5 4 .2 2 1 3 %
7 M eetin g $ 6 ,5 2 2 .7 9 2 2 % 8 m P o wer $ 1 ,7 3 3 .6 5 6 % 9 Po stslip sh e etd ra w in g $ 2 3 8 .6 5 1 % 10 Pr icin g $ 4 9 .0 3 0 % 11 P u nch list $ 4 3 .9 0 0 % 12 R egu la rr epo rt $ 1 0 8 .8 6 0 % 13 R FI $ 4 1 1 .3 9 1 % 14 S afety $ 8 5 .7 1 0 % 15 Sch edu le $ 7 1 0 .1 8 2 % 16 Su b m ittals $ 2 ,2 1 2 .3 7 7 % T o ta l $ 2 9, 75 6 .0 0 10 0 %
Table 5 shows that meeting and correspondence are major activities, which consume most overhead resources.
Table 6: Management Area Costs
N o . M ana g e m ent A rea M a nag em en t Ar e a
C o sts ( $) P erce n tag e ( % ) 1 A re aSe q u ence C o o rd in atio n $ 6 8 7. 86 2 % 2 C o st $ 7 ,8 2 2. 74 2 6 % 3 H um an r es ou rc e $ 8 1 7. 53 3 % 4 L ea d ersh ip $ 4 7 4. 43 2 % 5 P ro c u re m en t $ 2 ,9 2 1. 97 1 0 % 6 Q uality $ 3 ,9 7 7. 16 1 3 % 7 S afety $ 3 0 9. 55 1 % 8 S cop e $ 8 ,4 6 7. 82 2 8 % 9 T im e $ 1 ,5 2 0. 95 5 % 1 0 T rainin g $ 1 ,1 4 3. 20 4 % 1 1 E tc $ 1 ,6 1 2. 79 5 % T o tal $ 29 , 75 6 .0 0 10 0 %
It is unusual for the scope management to amount to 28 %, and it is due to the peculiarity of the project. Since the drawing is not fixed, DPR should reallocate every scope of work when new drawings come out even though there is a written contract.
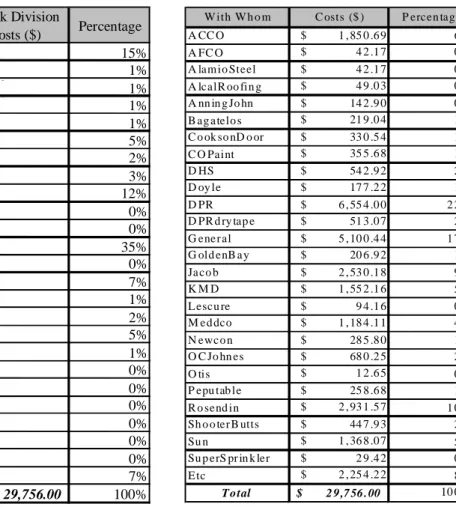
Table 7: Work Division Costs Table 8: Dealing Costs
Work Division Work Division
Costs ($) Percentage Admin $ 15% CeramicTil $ 401 58 1% CIPconcrete $ 28 80 1% CoilingDoor $ 1% Concrete $ 1% Door $ 5% Drywall $ 4 4 2% EarthGrade $ 3% Electrical $ 12% Elevator $ 0% Excavation $ 0% General $ 35% Glazing $ 0% HVAC $ 2 132 32 7% Landscape $ 1% LandscapeGate $ 2% Metals $ 1 440 0 5% Painting $ 1% Plumb $ 94 16 0% RoofInsulation $ 49 03 0% Scaffold $ 0% Sprinkler $ 0% StrSteel $ 0% Taping $ 21 09 0% Etc $ 7% Total $ 29,756.00 100%
W ith W h o m C osts ($ ) P ercen tag e A CC O $ 1 , 85 0 .6 9 6 % A FC O $ 4 2 .1 7 0 % A lam io Steel $ 4 2 .1 7 0 % A lcalR oo fin g $ 4 9 .0 3 0 % A nn in g Jo hn $ 14 2 .9 0 0 % B ag a telo s $ 21 9 .0 4 1 % C o ok so nD o or $ 33 0 .5 4 1 % C O Paint $ 35 5 .6 8 1 % D HS $ 54 2 .9 2 2 % D oy le $ 17 7 .2 2 1 % D PR $ 6 , 55 4 .0 0 2 2 % D PR d ry tap e $ 51 3 .0 7 2 % G ene r al $ 5 , 10 0 .4 4 1 7 % G old enB a y $ 20 6 .9 2 1 % Ja co b $ 2 , 53 0 .1 8 9 % K M D $ 1 , 55 2 .1 6 5 % L escu re $ 9 4 .1 6 0 % M e d dco $ 1 , 18 4 .1 1 4 % N ewc o n $ 28 5 .8 0 1 % O C Jo hn es $ 68 0 .2 5 2 % O tis $ 1 2 .6 5 0 % P epu tab le $ 25 8 .6 8 1 % R o send in $ 2 , 93 1 .5 7 1 0 % Sh o o ter B utts $ 44 7 .9 3 2 % Su n $ 1 , 36 8 .0 7 5 % Su p erS pr in k ler $ 2 9 .4 2 0 % E tc $ 2 , 25 4 .2 2 8 % To tal $ 2 9 ,7 56 . 00 10 0 %
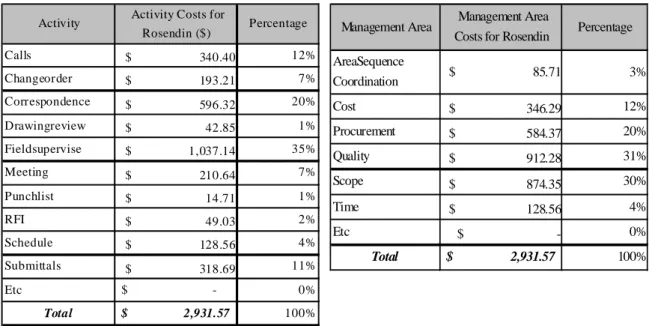
Overhead costs for ACCO and Rosendin are analyzed in Tables 9 to 12 since they are the major subcontractors consuming most of overhead resources of DPR as shown in Table 8.
Table 9: Activity Costs for ACCO Table 10: Management Area Costs for ACCO
Activity Activity Co sts P ercen tag e
C alls $ 533 .86 29 %
C hag eo rd er $ 21 .09 1 %
C o rrespo nden ce $ 385 .69 21 %
D rawin greview $ 42 .85 2 %
Field sup erv ise $ 674 .70 36 %
M eetin g $ 171 .42 9 %
mP ow er $ 21 .09 1 %
Etc $ - 0 %
Total $ 1,850.69 1 00%
Management Area Managem ent Area
Cost for ACCO ($) Percentage AreaSequenceCoo-rdination $ 85.71 5% Cost $ 127.88 7% Quality $ 439.62 24% Scope $ 897.50 48% Time $ 257.12 14% Etc $ 42.85 2% Total $ 1,850.69 100%
Table 11: Activity Costs for Resendin Table 12: Management Area Costs for Rosendin
Activity Activity Costs for
Rosendin ($) Percentage Calls $ 340.40 12% Changeorder $ 193.21 7% Correspondence $ 596.32 20% Drawingreview $ 42.85 1% Fieldsupervise $ 1,037.14 35% Meeting $ 210.64 7% Punchlist $ 14.71 1% RFI $ 49.03 2% Schedule $ 128.56 4% Submittals $ 318.69 11% Etc $ - 0% Total $ 2,931.57 100%
Management Area Management Area
Costs for Rosendin Percentage
AreaSequence Coordination $ 85.71 3% Cost $ 346.29 12% Procurement $ 584.37 20% Quality $ 912.28 31% Scope $ 874.35 30% Time $ 128.56 4% Etc $ - 0% Total $ 2,931.57 100%
Results 4. Time Consumed for New Cost Analysis Tool
Five participants answered the question on required time for this new tool. The average duration was 10.8 min. Discussion with participants revealed that the new tool (activity analysis) did not give additional burden on employees psychologically.
Results 5. Positives of New Cost Analysis Tool
For identifying the positives of this tool, a researcher explained the output data (Table 5 to Table 12). Then a meeting was held for discussing the advantages and limitations of this tool, the results of which are discussed in this and the following section. The positives are as follows:
[1] Data will be used for evaluation of subcontractors who are providing similar services for a general contractor under similar project conditions. The data can be used for future subcontractor selection.
Under similar project condition, the ratio of subcontract amount to the overhead costs can be an indicator. However, analysis of components consisting of overhead costs compared with others provides more meaningful indicators than the ratio comparison.
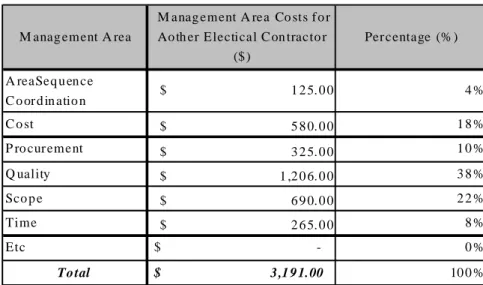
Suppose that one electrical subcontractor working with DPR under similar project has PPA results as below.
Table 13: Average Management Area Costs for Contractor “A” Under Similar Condition
M anag ement A rea
M anag ement A rea Co sts f o r Ao th er E lectical C on tracto r ($ ) Per centage (% ) A reaSeq u en ce C o or d in atio n $ 1 2 5. 0 0 4 % C o st $ 5 8 0. 0 0 1 8 % P ro cur ement $ 3 2 5. 0 0 1 0 % Q uality $ 1 ,2 0 6. 0 0 3 8 % Sco p e $ 6 9 0. 0 0 2 2 % Time $ 2 6 5. 0 0 8 % Etc $ - 0 % To tal $ 3 ,1 9 1.00 10 0 %
Comparing Table 13 with Table 12 would give an idea as to performance of Rosendin as follows:
Suppose the monthly average subcontract amount (direct costs) of contractor A is $97,000 and that of Rosendin is $108,000. The ratios of direct costs to overhead costs (personnel costs only) are as follows:
Table 14: Comparison of ratio of direct costs to overhead costs
C on tr ac tor s M onthly D ire ct Co sts M on th ly O v erh ea d R atio Ro s end in $ 108 ,0 00 .0 0 $ 2,9 31.57 2.71% Co ntra c to r "A " $ 97 ,0 00 .0 0 $ 3,1 91.00 3.29%
The contractor “A” requires more overhead resources than Rosendin under the assumption that project conditions are almost identical.
[2] PPA results would give the management the insight into the performance of subcontractor if components were analyzed.
The comparison of two PPA results (Table 12 and Table 13) would tell the management that contractor “A” requires more resources on procurement than Rosendin. It would trigger exploration into the reason. The investigation, for example, would reveal that contractor “A” submitted submittals, which do not include the details of suppliers, which make it necessary for DPR personnel to get additional information. Such change of manner in which procurement submittal is made would reduce DPR resource input for procurement. The PPA results, as seen in the scenario, would pinpoint the area to be investigated for improving the profitability relationship.
[3] The detailed cost data resulting from this analysis will be used for fee negotiation for an additional work. With traditional overhead costs reporting overhead costs for additional work scope is usually determined by the ratio of direct costs to the overhead cost for the entire project.
[4] The fact that employees are required to fill out activity forms forces them to work more efficiently.
[5] The data will be used to convince clients to select a specific subcontractor especially when clients have different preferences in selecting specialty contractors rather than a general contractor.
[6] The data would be used for bidding the future project using specific subcontractors since they can have more specific cost data for each subcontractor.
Results 6. Limitations or Area for Improvement
The following problems were identified through discussions with participants.
[1] Even though the performance of a specialty contractor does not change, overhead costs might differ depending on the personnel in charge. A project manager who interviewed the authors mentioned that if an experienced HVAC coordinator was replaced by a less experienced one, the overhead costs would increase.
Therefore one strong assumption for PPA analysis is that salary or wage reflects the experience and ability of personnel. For example, $2,000 salary scheduler is twice as efficient as $1,000 salary scheduler.
[2] One activity such as phone calling can be involved with several management areas. In our study, 10 min is assumed to be dedicated to quality and 10 min to procurement in case a 20 minutes phone call is made for quality and procurement.
[3] Several costs objects overlap. The form itself is problematic. Some participants, for example, indicated that area sequence and scheduling are somewhat superimposed.
[4] There are environmental factors that partially determine the level of efforts required in the work of construction management staff. Among these factors quality in documentation is very important. Other factors are not examined in this case study.
CONCLUSION
This paper described the new overhead cost analysis tool and the results of the case study under the situation where most works are subcontracted. “Multi-cost objects” is one of characteristics of the tool. A case study revealed that the new analysis is feasible on actual construction projects and has many positives with some limitations. It is noted that the proposed method can be applied in the same manner to analysis of home office overhead costs to be allocated to multi projects. Important is that the new tool can pinpoint the area to be investigated for improving the profitability relationship. It can be construed as a tool for nurturing relationship as opposed to having a quantitative target as a motivation.
ACKNOWLEDGEMENTS
The authors gratefully acknowledge the contribution of the DPR, Inc and its participants in the case study project for the invaluable input into this paper by courageously implementing the new method to a real project.
REFERENCES
Cokins, G. (1996). Activity-based cost management making it work: a manager's guide to implementing and sustaining an effective ABC system, Irwin Professional Publishing, Burr Ridge, IL.
Holland, N. and Hobson, D. (1999). “Indirect cost categorization and allocation by construction contractors.” Journal of Architectural Engineering, ASCE, 5(2) 49-56.
Horngren, C.Y., Foster, G. and Datar, S. M. (1999). Cost Accounting, 10th edition, Prentice Hall, Upper Saddle River, NJ, 906pp.
Johnson, T. and Kaplan, R. (1987). “Rise and Fall of Management Accounting.” Management Accounting, IMA, January, 22-30.
Kim, Y. and Ballard, G. (2001). “Activity-Based Costing and its Application to Lean Construction”, Proceedings of the 9th Annual Conference of the International Group for Lean Construction, Singapore.
Miller, J. A. (1996). Implementing activity-based management in daily operations, John Wiley & Sons, New York, NY.
Sommer, B. (2001). Personal Communication, DPR Construction, Inc., Redwood City, CA.