Employee Performance Management
The Alpha and the Omega of Talent Strategy and Business Execution
May 2010
© 2010 Aberdeen Group. Telephone: 617 854 5200
Executive Summary
Research Benchmark
Aberdeen’s Research Benchmarks provide an in-depth and comprehensive look into process, procedure, methodologies, and
technologies with best practice identification and actionable recommendations
In April and May 2010, Aberdeen surveyed nearly 400 organizations worldwide regarding their Employee Performance Management (EPM) initiatives. The study showed that although organizations are optimistic about a recovering economy, growth in the short term will be achieved through efficiencies and not through headcount. Aligning individual efforts with the goals of the organization will play an integral role in achieving this growth. Incorporating individual goals, standardizing the employee
performance process, and leveraging employee performance data across talent management elements will pay huge dividends. Making performance part of the organizational culture specifically via visibility, accountability and regular communications emerged as key capabilities that earned Best-in-Class top performance.
Best-in-Class Performance
Aberdeen used the following three key performance criteria to distinguish Best-in-Class companies:
• 81% of employees indicate they are engaged, compared to 38% of Laggards
"Companies need to align individual goals to strategic initiatives and set expectations and priorities. This is further reinforced by developing objective metrics that clearly demonstrate how performance will be evaluated. Periodic progress status checks are important. There must also be flexibility to adjust goals when corporate decisions are made that are outside of the individual's control."
~ Ann M. Spoleti, Director, Center for Organizational & Leadership Effectiveness, New York Presbyterian Hospital
• 58% of employees exceed performance goals or expectations, compared to 17% of Laggards
• 22% improvement in customer satisfaction since last measured, compared to 2% decrease for Laggards
Competitive Maturity Assessment
Survey results show that the organizations enjoying Best-in-Class status shared several common characteristics, including:
• Automating manual workflows to simplify the process and increase buy-in and participation from front-line and mid-level managers • Making performance management a part of the organization's
culture rather than a once a year review
• Using employee performance data to build a competency framework based on top performers
Required Actions
In addition to the specific recommendations in Chapter Three of this report, to achieve Best-in-Class performance, companies must:
• Link performance to learning, development and succession • Establish accountability among managers and employees to ensure
that the process is conducted accurately and goals are tracked • Regularly review the impact of EPM initiatives at least annually
Table of Contents
Executive Summary...2
Best-in-Class Performance...2
Competitive Maturity Assessment...2
Required Actions...2
Chapter One: Benchmarking the Best-in-Class ...4
Business Context ...4
The Maturity Class Framework...7
The Best-in-Class PACE Model ...8
Chapter Two: Benchmarking Requirements for Success ...12
Competitive Assessment...12
Capabilities and Enablers...14
Chapter Three: Required Actions...21
Laggard Steps to Success...21
Industry Average Steps to Success ...22
Best-in-Class Steps to Success...23
Appendix A: Research Methodology...25
Appendix B: Related Aberdeen Research ...27
Figures
Figure 1: Pressures Driving Employee Performance Management...4Figure 2: Top Strategic Actions ...6
Figure 3: Variable Performance-Based Compensation...11
Figure 4: Individual Understanding of Performance Impact ...14
Figure 5: Targeted Learning for Low Performers ...16
Figure 6: Top Sources of Competency Definitions...17
Figure 7: Performance Data Integration Pre- and Post-Hire...18
Figure 8: Most Valuable Elements of EPM Systems...20
Tables
Table 1: Top Performers Earn Best-in-Class Status...7Table 2: The Best-in-Class PACE Framework ...8
Table 3: Impact of Effective Goals Management Strategy...9
Table 4: The Competitive Framework...13
Table 5: The PACE Framework Key ...26
Table 6: The Competitive Framework Key ...26
Table 7: The Relationship Between PACE and the Competitive Framework ...26
© 2010 Aberdeen Group. Telephone: 617 854 5200
Chapter One:
Benchmarking the Best-in-Class
Business Context
Fast Facts
√ 91% of organizations have
a process to appraise, evaluate and / or manage employee performance
√ 86% of organizations
include individual goals in performance management process for all or some employees
√ 85% of organizations have
some sort of performance-based variable (non-sales) compensation
Aberdeen's Economic Outlook 2010 report found that 68% of organizations surveyed expect the economy to recover by Q3 2010, and as a group, anticipate revenue growth of 10.5% in 2010 over 2009. But in the same time period, average headcount was expected to grow only 4.3%. This is a sign that recovery will be slow and organizations of all sizes will have to really balance short-term efficiency without losing sight of future growth. It is also a sign of growth through efficiencies. The key to this balance is to align individual performance with the business objectives of the organization. Consequently as the goals of the organization change and the business landscape shifts to a growth environment, individuals that are aligned with these goals quickly adapt by spending minimal effort on wasted activities and ensuring their contribution still impacts the objectives of the organization. From a talent management perspective, Employee Performance Management (EPM) is the necessary factor that maintains and improves this alignment.
Pressures and Challenges
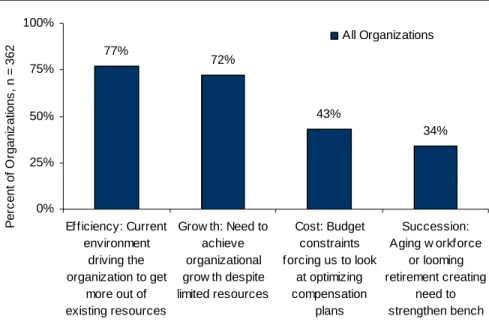
Of nearly 400 human resources and line of business executives surveyed by Aberdeen in April and May 2010, nearly three quarters indicated two seemingly contradictory factors among the primary drivers of their
organization's current EPM efforts: efficiency and growth (Figure 1). Both of which scream a single unified message; we need to get more from what we currently have.
Figure 1: Pressures Driving Employee Performance Management
77% 72% 43% 34% 0% 25% 50% 75% 100% Efficiency: Current environment driving the organization to get more out of existing resources Grow th: Need to achieve organizational grow th despite limited resources Cost: Budget constraints forcing us to look at optimizing compensation plans Succession: Aging w orkforce or looming retirement creating need to strengthen bench P er c ent o f O rgani z ati ons , n = 362 All Organizations
In addition, and worthy of noting, among the top three drivers responding organizations indicated were driving their EPM efforts were the need to control costs as well as coping with the looming retirements of the labor market's largest segment - the baby boomers. This is still consistent with the 2009 study on Employee Performance Management when cost topped the list as 53% of organizations surveyed cited it as a top two pressure. What can be inferred from this is that while costs have already been squeezed out of the system of many organizations, companies are still seeking to align compensation with performance so as to reward the performance it seeks as well as compensate those the company wants to retain and keep motivated.
However, the emphasis on the aging workforce is coming squarely back into focus. In 2009, only 15% ranked it as a primary pressure driving their EPM efforts, as compared to 34% of this year's survey respondents. This can be attributed to two factors: One, looming retirements in key positions are becoming more of an issue and organizations must really be concerned about the longevity in leadership positions. And two, they are looking to performance management to solve this issue; and as we will show in the analysis, identifying high performers, tagging them for succession or building competency models based on their profiles are tools to strengthen the succession bench.
Internally, when asked about the top two challenges that hinder EPM efforts, more than half of the organizations surveyed (54% of all respondents) cited the lack of follow up between managers and employees regarding progress against goals and performance expectations as a top two challenge followed by
difficulty communicating the organization's strategy (38%) and too much reliance on manual processes (34%). The former is critical especially when it comes to employee engagement. In the July 2009 report, Employee Engagement, 83% of Best-in-Class organizations ensure regular, informal feedback sessions with progress towards goals - compared to just 60% of Laggards. The latter makes it tactically difficult for organizations to gain buy-in from managers as the process becomes perceived as time-consuming and provides low value to employees and the organization.
Strategic Actions
In order to increase buy-in and establish accountability, organizations are striving to make performance part of their cultural fabric. Nearly half of these organizations (44%) are creating an ongoing performance management mindset within the organization (Figure 2). We all hear that at the time of the formal annual appraisal, there should be no surprises, and managers and supervisors play an instrumental role in communicating expectations to the employees and regularly have informal conversations about performance and development.
© 2010 Aberdeen Group. Telephone: 617 854 5200
Figure 2: Top Strategic Actions
44% 30% 29% 28% 0% 10% 20% 30% 40% 50% Create an ongoing performance management mindset or culture Hold managers accountable f or performance of their direct reports
Standardize employee performance ratings across the
enterprise Build a performance-based competency framew ork P er c ent of O rgani z at ions , n = 262 All Organizations
Source: Aberdeen Group, May 2010 For many organizations, one of the biggest challenges in creating a Best-in-Class performance management system is finding a way to turn the performance review process from an unfortunate distraction on the
calendar to something that is deeply valued and closely adhered to. In order to accomplish this, organizations are focusing on two primary strategies – making performance management a consistent, behind-the-scenes process and placing accountability in the right hands. If all the company has is a series of annual or semi-annual performance reviews, which is most often the case, too many teachable moments are able to fall through the cracks. Not only should goals be a common topic of discussion and personal introspection, but performance is much more accurately assessed when evaluated in real-time rather than on a scheduled basis. Accomplishing this, however, requires that the stakeholders are deeply interested and held directly accountable. This is where the manager comes in, not only as a source of objective performance evaluation but as a champion in reinforcing the value of performance-oriented dialogue as an important use of time.
Individual Performance Goals
In last year's study, Employee Performance Management: Individual Goals Boost Satisfaction Inside and Out, Aberdeen found that incorporating individual goals in the EPM strategy is critical to aligning individuals with the
organizational objectives. Looking at this year's study, it is good news to see that 86% of organizations currently do so; this is relatively consistent with last year when we found 90% did so. Again we found the key to this is to implement a successful EPM strategy that is based on cascading
organizational goals down to the individual level by introducing employees to goals as soon as they are hired or promoted, include all employee populations in the performance management and goal setting process, and standardize the appraisal process. The next section will provide illustration
and analysis of how Best-in-Class organizations execute goals management strategies and how they use performance data to build a sound competency framework based on employee performance. Ultimately, the goal is to develop employees into high performers based on a set of competencies that reflect the goals of the organization.
The Maturity Class Framework
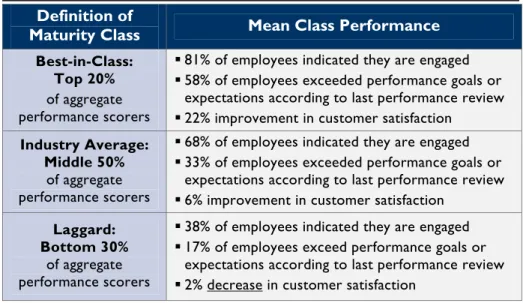
Aberdeen used three key performance criteria to distinguish the Best-in-Class from Industry Average and Laggard organizations. Only organizations with a current employee performance management process or initiative were benchmarked:
• Employee engagement is defined as the number of employees who indicated they are "engaged" based on the organization's rating. In previous research on employee engagement, Aberdeen found a strong correlation between high engagement and increased business results (revenue, profit, and productivity).
• Employee performance is defined as the number of employees who received a rating of "exceeds expectations" as of their latest performance review. This is an indicator of how well organizations are able to align individuals' efforts with the work that the
organization is expecting of them.
• Customer satisfaction is defined as the percentage improvement in client satisfaction since it was last measured. Ultimately, talent management initiatives should show the impact on the business and customer satisfaction is a good indicator.
These three elements in combination look at how Best-in-Class companies adopt performance-driven culture where the entire workforce focuses its efforts on achieving outcomes set forth by the business.
Table 1: Top Performers Earn Best-in-Class Status
Definition of
Maturity Class Mean Class Performance
Best-in-Class: Top 20%
of aggregate performance scorers
81% of employees indicated they are engaged
58% of employees exceeded performance goals or expectations according to last performance review
22% improvement in customer satisfaction
Industry Average:
Middle 50%
of aggregate performance scorers
68% of employees indicated they are engaged
33% of employees exceeded performance goals or expectations according to last performance review
6% improvement in customer satisfaction
Laggard:
Bottom 30%
of aggregate performance scorers
38% of employees indicated they are engaged
17% of employees exceed performance goals or expectations according to last performance review
2% decrease in customer satisfaction
© 2010 Aberdeen Group. Telephone: 617 854 5200
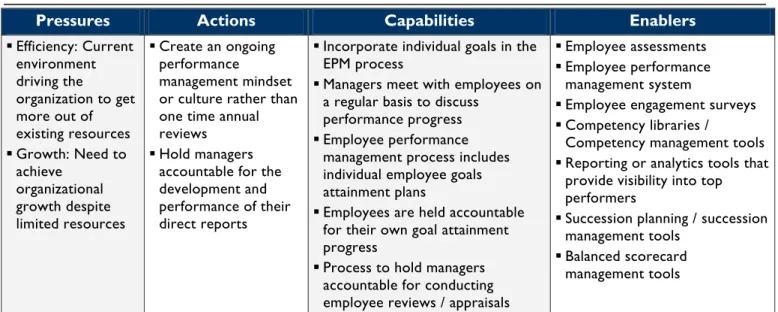
The Best-in-Class PACE Model
Aberdeen data has shown an effective EPM process must incorporate individual goals. In addition, organizations must combine strategic actions, capabilities, and technologies to supplement any EPM effort to ensure proper execution and results. Key elements include:
• Make performance management a part of the organization's culture rather than a once a year review
• Establish performance management process accountability for employees and managers, and extend that accountability to include achievement of agreed upon goals
• Use employee performance data to build a competency framework based on top performers, and integrate it with other areas of talent management
• Automate manual workflows to simplify the process, which will increase buy-in and participation from front-line and mid-level managers
Table 2: The Best-in-Class PACE Framework
Pressures Actions Capabilities Enablers
Efficiency: Current environment driving the organization to get more out of existing resources Growth: Need to achieve organizational growth despite limited resources Create an ongoing performance management mindset or culture rather than one time annual reviews
Hold managers accountable for the development and performance of their direct reports
Incorporate individual goals in the EPM process
Managers meet with employees on a regular basis to discuss
performance progress
Employee performance management process includes individual employee goals attainment plans
Employees are held accountable for their own goal attainment progress
Process to hold managers accountable for conducting employee reviews / appraisals
Employee assessments
Employee performance management system
Employee engagement surveys
Competency libraries /
Competency management tools
Reporting or analytics tools that provide visibility into top performers
Succession planning / succession management tools
Balanced scorecard management tools
Source: Aberdeen Group, May 2010
Best-in-Class Goals Management Strategies
Incorporating individual goals or Key Performance Indicators (KPIs) within the employee performance management process is no easy task. In 2009, Aberdeen found that the key is to adopt a Specific, Measurable, Attainable, Relevant, and Time-bound (SMART) goal approach. The following list illustrates where to start and how to proceed:
• First, each organization must look at its objectives at a high level, cascade these goals to each business unit, department, team and
Fast Facts
√ 70% of Best-in-Class
organizations introduce employees to performance goals within first month on the job
√ 100% of Best-in-Class
organizations have formal employee reviews at least annually or on a per project basis
√ 59% of Best-in-Class
organizations have informal reviews with employees at least annually and another
37% do it on an ad-hoc basis (as needed)
ultimately the individual. This is an uneasy task as 38% of organizations in the survey indicated difficulty communicating the organization's strategy a top two challenge that hampers EPM efforts. • The next step is to ensure that goals are cascaded to all employees
in all departments. Not only does this ensure alignment but also it increases accountability and buy-in, and ultimately engagement. Aberdeen showed in the 2009 benchmark report on Employee Engagement that engaged employees in Best-in-Class organizations have visibility into company objectives and understand how their individual contributions impact these goals. This goes well beyond satisfaction - which is defined as the needs of the employees being met through their affiliation with the organization.
• After individual goals have been defined for all employees or roles, the organization must ensure that these goals are communicated and agreed to by the employee and/or the new hire and their managers. The key here is to ensure that this happens as early in the review cycle as possible or, in case of newly-hired or promoted employees, within the first month on the job.
• The next step is to standardize the employee performance
management process by defining a consistent scoring methodology, the frequency of formal reviews (annual, mid-year etc.), the
frequency of informal conversations, who the stakeholders are that must participate, and how long it should take a manager to
complete it.
"A successful performance management initiative requires buy-in across the board, transparency, and clearly defined expectations and goals."
~ Lisa M. Sax, Director of Corporate and Community Partnerships, Empire State College, State University of New York Nearly 40% of Best-in-Class organizations have the above elements in place
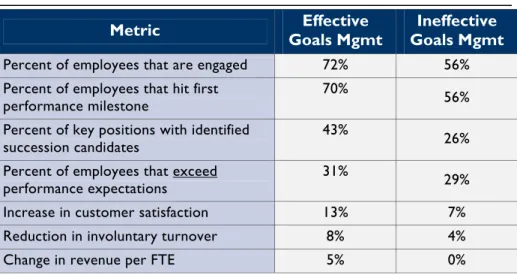
compared to just 28% of Laggards. Aberdeen data from this study shows that organizations that follow the aforementioned strategy of effective goals management are 72% more likely to achieve Best-in-Class than those that don't, and the performance figures in Table 3 clearly reaffirm this fact.
Table 3: Impact of Effective Goals Management Strategy
Metric Goals Mgmt Effective Goals Mgmt Ineffective Percent of employees that are engaged 72% 56% Percent of employees that hit first
performance milestone 70% 56%
Percent of key positions with identified
succession candidates 43% 26%
Percent of employees that exceed
performance expectations 31% 29%
Increase in customer satisfaction 13% 7%
Reduction in involuntary turnover 8% 4%
Change in revenue per FTE 5% 0%
© 2010 Aberdeen Group. Telephone: 617 854 5200 Case Study — Provider of Bio-Polymer Products
Take the case of a Midwest US-based provider of renewable bio-polymer products. A subsidiary of a larger parent, the company, headquartered in Minnetonka, MN, employs 100 full-time employees with manufacturing facilities located in Nebraska and commercial sales resources located across Europe and the Asia-Pacific markets.
In October 2008, the HR team looked at the existing Employee Performance Management (EPM) process and found that it was
inconsistent, very manual, paper-based, and cumbersome. According to the Human Resources Director, “We knew we needed to make it a priority to revamp this process. We wanted to devise a process that more clearly connected individual goals to the organization’s business targets, and supported the performance coaching and assessment discussions between managers and their direct reports.”
The team began by developing a people strategy that truly aligned with the corporate strategy – employee performance management was a huge part of it. They then ensured that employees and contractors have access to the company intranet so when performance appraisals were due, every employee, regardless of their geographic location, could log on and exchange ideas and feedback electronically. “Usability by managers and employees and the ability to deploy the system quickly and easily were key factors in evaluating the solution,” said the HR Director. “From a change management standpoint, ease of use is critical in breaking the barriers of adoption.”
Lastly, the team formalized the reviews annually (including incorporating individual goals and adopting a multi-rater review process) and
supplemented them with mid-year reviews to ensure feedback continues regularly rather than having these dialogues once a year. Since this initiative is fairly new to the company, metrics have yet to be tracked. However, the program and the enabling solution have been well received by the managers since day one of the rollout.
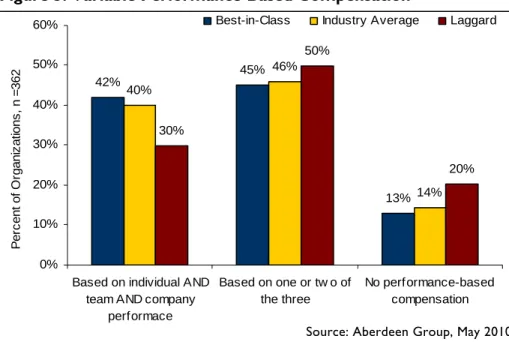
Performance-Based Compensation
Currently, less than half of the organizations in our sample (49%) have a variable compensation plan that is tied to performance goals for all
employees. Another 36% stated that they have it for some groups. The good news is that regardless where an organization falls in the Maturity Class, most have some form of performance-based compensation in place. This study shows that 42% of Best-in-Class organizations ensure that they incorporate individual performance, team performance, and company performance in an employee's compensation plan, compared to 30% of Laggards. Having all three reinforces alignment and provides visibility to the employees as to where their contribution stands, how the team is performing and what contribution is made to the company - all keys to increasing engagement.
Figure 3: Variable Performance-Based Compensation 42% 45% 13% 40% 46% 14% 30% 50% 20% 0% 10% 20% 30% 40% 50% 60%
Based on individual AND team AND company
performace Based on one or tw o of the three No performance-based compensation P er c ent of O rgani z at ions , n = 362
Best-in-Class Industry Average Laggard
Source: Aberdeen Group, May 2010 Aberdeen Insights — Strategy
Employee performance management is part of the foundation for an effective overall talent management strategy and practice. Executing a Best-in-Class EPM strategy requires several key steps that start with building a performance-oriented culture across the entire enterprise. To establish this culture, senior executives must be bought into the
importance of a formal performance management process. Then, as we uncovered in last year's research, organizations must focus on
standardizing the process and incorporating individual performance goals. This cascading of individual goals has proven, year over year, to be a critical success factor among top performing companies.
In the next chapter, Aberdeen will highlight the key capabilities needed to implement an employee performance management strategy that supports other elements of talent management both pre-hire and post-hire.
© 2010 Aberdeen Group. Telephone: 617 854 5200
Chapter Two:
Benchmarking Requirements for Success
Fast Facts
√ 50% of Best-in-Class
organizations integrate employee performance data with other elements of talent management compared to 37% of the Industry Average and 28% of Laggard organizations
√ More than two thirds of
Best-in-Class organizations
indicated satisfaction with current EPM process compared to 58% of Industry Average and 54% of Laggard organizations
Best-in-Class organizations understand that employee performance and competency management go hand-in-hand. Standardizing the process, automating manual workflows, and leveraging data across all talent management phases can yield tremendous gains across the board.
Case Study — Hellmann Worldwide Logistics
Two years ago, Hellmann Worldwide Logistics, Inc. (USA), a division of one of the world’s largest logistics providers, identified employee performance management as a critical pain-point of the business. According to Ken Finneran, Chief People Officer - Americas, “Our existing EPM system was paper-based and relatively isolated. Results weren’t tied to any other aspects of talent management, and were solely used to identify performers and inform bonus decisions. This was an area where we saw an opportunity to make major improvements.”
In order to create a performance system that helped to replicate success, rather than just identify it, Hellmann started with its new competency model. By looking at the capabilities and core behaviors of top
performers, the company was able to build a values-based competency framework that linked to business outcomes and served as an indicator of performance and potential. Explains Finneran, “We were able to get a great deal of value by taking a competency-based approach. Not only was our model used to determine appropriate developmental goals for each individual, but we were able to assess competencies for all employees globally based on a common language and integrate that data into our ERP system.”
By assessing against performance- and values-based competencies rather than just deliverables, Hellmann was able to not only identify high performers, but also to evaluate employees’ development potential within the organization. This allowed for learning to be assigned that would help to close performance gaps and replicate top performance across the company. In addition to serving as the basis for development, the competency model also served as a link between performance and other talent management functions such as succession planning, compensation and rewards, and even recruitment. Today, Hellmann views competencies as a key element of its performance management process and is seeking to improve upon its success by making the process leaner and continuing to update the components to be relevant,
impactful, and transferable across the organization.
Competitive Assessment
Aberdeen Group analyzed the aggregated metrics of surveyed companies to determine whether their performance ranked as Best-in-Class, Industry
Average, or Laggard. In addition to having common performance levels, each class also shared characteristics in five key categories: (1) process (the approaches they take to execute daily operations); (2) organization
(corporate focus and collaboration among stakeholders); (3) knowledge management (contextualizing data and exposing it to key stakeholders); (4)
technology (the selection of the appropriate tools and the effective
deployment of those tools); and (5) performance management (the ability of the organization to measure its results to improve its business). These characteristics (identified in Table 4) serve as a guideline for best practices, and correlate directly with Best-in-Class performance across the key metrics.
Table 4: The Competitive Framework
Best-in-Class Average Laggards
Process that enables managers to assign individual goals to employees and link them to organizational goals
69% 61% 49%
Process to create development plans and assign learning as part of or based on the performance review
Process
56% 48% 43%
Employees are held accountable for their own goal attainment progress
78% 72% 66%
Managers are held accountable for employee’s goal attainment
Organization
64% 56% 47%
Competencies of top performers are defined for each job role
Knowledge
50% 32% 22%
Enablers used to support and execute EPM strategy:
Technology 73% employee assessments 62% employee engagement surveys 36% competency libraries / competency management tools 34% reporting or analytics tools 31% balanced scorecard management tools 70% employee assessments 58% employee engagement surveys 30% competency libraries / competency management tools 34% reporting or analytics tools 23% balanced scorecard management tools 66% employee assessments 41% employee engagement surveys 26% competency libraries / competency management tools 28% reporting or analytics tools 14% balanced scorecard management tools Impact on business metrics is reviewed at least annually
Performance
68% 55% 47%
© 2010 Aberdeen Group. Telephone: 617 854 5200
Capabilities and Enablers
In order to better align individual performance with corporate objectives, it is imperative to ensure employees clearly understand how their
performance impacts business outcome. In the 2009 study, we established that employees in Best-in-Class organizations are more apt to be aligned with corporate objectives (Figure 4). As goals and objectives move out from the individual, goal alignment becomes harder to achieve.
Figure 4: Individual Understanding of Performance Impact
98% 100% 97% 84% 92% 85% 72% 56% 0% 20% 40% 60% 80% 100% Contributes to individual success Contributes to team's success Contributes to business unit's success Contributes to company success P er c ent o f O rgani z a tions , n= 3 31
Best-in-Class All Others
Source: Aberdeen Group, June 2009 This chapter, in addition to highlighting crucial capabilities to provide this visibility, increase alignment, and foster accountability, will show how Best-in-Class organizations utilize performance data to make critical talent management decisions - both pre- and post-hire - to improve recruitment, onboarding, development, and succession management initiatives across the enterprise.
"Executive level commitment is essential to the process, as well as holding managers
accountable for the
development and engagement of their employees, establishing success profiles for all positions (not just the higher-level positions), and hiring /
developing individuals based on those profiles. Supporting this should be assessments to determine skill gaps and a supporting system that is transparent and easy to use."
~ Betsy C., SPHR, Fortune 500 Utility Company
Organization
From an organizational management standpoint, this year's data reinforces last year's findings that it all boils down to accountability. From the entry-level employee to the upper-most layer of the organization, accountability for attaining these goals should be implemented on tactical and strategic levels. If individuals aren't held accountable for their own performance, it becomes difficult to monitor progress, and there will be no incentive to produce results for the company.
Just like the employee must be responsible for their own goals, the manager must also be deeply involved. This is especially true when goals and key performance indicators are cascaded down from the manager-level to team members. An employee's goals should not only be top of mind, but also should be closely linked to company objectives. The manager, due to their broader perspective on the goals of the company, is instrumental in
reinforcing the value of these goals and reiterating their importance on a larger scale through this feedback. The manager also must act as a
motivator, confidante, and disciplinarian in keeping the employee focused on their performance against those goals.
Another key to achieving individual accountability are informal reviews. Aberdeen found that 81% of Best-in-Class organizations have their managers meet with employees on a regular basis to have these performance
discussions compared to just 66% of Laggards. This supports the top strategic action highlighted earlier in Figure 2 of this report: to create an ongoing performance management culture or mindset.
Tactically, accountability not only ensures that reviews are completed on time, but it also ensures that the data in the reviews is accurate and can indeed be used to make performance-driven decisions pertaining to learning, career development, promotion and even terminations. To this point, Aberdeen found that 78% of Best-in-Class organizations formally hold managers accountable to conduct and complete appraisals on time for their entire teams.
Process
Aberdeen's December 2009 report on Integrated Talent Managementfound that the best way to maximize employee contribution without hiring or increasing compensation is to ensure alignment between the effort/output of the individual and the goals of the organization. In other words, are individual goals designed to allow employees to have the greatest impact on the company? As we showed in last year's study and again in Chapter One of this report, an effective goals management strategy is instrumental to this alignment. Best-in-Class organizations are 41% more likely than Laggards to have a process that enables managers to assign individual goals to employees and link them to organizational goals. In order to achieve this, executives and senior leaders must clearly communicate the goals of the organization
and track them as they cascade down the ranks. Fast Facts: "Rank and Yank"
√ 21% of organizations have
a forced performance curve (aka "Rank and Yank" system). Based on the data, Aberdeen doesn't believe that this system correlates with Best-in-Class practices as 24% of Laggard
organizations have it in place compared to 21% of the Best-in-Class.
Best-in-Class organizations are 30% more likely than Laggards to use performance and goals attainment data to strategically adopt a process that creates development plans and assigns learning as part of or based on the performance review. Identifying goals and monitoring performance against those goals is just half of the game. Organizations also need to be able to determine, if necessary, why performance may have fallen short relative to goals and what needs to be done to develop an employee so that they can meet and exceed expectations in the future. This is one of the big
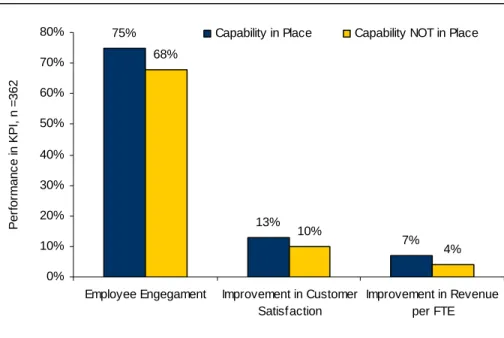
differentiators between Best-in-Class and Laggard organizations, and one of the first recommendations for those who haven't yet made it to this level of maturity. Moreover, even though it's adopted by just 22% of Best-in-Class organizations, devising learning programs specifically for low-performers also emerged as a differentiator. Perhaps, this capability is implemented by fewer organizations because low-performers hardly seem worth the investment at first glance. However, it is important to determine why performance is low because, the majority of the time, development can trigger enormous
© 2010 Aberdeen Group. Telephone: 617 854 5200 improvements. Especially in industries where talent is scarce (such as
healthcare), addressing sub-par performance through targeted learning and development can pay dividends in terms of retention and engagement (i.e. replacement costs). Organizations with this capability in place are 68% more likely to be Best-in-Class than organizations without, and, as shown in Figure 5, they are more likely to experience positive results across key talent management and business metrics.
Figure 5: Targeted Learning for Low Performers
75% 13% 7% 68% 10% 4% 0% 10% 20% 30% 40% 50% 60% 70% 80%
Employee Engegament Improvement in Customer Satisfaction Improvement in Revenue per FTE P er for man c e i n K P I, n = 36 2
Capability in Place Capability NOT in Place
Source: Aberdeen Group, May 2010
Knowledge Management
To effectively manage employee performance, all organizations must ensure that performance data is stored in a manner which enables easy access and updates. To this effect, 71% of Best-in-Class organizations have a repository of all performance reviews (names, dates, scores) - the same holds true for 69% of Industry Average and 66% Laggard organizations. In addition to learning and development, Best-in-Class organizations leverage this data across the talent management lifecycle starting with competency definitions. Half of Best-in-Class organizations have defined competencies of top performers for each job role, compared 32% of Industry Average and 22% of Laggards. This is a capability that even the Best-in-Class still strive for, but one that Aberdeen encourages in all aspects of talent management.
Competencies are essential for organizations because they allow for
decisions to be made based on proven success criteria, and add science to a process that otherwise tends to rely on intuition or "gut-feel." Not only does this framework shape development and succession strategy post-hire, but it is also used to improve quality of hire on the recruiting side.
reaching their first performance-based incentive milestone on time and 31% increase in number of engaged employees, contributing to a 50% greater improvement in customer satisfaction.
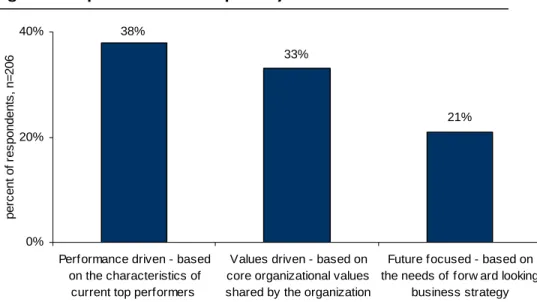
In fact, research conducted by Aberdeen in late 2009 on Competency
Management showed that the top source of competency definitions is driven by the characteristics of top performers. Without frequently and accurately evaluating employees and clearly communicating these results to decision makers, it becomes difficult to establish a competency framework - a top strategy identified by respondents in Chapter One.
Figure 6: Top Sources of Competency Definitions
38% 33% 21% 0% 20% 40%
Performance driven - based on the characteristics of
current top performers
Values driven - based on core organizational values shared by the organization
Future focused - based on the needs of forw ard looking
business strategy p er c en t of r es p onde nt s , n = 20 6
Source: Aberdeen Group, November 2009
Integration Across Talent Management
Best-in-Class organizations are more likely in general to have some sort of data integration with other talent management systems. In fact, 50% of Best-in-Class organizations cited some integration compared to 37% of Industry Average and 28% for Laggards. The most common integration of employee performance data occurs on post-hire systems, specifically in learning and succession management. Integrating this data into these systems eliminates a substantial amount of manual workflows, which can be both resource-intensive and prone to error. And with the right tools in place, data integration gives the organization the ability to make better decisions by providing clear visibility into each employee's profile. As leveraging this data evolves and the organization's employee performance management
initiatives mature, data collected on top performers can be used to build more optimized job requisitions that truly align with the goals of the organization and clearly set expectations early in the process.
© 2010 Aberdeen Group. Telephone: 617 854 5200
Figure 7: Performance Data Integration Pre- and Post-Hire
24% 19% 7% 50% 27% 4% 6% 63% 18% 6% 4% 72% 0% 20% 40% 60% 80% Post-Hire (learning, development, career planning or succession) ONLY
BOTH Pre- and Post-hire Pre-Hire (Recruitment) ONLY No Data Intergration w ith other Pre- or
Post-hire Systems P er c en t of O rgani z at ions , n = 36 2
Best-in-Class Industry Average Laggard
Source: Aberdeen Group, May 2010
Performance Management
More than two thirds of Best-in-Class organizations formally assess the success of their employee performance management initiatives against the intended impact at least once annually – and 43% assess the program's performance two times per year or more. The latter statistic is nearly twice as likely as that for Laggard organizations. This is critical, especially given the current economic conditions that require scrutiny, agility, and market responsiveness. Regular review ensures that the EPM program maintains its alignment with the organization's overall objectives. Not surprisingly, organizations that currently do so are nearly 40% more likely to be satisfied with their EPM initiatives - 68% versus 49%.
"One big action is to determine the most effective key
performance indicators and tie them directly into performance management."
~ Denise Stemac, PHR, HR Manager, TechHealth
Enablers
Survey data and follow up conversations with end-users revealed that automation of employee performance management indeed has its benefits. Specifically, Aberdeen's research has found that automation alleviates the administrative burden on managers. Not surprisingly, Aberdeen found that 40% of all organizations cited usability for employee and manager as the top criterion taken into consideration when evaluating employee performance management systems - a key to improve adoption among business
managers. The second element is the ability of the system to integrate workflows and data with other HR or talent management systems, such as compensation, learning and succession. While two-thirds of all organizations represented in Aberdeen's EPM survey data currently have an employee performance management system in place, it is the use of other
complimentary tools that helps further differentiate the Best-in-Class with regard to enabling more insight and better decision making.
• Employee engagement surveys. Aberdeen's July 2009 report on Employee Engagement and January 2010 report on Onboarding
showed that there is a very powerful correlation between an employee's engagement level and their alignment with the
organization. In fact, they are nearly the exact same thing. The most powerful ways of engaging employees are in ensuring that they have clear individual goals, that they know the goals of the organization and their impact on those goals, and that they are given the opportunity to be recognized for their success in achieving those goals. Because of this, employee engagement is actually one very good measure of a performance management initiative and should be tracked carefully. Not surprisingly, Best-in-Class organizations are 51% more likely than Laggards to take advantage of this key enabler.
• Competency libraries / competency management tools.
One of the top three strategic actions identified by respondents was to build a performance-based competency framework to allow for better decision making across the entire talent management spectrum. Along this line, Aberdeen's recent competency
management research showed that Best-in-Class companies were 33% more likely than all others to partner with an external solution provider to design a custom competency model.
• Reporting or analytics tools that provide visibility into top performers. While only implemented by a moderate percentage of organizations, reporting and analytics tools are invaluable in tracking top performers and making performance-based decisions such as promotions, terminations, and compensation. While assessments and competency frameworks allow for organizations to create accurate and holistic profiles of their top performers, these tools allow for those profiles to be stored, accessed, and compared with ease.
• Balanced scorecard management tools. Balanced scorecards are powerful tools that allow for all forms of company data to be consolidated into a single, comprehensive view of organizational health. Employee performance data is a critical piece of this puzzle that, when combined with financial reporting, assets and liabilities, customer data, and others can help to measure the impact of the overall performance management strategy on the business. Although these tools have yet to gain wide adoption among even the Best-in-Class - with the exception of engagement surveys - data shows
organizations that have the latter three tools in place are more than twice as likely to achieve Best-in-Class performance than those that don't utilize any of them.
© 2010 Aberdeen Group. Telephone: 617 854 5200 Aberdeen Insights — Technology
Using software to automate employee performance management is a practice that is gaining solid traction. Over 200 organizations in our survey (60% of those that have employee performance management efforts) indicated that they currently use some sort of an employee performance management system. These organizations were then asked to select the top five elements of an EPM system they deemed most valuable.
Figure 8: Most Valuable Elements of EPM Systems
All Organizations 44% 45% 47% 47% 50% 0% 15% 30% 45% 60%
Tools to create Individual Development Plans w ith specific learning and
development items assigned Tools that track individual goals against
department and company goals (a.k.a cascading goals tracking tools) Reporting tools for managers and HR to track performance rating distribution and
facilitate the calibration process Employee self service tools to access their individual performance data (e.g. employee
profiles)
Manager self service tools to access employee performance data
Percent of Organizations, n = 215
As Figure 8 shows, the elements considered most valuable center around visibility and empowering managers to take ownership of the EPM
process. From the employee perspective, it goes back to alignment that is a direct result of cascading organizational goals to the employees and showing them how meeting these goals contributes to company performance and impacts their development. Tracking and reporting tools are critical to gain front-line and mid-level managerial support and buy-in which facilitates the process of establishing accountability. Ultimately, with the right tools, employee performance becomes a main ingredient in the operational and cultural recipe for the success of the organization.
Chapter Three:
Required Actions
Fast Facts
√ 78% of Best-in-Class
organizations hold managers accountable for conducting employee reviews / appraisals
√ 78% of Best-in-Class
organizations hold
employees accountable for their own goal attainment progress
√ 64% of Best-in-Class
organizations hold managers accountable for employees' goal attainment
For Laggard organizations, the focus must start on the employees, while Industry Average organizations need to improve the managers' ability to impact performance, and Best-in-Class organizations should look at EPM more strategically. Whether a company is trying to move its performance in managing employee performance from Laggard to Industry Average, or Industry Average to Best-in-Class, the following actions will help spur the necessary performance improvements:
Laggard Steps to Success
• Hold employees accountable for their own goal attainment progress. While this may seem self-explanatory, 66% of Laggard organizations have this capability in place compared to 78% of the Best-in-Class. Of course, this capability is more complex than it looks. While many organizations may have a means of monitoring employee performance, it doesn't mean that there are set goals in place. And without goals, what can someone be held accountable to? Still, 83% of Laggard organizations do have goals included as part of employee performance management, which means that some of these organizations are setting goals but not holding the employee accountable for reaching them. The fact of the matter is that if the employee doesn't feel accountable for their goals being reached, nobody will feel that way. While the average organization recorded roughly one-third of employees exceeding expectations in
performance reviews, those that did not have this capability in place indicated an average of 26%, a significant difference likely resulting in real loss of company revenue.
• Encourage frequent touch-points between the manager and employee. While employee accountability always needs to come first, the average employee can't do it alone. Reaching aggressive and forward-looking goals requires third-party feedback, guidance, and discipline. Furthermore, in many cases the ability to look forward enough to accurately project progress against goals requires a great deal of experience - experience that, ideally, the manager should possess. Having frequent meetings between the employee and manager not only conveys to the employee that their progress is being taken seriously, but it is critical to ensure unbiased feedback and valuable knowledge-sharing. Companies that have this capability in place outperformed those without by 67% in terms of the ratio of employees that exceeded expectations in performance reviews.
• Keep an eye on employee engagement. Aberdeen's February 2010 report on Onboardingshowed that there is a very powerful correlation between an employee's engagement level, their
© 2010 Aberdeen Group. Telephone: 617 854 5200 alignment with the organization, and their propensity to impact
operational metrics. The most powerful ways of engaging employees are in ensuring that they have clear individual goals, that they know the goals of the organization and their impact on those goals, and that they are given the opportunity to be recognized for their success in achieving those goals. Because of this, employee engagement is actually one very good measure of a performance management initiative and should be tracked carefully. Compared to other organizations, Laggards are much less likely to use employee engagement surveys, with only 41% indicating implementation. By making an effort to measure engagement, companies can get a much better idea of how well their performance management process is making a difference, and can set more realistic goals for future improvement.
Industry Average Steps to Success
• Hold managers accountable for conducting reviews. This capability is a two-way street. In order to hold these supervisors accountable for conducting reviews on time and ensuring they are completely accurate, Industry Average organizations must ensure that the system is easy to use by these managers and must also communicate the value that EPM activities have on their teams. One way to do so is to involve them during the solution evaluation process and get their feedback on usability of the software. Once this is established, organizations can then formalize and standardize the review process and establish parameters around such
accountability among managers. At the end of the day, if this critical talent management and business imperative is viewed as time consuming, then it will become hard to enforce this accountability and to get these mangers to buy-in into any form of a performance culture. Currently, 69% of Industry Average organizations enforce this accountability compared to 78% of the Best-in-Class.
"We consider it important to have communication across the board on corporate vision with consistency and process to implement an action plan. This should go hand in hand with goal-setting and a defined performance management process."
~ Keeven Choi, General Manager, DBS Bank Limited
• Hold managers accountable for employee goal attainment.
Just as employees are held accountable to attain their own performance goals or personal KPI, managers must be held accountable to follow up with them, mentor them and document any performance related events. Since employee goals are tied to those of their team and the organization, managers, due to their higher level of knowledge and experience, play a key role in
reinforcing the value of these goals and reiterating their importance on a larger scale. Currently, just 56% of Industry Average
organizations have established this accountability. Another key to achieve this capability is through informal reviews developing the leadership and mentoring skills of these managers. For more information on how to develop front-line and mid-level managers, please see our October 2009 report, Learning & Development: Arming Front-line and Mid-level Managers to Deliver People and Performance Results.
• Empower managers to assign individual goals to individuals and link them to organizational objectives. The two major elements to achieving this capability are providing visibility and arming managers with the tools that they will need. Begin by communicating the goals of the organization with complete transparency, and clearly show managers and business unit leaders how these targets cascade down from the high-level of the company to their teams' goals. Then these managers will work with their employees to allocate that goal appropriately based on each employee's competency. In order to continue to foster and sustain this visibility, Industry Average organizations must ensure that the EPM system allows for this capability. Lastly, you can take this capability a step further by integrating employee and team goals into an organizational management scorecarding tool or dashboard that constantly tracks how each team's contributions impact the overall number.
Best-in-Class Steps to Success
• Tie compensation plans to performance for all employees.
Given the fact that the top strategic action identified by respondents was to implement an ongoing culture of performance management, this capability could not be more important. The possibility of performance-based rewards adds a very powerful incentive for employees to be vigilant in attaining their goals. And when these goals are tied to those of the organization, it ensures that individual effort is being spent in a way that will yield the most impact. Plus, when compensation is tied to performance, it allows employees to feel confident that their hard work will be fairly rewarded, which is critical to maintaining high engagement. Currently, only 50% of Best-in-Class organizations have these two elements linked together for all employees, but the good news is that another 36% do so for some of their employees. These performance-based compensation plans should be expanded to include everyone, from the CEO to the entry-level hire. From a systems standpoint, only 23% of Best-in-Class organizations have compensation management software; however, another 30% are planning to implement.
• Establish competencies for each role. As mentioned in the capabilities section, competencies are essential for painting an accurate picture of an employee. Not only can competency models be used to categorize the performance of superstars by job role, but when combined with behavioral and skills-based perspectives, they can paint a very holistic portrayal of the kind of employees needed for each role. From a performance perspective, this capability can help organizations set better and more realistic performance expectations. In addition, competencies make it easier to determine what skills or behaviors will need to be developed in order to reach those desired expectations. Currently, 50% of Best-in-Class companies have defined competencies for each job role,
© 2010 Aberdeen Group. Telephone: 617 854 5200 and 36% use competency tools and libraries. Another 29% of
Best-in-Class companies, however, have plans to add competencies within the next year.
• Link performance management and learning together. An employee performance management strategy that simply reviews and identifies high-performers is only doing half of its job. For a company to truly stay on the top of the competition, there needs to be a process in place to ensure that performance data is being acted upon, or that steps are being taken so that new and higher goals can be achieved. This should be a no-brainer among Best-in-Class companies, but surprisingly only 56% have this capability in place. Even scarier is the fact that only 38% of the Best-in-Class describe their performance management data as being integrated with learning and development. Having performance management without learning is like giving a student the motivation to study harder for a test, but not giving them any study techniques or resources to help them succeed. Motivation alone can be effective, but when combined with knowledge and empowerment, it can be profound. Organizations that assign learning based on performance reviews achieved 38% better engagement, 61% greater percentage of positions with a ready and willing successor identified, and 52% more employees achieving their first performance-based bonus or incentive compensation. And lastly as EPM efforts mature, continue to integrate performance data across the rest of talent management elements because the performance benefits can be enormous (see Chapter Two and Figure 7).
Aberdeen Insights — Summary
Like last year's study on Employee Performance Management (EPM), this year's research again proves that incorporating individual goals into the performance review process yields tremendous gains across the board. Aberdeen found that effective EPM initiatives must evolve to become cornerstones for business performance as well as talent strategy. We found that beyond goals, automation and accountability, organizations must leverage employee performance data in learning, development and succession. Identifying top performers and building competency
frameworks based on their common skills, knowledge and behaviors can not only solidify post-hire efforts, but also improve the results of the recruitment process; this is especially necessary in the current labor market where unemployment still hovers around double digits. Though there is some optimism about the state of the economy, future growth - at least through 2010 - will depend on output through efficiencies as opposed to increased headcounts. And as HR and talent management leaders, fine-tuning performance management initiatives is a great place to start.
Appendix A:
Research Methodology
Study Focus
Responding HR and line of business executives completed an online survey that included questions designed to determine the following:
√ The degree of automation of their EPM process
√ The role of individual goals in performance management
√ The degree of integration of EPM with other talent management elements
√ The benefits, if any, that have been derived from EPM initiatives
The study aimed to identify emerging best practices for managing employee
performance, and to provide a framework by which readers could assess their own capabilities.
Between April and May 2010, Aberdeen's Human Capital Management practice examined the internal capabilities and processes of nearly 400 organizations globally to determine the degree of success in their Employee Performance Management (EPM) programs.
Aberdeen supplemented this online survey effort with interviews with select survey respondents, gathering additional information on managing employee performance at various levels of the organization.
Responding enterprises included the following:
• Job title / function: The research sample included respondents with the following job titles: senior management (C-level, president, chairman) (10%); vice president (VP, SVP, EVP) (15%); director (27%); manager (29%); others (19%). In terms of functions in their respective organization, the majority of respondents (67%) were in human resources (including recruiting, talent management, training and organizational development). Other functional areas
represented sales and marketing (10%), corporate management (6%), and information technology (4%).
• Industry: The research sample included respondents from a variety of industries. Public-sector (including government, non-profit, and education) represented 12% of the sample, followed by healthcare (9%), telecom / hi-tech / IT (including software, hardware, and services) (9%), and finance and banking (6%).
• Geography: The majority of respondents (77%) were from North America. Remaining respondents were from Europe (11%), Asia-Pacific (10%), and Middle East / Africa (2%).
• Company size: Twenty-eight percent (28%) of respondents were from large enterprises (annual revenues above US$1 billion); 31% were from mid-sized enterprises (annual revenues between $50 million and $1 billion); 41% were from small businesses (annual revenues less than $50 million.
• Headcount: Thirty-one percent (31%) of respondents had over 5,000 employees; 15% had between 1,000 and 5,000 employees; 19% had between 250 and 1,000 employees; 35% of respondents came from companies with less than 250 employees.
© 2010 Aberdeen Group. Telephone: 617 854 5200
Table 5: The PACE Framework Key
Overview
Aberdeen applies a methodology to benchmark research that evaluates the business pressures, actions, capabilities, and enablers (PACE) that indicate corporate behavior in specific business processes. These terms are defined as follows:
Pressures — external forces that impact an organization’s market position, competitiveness, or business
operations (e.g., economic, political and regulatory, technology, changing customer preferences, competitive)
Actions — the strategic approaches that an organization takes in response to industry pressures (e.g., align the
corporate business model to leverage industry opportunities, such as product / service strategy, target markets, financial strategy, go-to-market, and sales strategy)
Capabilities — the business process competencies required to execute corporate strategy (e.g., skilled people,
brand, market positioning, viable products / services, ecosystem partners, financing)
Enablers — the key functionality of technology solutions required to support the organization’s enabling business
practices (e.g., development platform, applications, network connectivity, user interface, training and support, partner interfaces, data cleansing, and management)
Source: Aberdeen Group, May 2010
Table 6: The Competitive Framework Key
Overview The Aberdeen Competitive Framework defines enterprises as falling into one of the following three levels of practices and performance:
Best-in-Class (20%) — Practices that are the best
currently being employed and are significantly superior to the Industry Average, and result in the top industry performance.
Industry Average (50%) — Practices that represent the
average or norm, and result in average industry performance.
Laggards (30%) — Practices that are significantly behind
the average of the industry, and result in below average performance.
In the following categories:
Process — What is the scope of process
standardization? What is the efficiency and effectiveness of this process?
Organization — How is your company currently
organized to manage and optimize this particular process?
Knowledge — What visibility do you have into key
data and intelligence required to manage this process?
Technology — What level of automation have you
used to support this process? How is this automation integrated and aligned?
Performance — What do you measure? How
frequently? What’s your actual performance?
Source: Aberdeen Group, May 2010
Table 7: The Relationship Between PACE and the Competitive Framework
PACE and the Competitive Framework – How They Interact
Aberdeen research indicates that companies that identify the most influential pressures and take the most transformational and effective actions are most likely to achieve superior performance. The level of competitive performance that a company achieves is strongly determined by the PACE choices that they make and how well they execute those decisions.
Appendix B:
Related Aberdeen Research
Related Aberdeen research that forms a companion or reference to this report includes:
• Talent Assessment Strategies, March 2010
• Onboarding: The First Line of Engagement, February 2010 • Integrated Talent Management, December 2009
• Competency Management, November 2009
• Learning & Development: Arming Front-line and Mid-level Managers to Deliver People and Performance Results, October 2009
• Talent Acquisition Strategies 2010, August 2009 • Employee Engagement, July 2009
• Employee Performance Management, June 2009 • Economic Outlook 2010, December 2009
Information on these and any other Aberdeen publications can be found at
www.aberdeen.com.
Authors: Jayson Saba, Research Analyst, Human Capital Management, ([email protected])
Justin Bourke, Research Associate, Human Capital Management, ([email protected])
Since 1988, Aberdeen's research has been helping corporations worldwide become Best-in-Class. Having benchmarked the performance of more than 644,000 companies, Aberdeen is uniquely positioned to provide organizations with the facts that matter — the facts that enable companies to get ahead and drive results. That's why our research is relied on by more than 2.2 million readers in over 40 countries, 90% of the Fortune 1,000, and 93% of the Technology 500.
As a Harte-Hanks Company, Aberdeen plays a key role of putting content in context for the global direct and targeted marketing company. Aberdeen's analytical and independent view of the "customer optimization" process of Harte-Hanks (Information – Opportunity – Insight – Engagement – Interaction) extends the client value and accentuates the strategic role Harte-Hanks brings to the market. For additional information, visit Aberdeen http://www.aberdeen.com or call (617) 723-7890, or to learn more about Harte-Hanks, call (800) 456-9748 or go to http://www.harte-hanks.com. This document is the result of primary research performed by Aberdeen Group. Aberdeen Group's methodologies provide for objective fact-based research and represent the best analysis available at the time of publication. Unless otherwise noted, the entire contents of this publication are copyrighted by Aberdeen Group, Inc. and may not be reproduced, distributed, archived, or transmitted in any form or by any means without prior written consent by Aberdeen Group, Inc.