R E S E A R C H A R T I C L E
Open Access
The influence of negative training set size on
machine learning-based virtual screening
Rafa
ł
Kurczab
1, Sabina Smusz
1,2and Andrzej J Bojarski
1*Abstract
Background:The paper presents a thorough analysis of the influence of the number of negative training examples
on the performance of machine learning methods.
Results:The impact of this rather neglected aspect of machine learning methods application was examined for sets containing a fixed number of positive and a varying number of negative examples randomly selected from the ZINC database. An increase in the ratio of positive to negative training instances was found to greatly influence most of the investigated evaluating parameters of ML methods in simulated virtual screening experiments. In a majority of cases, substantial increases in precision and MCC were observed in conjunction with some decreases in hit recall. The analysis of dynamics of those variations let us recommend an optimal composition of training data. The study was performed on several protein targets, 5 machine learning algorithms (SMO, Naïve Bayes, Ibk, J48 and Random Forest) and 2 types of molecular fingerprints (MACCS and CDK FP). The most effective classification was provided by the combination of CDK FP with SMO or Random Forest algorithms. The Naïve Bayes models appeared to be hardly sensitive to changes in the number of negative instances in the training set.
Conclusions:In conclusion, the ratio of positive to negative training instances should be taken into account during the preparation of machine learning experiments, as it might significantly influence the performance of particular classifier. What is more, the optimization of negative training set size can be applied as a boosting-like approach in machine learning-based virtual screening.
Background
Machine learning (ML) methods are widely used in the process of drug discovery to classify molecules as poten-tially active or inactive against a particular protein target. The vast majority of those methods require the prep-aration of a training set of compounds (supervised learning) that are used to develop a decision rule that can be then applied to sort a dataset of new molecules (the test set) among particular activity classes [1]. A num-ber of studies have aimed to determine optimal learning parameters and examine their impact on classification ef-fectiveness [2-5]. Interestingly, no extensive research that considers the influence of the ratio of active to inactive training examples on the efficiency of new active com-pounds recognition has been performed. The possible im-pact of negative training examples on the performance of
ML models has only recently become the subject of re-search in the field of cheminformatics. Although, it should be emphasized that the construction of the train-ing set might be the issue of the well-known problem of learning from imbalanced data as well. However, due to a large number of existing approaches in this field, their relevant examination was beyond the scope of this paper. Recently, we showed that the way of inactive set design significantly influences classification effectiveness, with the best results obtained for training sets with inactives randomly selected from the ZINC database [6]. Tests were conducted with six of the most frequently used ap-proaches for selecting assumed inactive compounds: ran-dom and diverse selection from the ZINC database [7], the MDDR database [8] and libraries generated accord-ing to the DUD methodology [9]. All experiments were performed using 5 different protein targets, 3 different fingerprints for molecular representation and seven ML algorithms. Concurrently, Heikamp et al. [10] analyzed the effects of alternative sets of negative training data and
* Correspondence:[email protected] 1
Department of Medicinal Chemistry, Institute of Pharmacology, Polish Academy of Sciences, Smętna 12, 31-343 Kraków, Poland
Full list of author information is available at the end of the article
different background databases on support vector ma-chine (SVM) modeling and virtual screening (VS). The results showed a clear influence of negative training examples on SVM search efficiency, with the best per-formance achieved when SVM models were trained and screened on a dataset randomly chosen from ZINC (experimentally confirmed active and inactive compounds were selected from PubChem Confirmatory Bioassays [11]). The authors also touched the problem of positive to negative training examples ratio and noted that increased numbers of reference compounds generally can lead to im-provement in the prediction abilities of SVM. The models were derived on the basis of differently composed training sets containing confirmed inactive molecules or com-pounds randomly selected from the ZINC database as negatives.
In this study, we delve into the influence of increasing the number of negative instances used for training (with a fixed set of actives) on ML methods performance. At first, ligands (from the MDDR database) of 3 proteins were studied in details, and next the analysis was ex-tended by 12 other targets (active compounds fetched from ChEMBL [12]) to confirm the applicability of found conclusions. This is an extension of our previous study that focused on determining the optimal formula for providing the maximum possible yield from machine learning-based virtual screening, taking into account another very import-ant aspect of designing VS experiments.
Results and discussion
The question raised in this study was how the perform-ance of machine learning-based virtual screening de-pends on the size of the dataset of negative training examples. To address this issue, we have first performed initial calculations for 3 different protein targets (5-HT1A, HIV-1 protease and matrix metalloproteinase) with actives fetched from the MDDR database. Next, to broaden the scope of the study and to verify the obtained results, the set of targets was extended by 12 proteins belong-ing to different classes (enzymes, membrane proteins, transcription factors, transporter) and compounds stored in the freely available ChEMBL database–confirmatory tests. Five machine learning algorithms (SMO, Naïve Bayes, Ibk, J48 and Random Forest) and 2 types of mo-lecular fingerprints (MACCS and CDK FP) were applied to datasets of a fixed number of positive training in-stances and varied the number of negative examples to obtain different active to inactive ratios (from 0.5 to 20 with a step size of 0.5). In order to show the relative di-versity of actives towards inactives randomly selected from the ZINC database, the matrices of Tanimoto coef-ficients were calculated (see Additional file 1: Figure S1). It revealed that for the great majority of active ligands, there were found inactive compounds from ZINC that
were characterized by high similarity, therefore the classifi-cation task (discrimination between actives and inactives) was not trivial.
The selection of particular classification algorithms was dictated by their popularity in virtual screening experi-ments. The machine learning methods performance was assessed with the use of the following evaluating metrics– recall, precision, Matthews Correlation Coefficient (MCC), ROC curves and AUC.
The recall, precision and MCC are usually used to pro-vide comprehensive assessments of imbalanced learning problems. On the other hand, the ROC curves, are very useful for providing a visual representation of the relative trade-offs between the true positives and false positives of classification in regard to data distributions. Albeit, in the case of highly skewed data sets, the ROC curves may pro-vide an overly optimistic view of an algorithm’s perform-ance. In such situations the PR curves can provide a more informative representation of performance assessment [13]. As recall, precision and MCC results give slightly different information and should be differently inter-preted, they were described independently from ROC and AUC. Recall, precision and MCC values are gener-ated only on the basis of the confusion matrix, whereas ROC and AUC take into account the value of predictive function –therefore they provide information about the expected proportion of positives ranked before a uni-formly drawn random negative.
Initial tests
General search performance
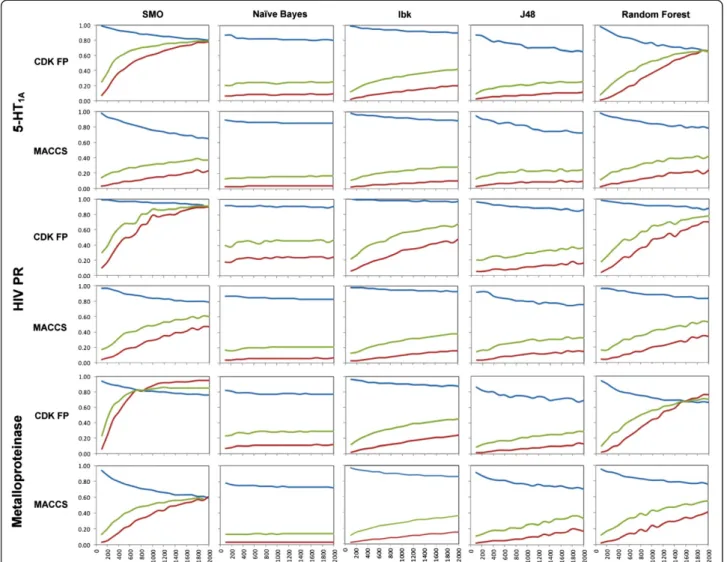
The recall, precision and MCC values for combinations of 3 initial targets with fingerprints and ML methods are presented in Figure 1. These results refer only to experi-ments with the maximum number of inactives equal to 2000, as further increase of the negative training size did not significantly change the evaluating parameters values (see Additional file 2: Figure S2, Additional file 3: Table S1, Additional file 4: Table S2). The single plot illustrates the relation between the averaged (after 10 iterations) value of a given performance measure and the negative set size for a particular combination of ML algorithm and molecular fingerprint.
Figure 1The dependence of negative training set size on machine learning-based virtual screening performance for 2 types of fingerprints and 3 protein targets, averaged over 10 independent trials.The colored lines denote the type of evaluated parameter used (blue–recall, red–precision and green–MCC). The figure presents the values of evaluating parameters (recall, precision and MCC) obtained in the experiments carried out for sets with fixed number of active molecules and varying number of inactives.
models occupied the region of medium classification ef-fectiveness with high recall and low precision (quarter IV). When the size of the negative set increased, performance improvements were observed for all methods except Naïve Bayes. The most significant changes were found for SMO and Random Forest methods, which both moved to the region of high recall and precision (quarter I).
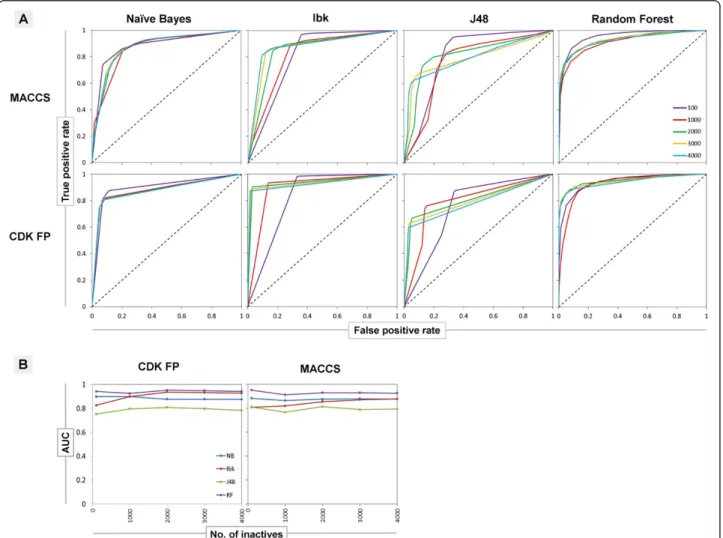
Interestingly, the analysis of ROC curves plotted for 5-HT1A (Figure 3A) showed that increasing the ratio of inactives to actives, improved the ability of Ibk and J48 to correctly rank positive examples over the negative ones, whereas for Random Forest and Naïve Bayes this relationship is negligible. On the other hand, the AUC was the least affected parameter by the number of inac-tives used for training (Figure 3B). The described ten-dency was similar for all initial targets and fingerprints, and only slight differences were observed in the changes in the values of AUC. However, as it was mentioned pre-viously, both ROC and AUC provide different type of
information – that is not only classification itself, but they also take into account ranking, showing the rate of expectation that a uniformly drawn random positive is ranked before a uniformly drawn random negative. ROC and AUC analysis for HIV-1 protease and metallopro-teinase are placed in the Additional file 5: Figure S3 and Additional file 6: Figure S4). The examination of ROC, AUC and other evaluating parameters, in the context of the way particular classification algorithm constructs the predictive model, is included in the Additional file 7.
Influence of negative training set size on the performance of ML methods
For almost all ML algorithms studied, increasing the number of negative training instances was found to decrease recall and increase both precision and MCC values. However, completely different tendencies were observed for the Naïve Bayes algorithm, which in all cases showed only a slight sensitivity to the negative training set
Figure 3The changes of the ROC curves and AUC values for different number of inactives used for ML training.The figure presents ROC curves for 5-HT1Atarget illustrating the improvement of the machine learning models performance, calculated for several negative training
size enlargement (Figure 2). According to its methodo-logical assumptions it labels instances from the test set ac-cording to the class distribution from the training data. Therefore, one would expect that increasing the number of inactive compounds in the training set should lead to improvement of Naïve Bayes performance in virtual screening-like experiment. However, the attempts to re-produce the class distribution from the training set led to errors in class assignments for sets with higher number of inactives which in turn resulted in lower values of evaluating parameters instead of the expected uplift.
Considering the dynamics of changes in ML perform-ance with a growing number of negative training exam-ples, SMO and Random Forest algorithms quickly led to models with very good classification effectiveness (Figure 2). In comparison, the improvement of Ibk and J48 methods was less significant; their corresponding curves on precision-recall plots responded very slowly to increases in the number of negative instances.
In general, the preferable ratio of active to inactive compounds in the training sets was found to be approxi-mately 1:9–1:10 – further increase in the size of the negative training set led to only slight improvements in global ML methods performance (MCC) that were not profitable due to increases in computational ex-penses (see Additional file 2: Figure S2, Additional file 3: Table S1).
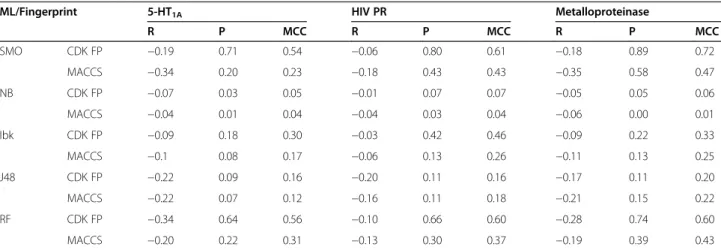
Table 1 shows the changes in given performance pa-rameters for a particular ML method obtained between experiments with the lowest and the highest number of negative training examples. These quantitative results confirm that the largest improvement in precision and
MCC values was observed for SMO (0.20–0.89 and
0.23–0.72, respectively) and Random Forest (0.22–0.74 and 0.31–0.60, respectively) methods. However, changes in recall were also observed – it was reduced even by
0.35 for the metalloproteinase when the number of training inactives was raised from 100 to 2000. Addition-ally, the Ibk algorithm produced the greatest decrease in recall and a modest improvement in precision (0.08–0.42) and MCC (0.17–0.46) when the size of the negative exam-ples set was increased.
Fingerprint dependency
From fingerprint-based point of view, the overall ten-dency of searching did not change considerably when MACCS or CDK FP fingerprints were used. In almost all cases, the total improvement of predictive models was much lower for MACCS fingerprints (Table 1). This is also shown through the precision-recall plots (Figure 2), where in almost all cases studied, the performance of a particular ML algorithm changed more dynamically when molecules were encoded by CDK FPs than MACCS fin-gerprints. Moreover, only in one case MACCS (in combin-ation with SMO for metalloproteinase, Figure 2) produced effective classification models (quarter I). Interestingly, CDK FP required approximately 8-fold more time on training prediction models and database screening than MACCS. This is likely caused by the difference in the length of the bit string used to represent the molecule (166 and 1024 bit positions used in MACCS and CDK FP, respectively).
Confirmatory tests
Machine learning experiments were also carried out in an analogous approach for compounds selected from the ChEMBL database. Different classes of proteins with vari-ous number of known active molecules provided covering of a broad range of tested cases. The results were analyzed in a similar way as it was in case of the previous part of the study (Table 2, Additional file 8: Figure S5, Additional file 9: Table S3). The outcome of these experiments is
Table 1 The improvement of evaluating parameters calculated for targets from the initial tests
ML/Fingerprint 5-HT1A HIV PR Metalloproteinase
R P MCC R P MCC R P MCC
SMO CDK FP −0.19 0.71 0.54 −0.06 0.80 0.61 −0.18 0.89 0.72
MACCS −0.34 0.20 0.23 −0.18 0.43 0.43 −0.35 0.58 0.47
NB CDK FP −0.07 0.03 0.05 −0.01 0.07 0.07 −0.05 0.05 0.06
MACCS −0.04 0.01 0.04 −0.04 0.03 0.04 −0.06 0.00 0.01
Ibk CDK FP −0.09 0.18 0.30 −0.03 0.42 0.46 −0.09 0.22 0.33
MACCS −0.1 0.08 0.17 −0.06 0.13 0.26 −0.11 0.13 0.25
J48 CDK FP −0.22 0.09 0.16 −0.20 0.11 0.16 −0.17 0.11 0.20
MACCS −0.22 0.07 0.12 −0.16 0.11 0.18 −0.21 0.15 0.22
RF CDK FP −0.34 0.64 0.56 −0.10 0.66 0.60 −0.28 0.74 0.60
MACCS −0.20 0.22 0.31 −0.13 0.30 0.37 −0.19 0.39 0.43
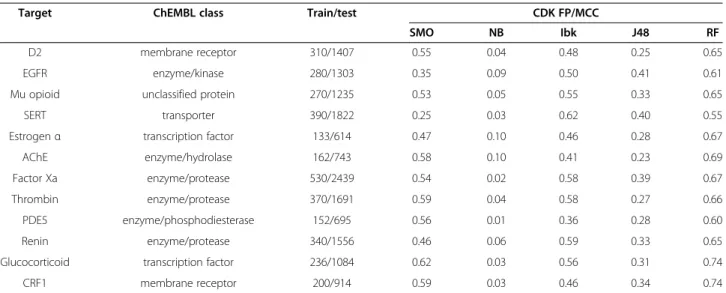
compatible with this from the initial tests–increasing the number of inactives included in the training data provides the substantial improvement of classification efficiency. Interestingly, the results are also consistent from the quantitative point of view–improvement in MCC values for SMO and Random Forest was 0.25–0.62 and 0.44– 0.74, respectively). The recall, precision and MCC values obtained in confirmatory tests are visualized in Additional file 8: Figure S5. The results for particular algorithms are in line with those from the previous part and the global con-clusions are the same: several fold excess of inactives in relation to actives constitutes an optimal solution for ma-chine learning experiments–although further addition of inactives usually led to further increase in evaluating pa-rameters values, the level of improvement was inadequate to the computational time needed.
Experimental Compound data sets
The MDDR database was used as a source of the struc-tures of active compounds for 3 different protein targets: 5-HT1AR agonists, HIV-1 protease inhibitors and metal-loproteinase inhibitors used in the initial study. Targets, belonging to diverse families of proteins and possessing large numbers of ligands, were carefully chosen after a survey of the literature concerning different aspects of ML methods tests [14-16].
The ML models were built and tested using active compounds from the MDDR database and assumed in-actives randomly selected from ZINC v. 10 (details pre-sented in Table 3). In each iteration step, the negative training set was rebuilt with a number of inactive com-pounds varying from 100 to 4000 in increments of 100. The positive training set was fixed and composed of
approx. 18% of all compounds with confirmed activity toward the particular target. The remaining actives, to-gether with the same number of 99000 compounds ran-domly selected from ZINC, formed the test set. For each ratio of active to inactive compounds, 10 trials were performed.
The changes in recall, precision and MCC values be-tween particular iterations were statistically insignificant, and therefore repeating the study with another randomly selected ZINC sets leads to very similar results and the dependencies connected with the number of inactives in the training set are preserved.
The ChEMBL Target Classification Hierarchy directed the selection of 12 targets used in the confirmatory tests, which ensured the diversity of both proteins and structures of active compounds. As ChEMBL (unlike MDDR) contains numerical values of particular parameter determining compounds activity, active compounds were selected manually by setting an appropriate threshold – only compounds which annotated activity satisfied one of the conditions: Ki < 100 nM or IC50 < 200 nM, were included into active class. Because different ber of active ligands were obtained, the chosen num-ber of inactives was rescaled to ensure the same active
Table 2 The improvement of MCC values calculated for targets from the confirmatory tests
Target ChEMBL class Train/test CDK FP/MCC
SMO NB Ibk J48 RF
D2 membrane receptor 310/1407 0.55 0.04 0.48 0.25 0.65
EGFR enzyme/kinase 280/1303 0.35 0.09 0.50 0.41 0.61
Mu opioid unclassified protein 270/1235 0.53 0.05 0.55 0.33 0.65
SERT transporter 390/1822 0.25 0.03 0.62 0.40 0.55
Estrogenα transcription factor 133/614 0.47 0.10 0.46 0.28 0.67
AChE enzyme/hydrolase 162/743 0.58 0.10 0.41 0.23 0.69
Factor Xa enzyme/protease 530/2439 0.54 0.02 0.58 0.39 0.67
Thrombin enzyme/protease 370/1691 0.59 0.04 0.58 0.27 0.66
PDE5 enzyme/phosphodiesterase 152/695 0.56 0.01 0.36 0.28 0.60
Renin enzyme/protease 340/1556 0.46 0.06 0.59 0.33 0.65
Glucocorticoid transcription factor 236/1084 0.62 0.03 0.56 0.31 0.74
CRF1 membrane receptor 200/914 0.59 0.03 0.46 0.34 0.74
The table shows the changes in MCC for a particular ML method obtained between experiments with the lowest and the highest ratio of negative to positive training examples.
Table 3 Composition of training and test sets used in the initial study
Protein target MDDR activity index
Number of actives/inactives Training set Test set
5-HT1A 06235 198/100–2000 903/99000
HIV PR 71523 203/100–2000 932/99000
to inactive ratios, as in initial study. Details concerning number of actives in both training and test sets are in-cluded in Table 2.
Machine learning algorithms
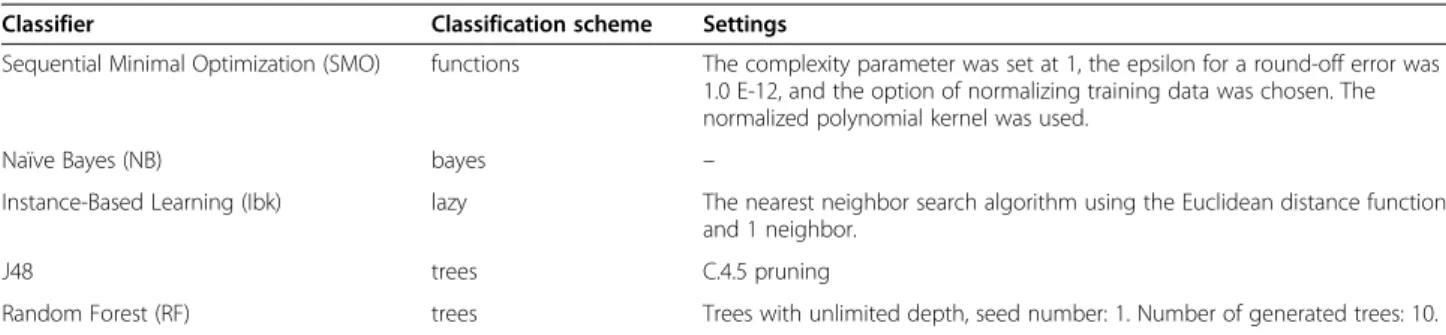
Five of the most commonly used in cheminformatics ML algorithms were selected: Sequential Minimal Optimi-zation (SMO) [17], Naïve Bayes classifier (NB) [18], Instance-Based Learning (Ibk) [19,20], J48 [21] and Ran-dom Forest (RF) [22,23]. All machine learning calculations were carried out using the WEKA package (version 3.6).
Calculations and performance measures
Compound structures were represented using MACCS structural keys [24] and CDK standard hashed finger-prints with a default path length of 6 (FP) [25], gener-ated by PaDEL-Descriptor software [26].
To evaluate the virtual screening performance of ML methods, the following parameters were used (averaged over 10 trials): recall–R (1), precision–P (2), Mathews Correlation Coefficient – MCC (3) and receiver operat-ing characteristic (ROC) and the area under the ROC curve (AUC).
R¼TPTPþFN ð1Þ
P¼ TP
TPþFP ð2Þ
MCC¼ ffiffiffiffiffiffiffiffiffiffiffiffiffiffiffiffiffiffiffiffiffiffiffiffiffiffiffiffiffiffiffiffiffiffiffiffiffiffiffiffiffiffiffiffiffiffiffiffiffiffiffiffiffiffiffiffiffiffiffiffiffiffiffiffiffiffiffiffiffiffiffiffiffiffiffiffiffiffiffiffiffiffiffiffiffiffiffiffiffiffiffiffiffiTP⋅TN−FP⋅FN
TPþFP
ð Þ⋅ðTPþFNÞ⋅ðTNþFPÞ⋅ðTNþFNÞ
p
ð3Þ
Recall measures the number of correctly identified positive instances, precision describes the correctness of positive predictions and the MCC is a balanced measure of binary classification effectiveness, ranging from −1 to 1, with 1 referring to perfect prediction. The Re-ceiver Operator Characteristic curves (ROC) present how the number of correctly classified positive examples varies with the number of incorrectly predicted negative examples. Unfortunately, it was not possible to obtain ROC curve and AUC for SMO algorithm, because used WEKA implementation enables only on the binary classification.
These parameters were selected to enable the assess-ment of classification effectiveness from various perspec-tives. All calculations were performed on an Intel Core i7 CPU 3.00 GHz computer system with 24 GB RAM running a 64-bit Linux operating system.
Conclusions
We have investigated a seldom-explored question in machine learning-based virtual screening methodology:
how the performance of machine learning depends on the size of the set of negative training examples. We compared a variety of combinations of machine learning algorithms in classification experiments using compounds represented by 2 types of molecular fingerprints, for sets generated on the basis of confirmed active (from 2 activity databases) and varied numbers of assumed inactive compounds randomly selected from ZINC.
We found that the ratio of positive to negative training instances should be taken into account during the prep-aration of machine learning experiments, as it might significantly influence the performance of particular classifier. In general, increasing the size of the negative training set (with a constant quantity of positives), led to decrease in recall and improvement in precision, whereas no significant effect on AUC values was observed. How-ever, the precision changes were much higher than the changes in recall, and hence the global classification ef-fectiveness expressed by MCC values was enhanced by the addition of more inactives to the training data. These findings are generally in line with the results obtained by Heikamp et al. [10], who found better performance for an increased number of negative training examples for SVM models. An exception was the Naïve Bayes algorithm, for which no significant changes in models’ performance were observed. This provides some evi-dence of its indepenevi-dence of training set perturbation and variation. Overall, the best models (in terms of MCC values) were obtained for combination of SMO with CDK FP. The results were consistent for all protein targets and fingerprints, however, fingerprint with shorter bit string (MACCS) demonstrated less ability to improve ML models. For all the analyzed scenarios (target/ML method/fingerprint) and sizes of used test set, the pref-erable ratio of positive to negative training instances was found to be approximately 1:9 to 1:10. These find-ings revealed that the optimization of negative training set size can be applied as a boosting-like approach in machine learning-based virtual screening. However, it should be noted that the preferable active:inactive ratio indicated in the study might change under different ex-perimental conditions (the dimension of the screening database, different number of actives, relative diversity of actives towards inactives, used to train the ML algo-rithms, application of methods for imbalanced learning, optimization of ML methods parameters, etc.), but this require further research which goes far beyond the scope of the article.
Methods
Additional files
Additional file 1: Figure S1.The diversity analysis of compounds used in experiments in terms of Tanimoto coefficient calculated for each pair of structures in the dataset. The figure presents plots illustrating the dependence of Tanimoto coefficients calculated between all positive train examples and randomly selected negative training examples.
Additional file 2: Figure S2.The dependence of negative training set size on machine learning-based virtual screening performance, calculated for 5-HT1Aover the full range of 100–4000 negative examples. The figure
shows values of the evaluating parameters (recall, precision, MCC) for the extended range of the number of inactives present in the training set, that is 100–4000 for experiments for 5-HT1A.
Additional file 3: Table S1.The changes in performance parameters calculated as the difference between average values obtained for number of negative training examples varying from 2100–4000. Changes in the parameters calculated for 100–2000 inactives are shown in parentheses. The table compares the magnitude of changes for the number of inactives varying from 100–2000 and 2100–4000. It is clearly visible that increasing the number of inactives over 2000 did not affect so much the ML algorithms performance as it was in case of the lower number on inactive compounds used for training.
Additional file 4: Table S2.Detailed results of the calculations for 5-HT1A.
The table presents the numerical values of all evaluating parameters obtained for the experiments with 5-HT1Aligands.
Additional file 5: Figure S3.ROC analysis for HIV-1 protease and metalloproteinase. The figure presents ROC curves for HIV-1 protease and metalloproteinase.
Additional file 6: Figure S4.AUC analysis for HIV-1 protease and metalloproteinase. The figure presents AUC curves for HIV-1 protease and metalloproteinase.
Additional file 7:Additional comments on machine learning algorithms and the dependency of their results on the number of inactives in the training data.The file contains the additional comments on the machine learning algorithms used in the study, relating the obtained results with the theories lying behind each classification model.
Additional file 8: Figure S5.The dependence of negative training set size on machine learning-based virtual screening performance for 2 types of fingerprints and 12 protein targets from confirmatory set, averaged over 10 independent trials. The colored lines denote the type of evaluated parameter used (blue–recall, red–precision and green–MCC). The figure visualizes the evaluating parameters (recall, precision, MCC) values obtained for fixed number of actives and varied number of inactives in the confirmatory experiments stage.
Additional file 9: Table S3.Changes in performance parameters calculated as the differences between average values obtained for the lowest and highest ratio of negative to positive training examples obtained for all ChEMBL targets. The table shows the changes in given performance parameters for a particular ML method obtained between experiments with the lowest and the highest number of negative training examples for protein targets selected for confirmatory tests.
Competing interests
The authors declare that they have no competing interests.
Authors’contributions
All authors designed the experiments. SS and RK performed the experiments. All authors analyzed the data and draw conclusions and wrote, read and approved the final manuscript.
Acknowledgements
The study was supported by the grant PRELUDIUM 2011/03/N/NZ2/02478 financed by the National Science Centre. SS would also like to acknowledge the Marian Smoluchowski Kraków Research Consortium:“Matter-Energy-Future” for the scholarship provided within the KNOW funding.
Author details
1
Department of Medicinal Chemistry, Institute of Pharmacology, Polish Academy of Sciences, Smętna 12, 31-343 Kraków, Poland.2Faculty of Chemistry, Jagiellonian University, R. Ingardena 3, 30-060 Kraków, Poland.
Received: 12 October 2013 Accepted: 2 June 2014 Published: 11 June 2014
References
1. Melville JL, Burke EK, Hirst JD:Machine learning in virtual screening. Comb Chem High Throughput Screen2009,12:332–343.
2. Ma XH, Wang R, Yang SY, Li ZR, Xue Y, Wei YC, Low BC, Chen YZ: Evaluation of virtual screening performance of support vector machines trained by sparsely distributed active compounds.J Chem Inf Model2008, 48:1227–1237.
3. Plewczynski D, Spieser SH, Koch U:Assessing different classification methods for virtual screening.J Chem Inf Model2006,46:1098–1106. 4. Bruce CL, Melville JL, Pickett SD, Hirst JD:Contemporary QSAR classifiers
compared.J Chem Inf Model2007,47:219–227.
5. Smusz S, Kurczab R, Bojarski AJ:A multidimensional analysis of machine learning methods performance in the classification of bioactive compounds.Chemom Intell Lab Syst2013,128:89–100.
6. Smusz S, Kurczab R, Bojarski AJ:The influence of the inactives subset generation on the performance of machine learning methods.J Cheminf 2013,5:17–25.
7. Irwin JJ, Sterling T, Mysinger MM, Bolstad ES, Coleman RG:ZINC: A free tool to discover chemistry for biology.J Chem Inf Model2012,52:1757–1768. 8. USA: MDDR licensed by Accelrys, Inc; [www.accelrys.com].
9. Huang N, Shoichet BK, Irwin JJ:Benchmarking sets for molecular docking. J Med Chem2006,49:6789–6801.
10. Heikamp K, Bajorath J:Comparison of confirmed inactive and randomly selected compounds as negative training examples in support vector machine-based virtual screening.J Chem Inf Model2013,53:1595–1601. 11. Wang Y, Xiao J, Suzek TO, Zhang J, Wang J, Zhou Z, Han L, Karapetyan K, Dracheva S, Shoemaker BA, Bolton E, Gindulyte A, Bryant SH:PubChem’s BioAssay Database.Nucleic Acids Res2012,40:D400–D412.
12. Gaulton A, Bellis LJ, Bento AP, Chambers J, Davies M, Hersey A, Light Y, Mcglinchey S, Michalovich D, Al-Lazikani B, Overington JP:ChEMBL: a large-scale bioactivity database for drug discovery.Nucleic Acids Res 2011,40:D1100–D1107.
Table 4 Machine learning algorithms used and a short description of their training parameters
Classifier Classification scheme Settings
Sequential Minimal Optimization (SMO) functions The complexity parameter was set at 1, the epsilon for a round-off error was 1.0 E-12, and the option of normalizing training data was chosen. The normalized polynomial kernel was used.
Naïve Bayes (NB) bayes –
Instance-Based Learning (Ibk) lazy The nearest neighbor search algorithm using the Euclidean distance function and 1 neighbor.
J48 trees C.4.5 pruning
13. Davis J, Goadrich M:The relationship between precision-recall and ROC curves.Proceedings of the 23rd international conference onMachine Learning 2006, 233–240.
14. Chen B, Harrison RF, Papadatos G, Willett P, Wood DJ, Lewell XQ, Greenidge P, Stiefl N:Evaluation of machine-learning methods for ligand-based virtual screening.J Comput Aid Mol Des2007,21:53–62.
15. Ma XH, Jia J, Zhu F, Xue Y, Li ZR, Chen YZ:Comparative analysis of machine learning methods in ligand-based virtual screening of large compound libraries.Comb Chem High Throughput Screen2009,12:344–357. 16. Cannon EO, Amini A, Bender A, Sternberg MJE, Muggleton SH, Glen RC,
Mitchell JBO:Support vector inductive logic programming outperforms the naive Bayes classifier and inductive logic programming for the classification of bioactive chemical compounds.J Comput Aid Mol Des 2007,21:269–280.
17. Platt JC Sequential Minimal Optimization:A fast algorithm for training Support Vector Machines.Technical Report MSR-TR-98-141998, 1–21. 18. Mitchell TM:Machine Learning.New York: McGraw-Hill; 1997.
19. Aha DW, Kibler D, Albert MK:Instance-based learning algorithms.Mach Learn1991,6:37–66.
20. Brighton H, Mellish C:Advances in instance selection for instance-based learning algorithms.Data Min Knowl Disc2002,6:153–172.
21. Quinlan JR:Induction of decision trees.Mach Learn1986,1:81–106. 22. Svetnik V, Liaw A, Tong C, Culberson JC, Sheridan RP, Feuston BP:Random
forest: a classification and regression tool for compound classification and QSAR modeling.J Chem Inf Comput Sci2003,43:1947–1958. 23. Breiman L:Random forests.Mach Learn2001,45:5–32.
24. San Diego, CA, USA: MACCS Structural keys, Accelrys; [www.accelrys.com]. 25. Steinbeck C, Han Y, Kuhn S, Horlacher O, Luttmann E, Willighagen E:The
Chemistry Development Kit (CDK): an open-source Java library for chemo- and bioinformatics.J Chem Inf Comput Sci2003,43:493–500. 26. Yap CW:PaDEL-Descriptor: an open source software to calculate
molecular descriptors and fingerprints.J Comput Chem2011, 32:1466–1474.
doi:10.1186/1758-2946-6-32
Cite this article as:Kurczabet al.:The influence of negative training set size on machine learning-based virtual screening.Journal of Cheminformatics 20146:32.
Open access provides opportunities to our colleagues in other parts of the globe, by allowing
anyone to view the content free of charge.
Publish with
Chemistry
Central and every
scientist can read your work free of charge
W. Jeffery Hurst, The Hershey Company.
available free of charge to the entire scientific community peer reviewed and published immediately upon acceptance cited in PubMed and archived on PubMed Central yours you keep the copyright
Submit your manuscript here: