The Effect of Estradiol on Insulin Concentration in Response to an Acute Bout of Exercise
Cecily Lehman
A thesis submitted to the faculty of the University of North Carolina at Chapel Hill in partial fulfillment of the requirements for the degree of Masters of Art in the Department of
Exercise and Sport Science (Exercise Physiology).
Chapel Hill 2012
Approved By
Anthony C. Hackney, PhD, DSc
Joseph B. Myers, PhD, ATC
ii ABSTRACT
CECILY LEHMAN: The effects of estradiol on insulin concentration in response to an acute bout of exercise.
(Under the direction of Anthony C. Hackney, PhD, DSc)
The purpose of this study was to determine the influence of changes in circulating
estradiol levels on the insulin response to an acute bout of exercise, in college age women
who were not using hormonal contraceptives. Ten eumenorrheic women completed exercise
sessions (60 minutes, 65% of VO2max) in the mid-follicular (days 3 – 7; low estradiol levels)
and mid-luteal (days 20 – 25; high estradiol levels) phases of their menstrual cycle. Blood
samples were taken pre-exercise, immediately post-exercise, and 30 minutes into recovery.
Results indicate that there is not a significant change in resting or exercise insulin levels
during the low and high estradiol phases of the menstrual cycle (p = 0.415). In addition, the
added stress of exercise does not cause a significantly different percentage change (i.e., level
of decrease) in insulin between the low and high estradiol phases of the menstrual cycle (p =
iii
TABLE OF CONTENTS
LIST OF TABLES ...vi
LIST OF FIGURES ...vii
Chapter I. INTRODUCTION ...1
Purpose of the Study ...3
Research Questions ...4
Research Hypotheses ...5
Definition of Terms...6
Assumptions ...6
Delimitations ...6
Limitations ...7
Significance of Study ...7
II. REVIEW OF LITERATURE ...9
Insulin ...10
Insulin and Exercise ...10
Estradiol ...12
Estradiol and Exercise...12
Insulin and Estradiol ...14
Insulin, Estradiol, and Exercise ...15
Summary ...17
iv
Subjects ...19
Instrumentation ...20
Protocol ...21
Orientation/Maximal Oxygen Uptake Session ...21
Menstrual Phase Determination ...22
Exercise Sessions ...23
Blood Analysis ...25
Hematocrit...25
Hemoglobin...25
Plasma Volume ...25
Lactate and Glucose ...25
Estradiol and Insulin ...26
Statistical Analysis ...26
IV. RESULTS ...28
Subject Characteristics ...28
Maximal Oxygen Uptake Determination ...28
Menstrual Phase Determination ...29
Exercise Sessions One and Two ...29
Lactate and Glucose Response to Exercise ...31
Insulin Response to Estradiol and Exercise ...32
V. DISCUSSION ...35
Lactate Response to Exercise ...36
v
Insulin Response to Estradiol and Exercise ...38
Insulin Percent Change ...39
Conclusion ...40
Hypotheses Outcomes ...41
Study Limitations ...42
Future Directions ...43
APPENDICES Appendix A: Indications for Terminating Exercise Testing ...45
Appendix B: Informed Consents ...46
Adult Subject Informed Consent ...46
Storage of Biological Specimens ...54
Appendix C: Medical History Questionnaire ...58
Appendix D: Ovulation Kit Testing Protocol ...62
Appendix E: Exercise Session Questionnaire ...63
Appendix F: Estradiol ELISA Kit Protocol ...64
Appendix G: Insulin ELISA Kit Protocol ...76
vi
LIST OF TABLES
Tables
1. Subject physical characteristics ...28
2. The HR, RPE, and VO2 measurements during the one hour exercise ...31 sessions at 65% of VO2max during the mid-follicular and mid-luteal
phases of the menstrual cycle.
3. Blood glucose concentrations (mg/dL) pre-exercise, immediately ...32 post-exercise and 30 minutes into recovery during the mid-follicular
and mid-luteal phases of the menstrual cycle.
4. Blood insulin concentrations (μIU/ml) pre-exercise, post-exercise,...33 and 30 minutes into recovery during the mid-follicular and mid-luteal
phases of the menstrual cycle.
5. Insulin concentration percent change between pre-exercise to ...33 post-exercise, and pre-exercise to recovery during the mid-follicular
and mid-luteal phases of the menstrual cycle.
6. Individual measurements of VO2peak, E2, and insulin concentration ...34 percent change during the mid-follicular and mid-luteal phases of
vii
LIST OF FIGURES
Figures
1. Integrated summary of the effects of estradiol ...3
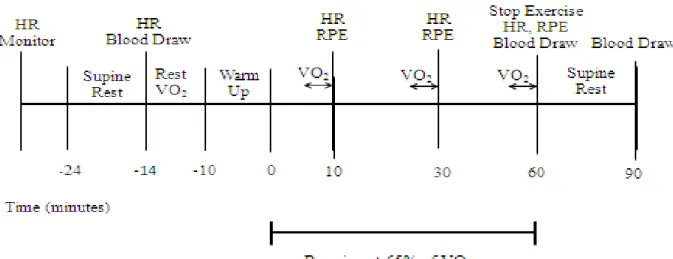
2. Timeline of 60 minute exercise session ...24
CHAPTER I
Introduction
Insulin is a polypeptide hormone secreted from the beta-cells of the pancreas. At rest,
usually postprandial, insulin stimulates glucose uptake, resulting in a decrease in blood
glucose levels (1). As blood glucose decreases, insulin release from the pancreas is inhibited
through a feedback mechanism, allowing the level of glucose in the blood to be tightly
regulated (2). Insulin promotes glycogen synthesis in muscle tissue, and fat synthesis in
adipose tissue, creating energy stores within the body (3). Glucagon is the antagonistic
hormonal counterpart to insulin, promoting glycogenolysis and gluconeogenesis. When
comparing the two hormones, a high Insulin/Glucagon (I/G) ratio usually causes a decrease
in blood glucose, while a low I/G ratio usually causes an increase in blood glucose (1).
During exercise the release of insulin is inhibited by the sympathetic nervous system
in order to maintain adequate concentrations of blood glucose; i.e., to provide a means by
which non-insulin dependent glucose uptake can be increased at skeletal muscle (4). The
drop in insulin concentration decreases the I/G ratio and promotes the effects of glucagon,
thereby increasing blood glucose. The decrease in insulin concentration with the onset of
exercise has been well established (5, 6, 7). It has also been demonstrated that one hour of
moderate exercise can immediately increase insulin sensitivity and responsiveness in
untrained subjects, and the effects can last for 48 hours after the exercise bout (6). Therefore,
exercise is a beneficial therapy for metabolic diseases, like type two diabetes mellitus, where
2
Estradiol (E2) is an 18-carbon steroid hormone derived from cholesterol and is the
main estrogen secreted by the ovaries in females (1). Estradiol helps to control ovulation,
menstruation, and pregnancy, but can also have influence on blood vessels, bones, lungs,
liver, intestines and metabolism (2). In eumenorrheic women, E2 levels vary greatly over the
course of the menstrual cycle, with concentrations being lower in the follicular phase (days 1
– 14), and increasing during the luteal phase (days 15 – 28) (1). E2 is known to have many
metabolic actions on a multitude of tissues (8). In general, the impact on energy metabolism
is to reduce reliance on carbohydrate as an energy source while enhancing lipid reliance (8,
9). Estradiol brings about these actions by direct effects on tissues through interactions with
E2 receptors, and indirectly by it actions on other hormones in the endocrine system. For
example, relative to this last point, elevated E2 levels promote enhanced growth hormone
release from the anterior pituitary, and growth hormone induces increased lipolysis activity
(10). Figure 1 schematically depicts some of the direct and indirect physiologic means by
which E2 mediates these effects on energy metabolism (8).
One of the means by which E2 indirectly affects energy metabolism is by altering the
actions of the hormone insulin. While there is evidence indicating that E2 has transient
effects on insulin, the results from research studies are notuniversally in agreement. For
example, some studies have indicated an increase in resting insulin, specifically in the luteal
phase of the menstrual cycle (high E2 levels), while other studies have shown no difference in
insulin whether E2 concentration is high or low (8, 11, 12). Similarly, studies on the effects of
E2 on the insulin response to an acute bout of exercise have also produced mixed results (11,
13, 14). Bonen et al. (11) observed similar concentrations of insulin between the follicular
3
concentration of insulin in the luteal phase of the menstrual cycle. Finally, Hackney et al.
(14) observed an increased concentration of insulin in the luteal phase of the menstrual cycle.
The limited number of studies examining the issue of E2 on insulin (especially relative to
exercise), and the contradictory nature of findings, suggests more research is needed to create
a better understanding of the hormonal interactions between E2 and insulin during exercise.
Therefore the present study was proposed.
Taken from: Bunt J. Metabolic actions of estradiol: significance for acute and chronic exercise responses. Med Sci Sports Exerc. 1990; 22(3): 286-290.
Purpose of the Study:
The purpose of this study was to determine the influence of changes in circulating E2
levels on the insulin response to an acute bout of exercise in college age women, who were
4
during the mid-follicular (low E2) and mid-luteal (high E2) phases of their menstrual cycles.
This study required each participant to make three visits to the laboratory. The initial visit
was an orientation and maximal oxygen uptake (VO2max) test. The following two sessions
(session I and II) were testing days and were scheduled during the mid-follicular (low E2)
and mid-luteal (high E2) phases of the menstrual cycle. During sessions I and II, participants
completed 60 minutes of treadmill exercise at 65% of their predetermined VO2max (enough
time and intensity to illicit a change in insulin responsiveness based on previous research)(6).
Blood samples were taken at baseline, immediately post-exercise, and 30 minutes into
recovery to determine E2 and insulin concentrations.
Research Questions:
1. Was there a significant difference in blood insulin concentrations (µIU/mL)
during the mid-follicular phase when compared to blood insulin levels during the
mid-luteal phase?
a. Was there a significant difference in insulin concentration at baseline
between the mid-follicular phase and mid-luteal phase?
b. Was there a significant difference in insulin concentration immediately
post-exercise between the mid-follicular phase and mid-luteal phase?
c. Was there a significant difference in insulin concentration 30 minutes into
recovery between the mid-follicular phase and mid-luteal phase?
2. Did the added stress of exercise cause a significant change in relative (percentage,
%) blood insulin concentrations when comparing insulin concentrations pre- and
post-exercise during the mid-follicular phase to insulin concentrations pre- and
5
a. Was there a significant percent change in relative blood insulin
concentration between baseline and immediately post-exercise when
comparing the mid-follicular phase to the mid-luteal phase?
b. Was there a significant percent change in relative blood insulin
concentration between baseline and 30 minutes into recovery when
comparing the mid-follicular phase to the mid-luteal phase?
Research Hypotheses:
1. There is a significant difference in blood insulin levels during the mid-follicular
phase when compared to blood insulin levels during the mid-luteal phase.
a. Insulin concentration at baseline is significantly higher during the
mid-luteal phase compared to the mid-follicular phase.
b. Insulin concentration immediately post-exercise is significantly higher
during the mid-luteal phase compared to the mid-follicular phase.
c. Insulin concentration 30 minutes into recovery is significantly higher
during the mid-luteal phase compared to the mid-follicular phase.
2. The added stress of exercise did not cause a significant change in blood insulin
levels when comparing insulin concentrations pre- and post-exercise during the
mid-follicular phase to insulin concentrations pre- and post-exercise during the
mid-luteal phase.
a. There is no significant percent change in insulin concentration between
baseline and immediately post-exercise when comparing the mid-follicular
6
b. There is no significant percent change in insulin concentration between
baseline and 30 minutes into recovery when comparing the mid-follicular
phase to the mid-luteal phase.
Definition of Terms:
Estrogen (E2): an 18-carbon steroid secreted mainly from the ovaries, the major
estrogen is estradiol. Estrogen concentrations in the blood vary dramatically over the
menstrual cycle with levels being lower in the mid-follicular phase and increasing in
the mid-luteal phase (1). Estrogen status can be linked to changes in lipid and
carbohydrate metabolism (8).
Insulin: a polypeptide hormone secreted from the cells of the pancreas. Insulin
stimulates glucose uptake throughout the body, resulting in a decrease in blood
glucose levels. Exercise decreases insulin concentration in the blood (1)
Mid-follicular phase: Days 3 – 7 of the menstrual cycle, E2 levels in the blood are low (1)
Mid-luteal phase: Days 20 – 25 of the menstrual cycle, E2 levels in the blood are high (1)
Assumptions:
1. Subjects were honest about use of hormonal contraceptives and medications.
2. Subjects were not pregnant or trying to become pregnant. Pregnancy would alter the
normal menstrual cycle E2 response.
3. Subjects complied with exercise and dietary guidelines before exercise sessions.
Delimitations:
1. Healthy, recreationally active, premenopausal women between ages 18 – 30.
7
3. Subjects were not using hormonal contraceptives or had not used any other hormonal
therapy for six months prior to the study.
4. Subjects were not taking insulin or other medications that may affect the insulin
response.
Limitations:
1. Subjects consisted of only eumenorrheic women abstaining from hormonal
contraceptives; consequently the results are not applicable to men, amenorrheic
women, postmenopausal women, and women taking hormonal contraceptives or
hormone therapy.
2. The results are not applicable to persons who take insulin or have metabolic disorders
such as diabetes.
3. Exercise sessions consisted of running so results may not be applicable to other forms
of exercise.
Significance of Study:
The results of this study will add to the limited knowledge of the effects of E2 on insulin
concentrations in response to an acute bout of exercise. An increased knowledge of such
effects in response to an acute bout of exercise can have significance in further understanding
the metabolic role E2 has on insulin, energy use, and the development of metabolic disease.
Unfortunately, additional inquires cannot be answered without increased familiarity of the
interactions between E2 and insulin in a young healthy premenopausal population. Increased
understanding of the interactions between E2 and insulin in a young healthy premenopausal
population may lead to understanding the E2 and insulin interaction in postmenopausal
8
decrease with age and menopause begins, insulin concentrations should be affected. Due to
the interaction of E2 and insulin, and the variations of hormone concentrations with age,
exercise prescriptions and nutrition recommendations may need to be altered to meet the
CHAPTER II
Review of Literature
This chapter is divided into seven sections. The first section is a brief summary of
insulin and its effects on the body during rest. The second section gives an overview of
studies documenting the interactive effects of insulin and exercise. Within the second section
the effects of insulin during exercise are discussed in an acute bout of exercise in a healthy
untrained population; then the effects of insulin and training are discussed. The third section
is a brief summary of E2 its effects on the body during rest. The fourth section gives an
overview of studies documenting the interactive effects of insulinand exercise. Within the
fourth section the effects of E2 during exercise are discussed in an acute bout of exercise
focusing on women and comparing women and men; then the effects of E2 during exercise
are discussed in women who are habitually active. The fifth section is a brief summary of the
interaction of insulin and E2. The sixth section gives an overview of studies documenting the
interactive effects of E2, insulin, and exercise. Within the sixth section the interactive effects
of E2, insulin, and exercise are discussed in acute bouts of exercise varying in time from 60
minutes to 120 minutes, and varying in intensity from 50% to 80% of VO2max. The sixth
section moves from exercise without a glucose load, to exercise with a glucose load, and
finally exercise comparing a fasted state to a glucose loaded state. The seventh and final
10 Insulin
Insulin is a polypeptide hormone secreted from the beta-cells of the pancreas. At rest,
the consumption of nutrients causes a release of insulin, stimulating glucose uptake into
different body tissues (15). Insulin promotes glycogen synthesis in muscle tissue and fat
synthesis in adipose tissue, creating energy stores within the body (3). Ultimately the actions
of insulin result in a decrease in blood glucose levels (1). As blood glucose decreases,
insulin release from the pancreas is inhibited through a feedback mechanism, allowing the
level of glucose in the blood to be tightly regulated (2). Insulin concentrations in the blood
never reach zero. Even during fasting conditions there is still a small concentration of insulin
in the blood stream (15). The antagonistic hormonal counterpart to insulin is glucagon,
which promotes glycogenolysis and gluconeogenesis. When comparing the two hormones, a
high Insulin/Glucagon (I/G) ratio usually causes a decrease in blood glucose, while a low I/G
ratio usually causes an increase in blood glucose (1).
Insulin and Exercise
To determine if insulin and exercise had an additive or synergistic effect, DeFronzo et
al. (5) compared 10 healthy males, who had no history of diabetes and had completed a 12 –
24 hour fast, using four separate study protocols. Subjects all maintained a similar diet for
three days leading up to each laboratory visit. Study one looked at the effects of insulin
alone using an insulin clamp technique. Study two looked at the effects of exercise alone on
glucose uptake after 30 minutes of cycling at 40% VO2max. Study three combined protocols
from study one and two. In study protocol three, subjects underwent the same insulin clamp
technique as in study protocol one, afterwards subjects then cycled for 30 minutes at 40%
11
placed in the femoral artery and femoral vein to monitor glucose activity within the legs.
Results from all four protocols, indicated that insulin and exercise act synergistically to
enhance glucose metabolism in skeletal muscle tissue.
Mikines et al. (6), used euglycemic hyperinsulinemic clamp tests to observe the
effects of exercise and insulin after one hour of rest, one hour of cycling at 64% VO2max,
and 48 hours after one hour of cycling at 64% VO2max, in seven untrained healthy males
without a family history of metabolic disorder or diabetes. For three days prior to each
laboratory visit, subjects ate a “weight-maintaining diet” and refrained from strenuous
physical activity. Subjects refrained from tobacco and alcohol the day before, and fasted the
night before each laboratory visit. Results showed that one hour of exercise increases insulin
sensitivity and responsiveness in untrained subjects that lasts for 48 hours into recovery from
the exercise (6).
King et al. (7) demonstrated that exercise training increases insulin sensitivity.
Subjects, five men and four women, were all exercising as least 45 minutes per day, five to
seven days per week. Diets were recorded for three days before the first euglycemic
hyperinsulinemic clamp test, and the diet was repeated for three days before the second
euglycemic hyperinsulinemic clamp test. All tests occurred after an overnight fast. The first
euglycemic hyperinsulinemic clamp test took place while the subjects were still exercising,
while the second test took place after the subjects had been physically inactive for 10 days.
Results indicate after 10 days of physical inactivity, the increased insulin sensitivity that
accompanies exercise training reverses when exercise stops (7).
Although the aforementioned studies have primarily male subjects, the same effects
12
inhibited by the sympathetic nervous system in order to maintain adequate concentrations of
blood glucose; i.e., to provide a means by which non-insulin dependent glucose uptake can
be increased at skeletal muscle (4). The inhibition of insulin release decreases insulin
concentration in the blood. However, insulin concentrations in the blood never reach zero
(15). Therefore exercise can only force insulin concentration to decrease to the lower limit of
the normal hormonal range. This phenomenon is referred to as the “basement effect” (16).
Estradiol
E2 is an 18-carbon steroid hormone derived from cholesterol, and is the main estrogen
secreted by the ovaries in females (1). E2 helps to control ovulation, menstruation, and
pregnancy, but can also have influence on blood vessels, bones, lungs, liver, intestines and
metabolism (2). E2 varies dramatically over the menstrual cycle, with concentrations being
lower in the follicular phase (days 1 – 14) and higher in the luteal phase (days 15 – 28) (1).
Both animal and human model research has shown during rest, E2 can lead to increased
lipolysis and decreased gluconeogenesis and glycogenolysis (8, 17).
Estradiol and Exercise
Hackney et al. (9) collected data on substrate utilization from nine eumenorrheic
women performing 30 minutes of running which increased in intensity every 10 minutes
from 35% VO2max, to 60% VO2max, and finally to 75% VO2max. Exercise bouts were
conducted during both the mid-follicular and mid-luteal phases of the menstrual cycle.
Results showed that during exercise at 35% and 60% of VO2max lipid utilization was
significantly greater during the mid-luteal phase of the menstrual cycle when E2 is elevated.
There was no difference between substrate utilization and phase of the menstrual cycle
13
In a study performed by Bailey et al. (18), nine healthy eumenorrheic women, not
using oral contraceptives, cycled at 70% of peak oxygen uptake (VO2peak) until exhaustion.
Exercise trials were performed twice during the follicular phase and twice during the luteal
phase. Subjects were asked to refrain from caffeine and alcohol 12 hours prior to testing and
strenuous exercise 24 hours prior to testing. On the day of exercise testing all subjects were
fed a standard breakfast at the laboratory. The purpose of this investigation was to determine
if E2 influenced the effect of carbohydrate supplementation. Results indicated that
carbohydrate supplementation is not influenced by menstrual cycle phase. It is interesting to
note that increases in performance measured by duration to exhaustion, due to
supplementation, were lower in women (11 – 14% increase) when compared to men
exercising in the same conditions (24 – 32% increase).
It has been shown that during low to moderate intensity endurance exercise, 35% -
70% VO2max, women utilize more lipids and fewer carbohydrates for metabolic energy
when compared to men (19). The higher levels of E2 in women are associated with a shift in
energy substrate utilization towards lipids (8). When E2 levels are experimentally increased
in men; use of lipids as a substrate during exercise increases, while use of carbohydrates as a
substrate during exercise decreases (19). Similar findings have been reported for male rats
administered estrogens and then exercise trained; the use of lipids as an energy substrate
increases (17). Furthermore, Hackney (20) performed muscle biopsies before and after 60
minutes of exercise (70% VO2max) in women at the mid-follicular and mid-luteal points of
their cycles, and found that muscle glycogen utilization was decreased in the luteal phase.
14
Finally, it has been documented that a negative correlation exists between habitual
exercise, of moderate intensity, and salivary E2 concentration (21). A relationship was also
observed between activity level, E2 concentration, and percentage body fat. Women who
reported low activity levels, in both the moderate and high percentage body fat groups, had a
statistically higher concentration of E2 (21). Although the authors did not state this, it could
be hypothesized that habitual exercise increases the sensitivity of E2 which creates a greater
usage of lipids during exercise.
Insulin and Estradiol
At rest, E2 can inhibit gluconeogenesis and glycogenolysis, reducing the reliance on
carbohydrate as an energy source while enhancing lipid reliance by increasing the I/G ratio
(8, 9). If the I/G ratio is elevated for a prolonged amount of time, insulin sensitivity may
decrease causing metabolic disorders like type two diabetes mellitus (8). Estradiol brings
about these actions by direct effects on tissues through interactions with E2 receptors and
indirectly by its actions on other hormones in the endocrine system. For example, relative to
this last point, elevated E2 levels promote enhanced growth hormone release from the anterior
pituitary and growth hormone induces increased lipolysis activity (10). There is some
evidence that E2 has direct effects on insulin receptors in adipocytes, however further
research is merited (22). In mice, it has been shown that E2 supplementation protects against
beta cell apoptosis, while in women E2 supplementation improves insulin sensitivity (22).
Again, Figure 1 schematically depicts some of the direct and indirect physiologic means by
15 Insulin, Estradiol, and Exercise
Horton et al. (12) studied glucose kinetics across three phases of the menstrual cycle;
early follicular, mid-follicular, and mid-luteal. Thirteen eumenorrheic, active females not
using oral contraceptives or other hormones, were recruited to cycle for 90 minutes at 50% of
VO2max. Diet and exercise were controlled for three days, with an overnight fast the night
before exercise. Results showed significantly higher levels of insulin during the first 45
minutes of exercise in the mid-luteal phase when compared to either point in the follicular
phase. Based on other measurements taken, glucose utilization appeared equivalent across
the menstrual cycle but was coupled with higher levels of insulin within the mid-luteal phase.
Although not statistically significant, resting levels of insulin were higher during the luteal
phase then the early follicular or mid-follicular phases.
In an exercise study performed by Lavoie et al. (13), eumenorrheic, physically active
females not taking oral contraceptives cycled for 90 minutes at 63% of maximal oxygen
uptake (VO2max) during the mid-follicular and mid-luteal phases of their menstrual cycles.
Twenty-four hours before the exercise session, all subjects were restricted to a carbohydrate
poor diet. Results indicated lower insulin values during the luteal phase of the menstrual
cycle; however the concentration difference between phases was not statistically significant.
In both phases insulin decreased significantly, and in a similar fashion, over the course of the
exercise bout. It is interesting to note that these women were starting the exercise session
glycogen depleted, following a carbohydrate poor diet and an overnight fast.
In a study conducted by Hackney et al. (14), eight recreationally active, eumenorrheic
women performed 60 minutes of cycle ergometry at 70% of VO2max after ingesting an oral
16
beginning exercise. Testing occurred in both the follicular and luteal phases of the menstrual
cycle and both diet and exercise were replicated before testing days. At the onset of exercise
insulin decreased similarly in both the follicular and luteal phases. However, results from
this study show a statistically significant higher peak insulin response before beginning
exercise in the luteal phase than in the follicular phase. Indicating insulin response to a
glucose challenges differs with the stages of the menstrual cycle.
Campbell et al. (23), observed eight endurance trained eumenorrheic women during
the follicular and luteal phases of the menstrual cycle. None of the subjects were taking oral
contraceptives. Diet was controlled before each exercise trial and no food was allowed the
morning of a laboratory visit. Four exercise sessions were conducted consisting of two hours
of cycling at 70% of VO2max followed by a 4kJ/kg body weight time trial. Two sessions
were supplemented with carbohydrate loaded beverages; the other two sessions were
supplemented with a placebo. Results indicated that variations in E2 levels throughout the
menstrual cycle altered exercise metabolism, but that the alterations due to E2 levels dissipate
with glucose supplementation. Resting insulin levels were not significantly different
between trials; however insulin tended to be higher during the luteal phase.
Bonen et al. (11) divided 19 eumenorrheic women, not taking oral contraceptives,
into three groups: a control group, a fasting group, and a loaded group. The
glucose-loaded group consumed the glucose load 17 minutes before the onset of exercise. Subjects
performed 30 minutes of walking on a treadmill at 40% of VO2max followed by 30 minutes
of walking up a steep incline at 80% of VO2max. Exercise sessions were performed during
both the follicular and luteal phases of the menstrual cycle. Diet was recorded before the
17
when nutritional status is normal, insulin response to exercise is similar in both the follicular
and luteal phase. In the glucose loaded group, insulin levels and response to exercise were
similar between the two phases of the menstrual cycle. The group of women that fasted had
significantly higher insulin levels in the luteal phase than in the follicular phase.
Summary
In summary, insulin stimulates glucose uptake and promotes glycogen synthesis in
muscle tissue and fat synthesis in adipose tissue, creating energy stores within the body (1).
Exercise and insulin work synergistically to enhance the metabolism of glucose, and these
effects can last up to 48 hours after the bout of exercise (5, 6). Training increases insulin
sensitivity but sensitivity will decline with the cessation of exercise (7).
Estradiol is the main estrogen secreted by the ovaries in females and can lead to
increased lipolysis, decreased gluconeogenesis and glycogenolysis due, in part, to the
influence E2 has on increasing the I/G ratio (1, 8). Research has demonstrated that during
low to moderate intensity exercise, lipids are oxidized more during the mid-luteal phase of
the menstrual cycle. However as exercise intensity increases there is no difference between
substrate utilization and menstrual cycle phase (9). At high exercise intensity there is no
difference in substrate utilization when subjects supplement with carbohydrates (18). When
compared to their male counterparts, women utilize lipids more than men during endurance
exercise due to increased levels of E2 (8, 19). Finally, physical activity has a negative
relationship with E2, as activity increases; E2 decreases (21).
There is varying information about the effects of E2, insulin, and exercise. Horton et
al. (12) found significantly higher levels of insulin during the first 45 minutes of exercise in
18
no significant difference in insulin when comparing different phases of the menstrual cycle.
Hackney et al. (14) showed a statistically significant higher peak insulin response after an
oral glucose load but, before beginning exercise in the luteal phase than in the follicular
phase; indicating insulin response to a glucose challenge differs with the stages of the
menstrual cycle. However, it was found that at the onset of exercise insulin decreased
similarly in both the follicular and luteal phases.
Variations in E2 levels throughout the menstrual cycle alter exercise metabolism, but
that the alterations due to E2 levels dissipate with glucose supplementation (23). When
subjects have not undergone an overnight fast or a pre-exercise glucose load, insulin response
to exercise is similar in both the follicular and luteal phase. However, fasted subjects have
CHAPTER III
Methodology
This study required each participant to make three laboratory visits. The initial visit
consisted of an orientation and maximal oxygen uptake (VO2max) test. The following two
sessions were submaximal exercise sessions and were scheduled during the mid-follicular
(low E2) and mid-luteal (high E2) phases of the menstrual cycle. During the exercise
sessions, participants completed 60 minutes of treadmill running at 65% of their
predetermined VO2max. Blood samples were taken at baseline, immediately post-exercise,
and 30 minutes into recovery from exercise, to determine E2 and insulin concentrations.
Subjects
Sample size was determined using PS: Power and Sample Size Calculation version
3.0.43 (Vanderbilt University, Nashville, TN). An α level of 0.05 required a total of ten
subjects to achieve a power of 0.80 (β). Insulin concentrations used in the power calculation
were taken from a previous investigation performed by Bailey et al. (Bailey et al., 2000).
Healthy, recreationally active women between the ages of 18 – 30 were recruited. Subjects
were premenopausal and eumenorrheic for six months prior to the investigation.
Eumenorrhea was defined as having a consistent menstrual cycle lasting 24 – 35 days.
Subjects could not be using hormonal contraceptives or have used any other hormonal
therapy for six months prior to the study. Subjects could not be taking insulin or other
20
Subjects who were pregnant, taking insulin or any other medications that would affect
the insulin response, and/or had sustained an injury in the last six months that would limit
their ability to exercise were excluded from the study. If any contraindications to exercise
given by the American College of Sports Medicine (24) were discovered during the physical
examination or an irregular heart rhythm was discovered during the 12-lead
electrocardiogram, the subject was excluded from the study and advised to follow–up with
their physician (Appendix A)(24).
Instrumentation
Subject height was measured using a stadiometer (Perspective Enterprises, Portage,
MI). Subject mass was measured using a mechanical scale (Detecto, Webb City, MD).
Electrocardiograms were performed using a Schiller AT 10 Plus EKG unit (Schiller AG,
Switzerland). A Lange skinfold caliper (Model 68902, Cambridge Scientific Industries, Inc.,
Cambridge, MA) was used to determine body composition. All treadmill exercise was
performed on a Quinton MODEL Q65 treadmill (Cardiac Science Corporation Bothell, WA).
Expired gas was collected using Parvo Medics TrueMax® 2400 Metabolic System (Parvo
Medics, Salt Lake City, UT). Exercise heart rate was monitored using a Polar heart rate
monitor (Polar Electro Inc., Lake Success, NY). Rating of perceived exertion (RPE) was
determined using the Borg scale. Ovulation was determined using BabyHopes™ Ovulation
One-Step test strips (BabyHopes.com). Hematocrit was determined using microcapillary
tubes (Fisher Scientific International Inc., Hampton, NH), hematocrit tubes were sealed with
critoseal capillary tube sealant (Krakeler Scientific Inc., Albany, NY), centrifuged with an
Adams MCHT II microhematocrit centrifuge (Beckton Dickinson, Franklin Lakes, NJ), and
21
Needham Heights, MA). Hemoglobin was analyzed using the stat-site WT-9 hemoglobin
meter (Stanbio Laboratory, Boerne, TX). Lactate was measured using a Lactate+ Analyzer
(NOVA Biomedical, Waltham, MA) and glucose was measured using a ONE TOUCH
glucometer (LifeScan, Milpitas, CA). To separate plasma and serum, an IEC Centra-8R
refrigerated centrifuge (International Equipment Company, Needham Heights, MA) was
used. Estradiol levels were determined using an enzyme-linked immunoabsorbent assay
(ELISA) (Abnova, Walnut, CA). Insulin levels were determined also using an ELISA
(Abnova, Walnut, CA).
Protocol
Orientation/Maximal Oxygen Uptake Session
Subjects were asked to come to the Applied Physiology Laboratory at the University
of North Carolina at Chapel Hill. The study protocol, schedule, inherent benefits, and
potential risks were explained, and the subject was given an opportunity to ask questions
before written informed consent was obtained (Appendix B). The subject then completed the
Department of Exercise & Sports Science medical history questionnaire and completed a
12-lead electrocardiogram and physical examination (Appendix C). Height and body mass were
obtained and the subject was fitted with a heart rate monitor. The subject then rested in a
supine position for 10 minutes to obtain a resting heart rate. Next the subject was fitted for a
mouthpiece used to collect expired gases. A Bruce treadmill protocol test was administered
to determine VO2max. Respiratory gases, for indirect calorimetry, and heart rate were
monitored continuously throughout the test. Heart rate was recorded at the end of every
minute, and rate of perceived exertion (RPE) was recorded at the end of every three minute
22
dropped below 120 beats per minute. Subjects were then asked to passively rest, if no
adverse responses to exercise were observed the subject was allowed to leave once their heart
rate decreased below 100 beats per minute.
The criteria to determine a maximal response to the VO2max test were: a respiratory
exchange ratio of 1.1 or greater, reaching age predicted maximal heart rate (±5%), a RPE of
18 or greater, and a decrease or plateau in VO2 with increased workload. If all three criteria
were not met then the test was classified as a VO2peak. The highest VO2 (max or peak)
obtained during the test was used to calculate the running speed for the submaximal bouts of
exercise. Running speeds to elicit 65% of VO2max were determined using ACSM metabolic
calculations (24).
Menstrual Phase Determination
Subjects informed the investigator on first day of menses, which was denoted as day
one. The forward counting method was used to determine scheduling of the next two
exercise sessions (25). The follicular phase was 7 ± 2 days after menses. The
mid-luteal phase was 20 + 2 days after menses. The next two exercise sessions were scheduled
using the onset of menses as day one and counting forward until reaching either the
mid-follicular or mid-luteal phase. Urinary ovulation testing was used to support the forward
counting method. At the end of the orientation session each subject was given an ovulation
kit and instructions on how to determine the first day of ovulation (Appendix D). The
mid-follicular and mid-luteal dates were based off of an average 28 day menstrual cycle. If a
subject had a longer/shorter cycle length adjustments were made in the specific days of
23 Exercise Sessions
The subject reported to the laboratory at a similar time for each exercise session.
Twenty-four hours prior to each of the 60 minute 65% VO2max exercise sessions, the subject
was asked to drink plenty of water, refrain from caffeine and alcohol, record their food intake
in a dietary log, and refrain from strenuous exercise. Two hours prior to the exercise session,
subjects were asked to refrain from eating or drinking anything besides water. Upon arrival
to the laboratory the subject was asked to complete a brief questionnaire to ensure that they
had complied with physical and dietary guidelines (Appendix E). Dietary logs were
reviewed and photo copied. The original dietary log was kept by the investigator and the
copy was given back to the subject so they could repeat the same diet 24 hours prior to the
second exercise session. Once compliance was established the subject was fitted with a heart
rate monitor and asked to rest for 10 minutes in a supine position. After the 10 minutes,
resting heart rate was recorded, and a three mL blood sample was collected by a certified
phlebotomist using a venipuncture technique. The blood samples were placed into K2-EDTA
blood collection tubes and immediately placed on ice. The blood samples were used to
confirm menstrual cycle status and determine resting levels of E2 and insulin, in analyses
performed later. After the resting blood draw the subject moved to the treadmill and was
fitted with a mouthpiece. Resting respiratory gases were collected for four minutes to
determine resting VO2. Next, each subject had 10 minutes to warm-up; five minutes of
walking on the treadmill and five minutes of stretching. Following the warm-up the subject
ran on the treadmill at 0% incline and a speed that elicited 65% of their VO2max. At six
minutes, 26 minutes, and 56 minutes the subject was asked to insert the mouthpiece back into
24
was to ensure running speed was appropriate and to allow adjustments in speed if needed.
Any adjustments that occurred in the first 60 minute exercise trial were replicated for the
second trial. Heart rate and RPE was recorded at 10 minutes, 30 minutes, and 60 minutes.
The above procedures are depicted in Figure 2. Throughout the exercise session the subject
was able to drink water at their convenience, listen to music, and have access to a fan to keep
cool.
At the completion of exercise another three mL blood sample was collected,
following the same procedure, placed in a K2-EDTA blood collection tube and immediately
placed on ice. The subject was then asked to rest in a supine position for 30 minutes. At the
end of the 30 minutes of recovery, a final three mL blood sample was collected, following
the same procedure, placed in a K2-EDTA blood collection tube and immediately placed on
ice. After the final blood draw, if no adverse reactions to exercise were observed, the subject
was released from the laboratory if their heart rate was below 100 beats per minute. The
subject repeated the protocol for both the mid-follicular and mid-luteal phases of the
menstrual cycle.
25 Blood Analysis
Hematocrit
Resting and post-exercise hematocrit were determined for each exercise session.
Whole blood was drawn into a heparin treated microcapillary tube, sealed, and centrifuged
for three minutes at 12,000 revolutions per minutes in a microhematocrit centrifuge. The
microcapillary tube was then placed on a hematocrit wheel and the ratio of red blood cells
within the blood was determined. Hematocrit measures were performed in triplicate and
averaged.
Hemoglobin
Resting and post-exercise hemoglobin were determined for each exercise session.
Twenty-five microliters of whole blood was pipetted onto a slide and analyzed using a
handheld analyzer. Hemoglobin measures were performed in triplicate and averaged.
Plasma Volume
To ensure that changes in E2 and insulin were not due to hemoconcentration effects
alone, plasma volume shifts were calculated using the Dill and Costill method, which uses
hematocrit and hemoglobin changes (26). The percent changes in the plasma volume shifts
werecompared to the percent changes in hormonal concentrations following exercise to
determine the degree of hemoconcentration influence.
Lactate and Glucose
Post-exercise blood samples were analyzed for lactate concentration using a lactate
analyzer. Pre-exercise, post-exercise, and recovery blood samples were analyzed for glucose
26 Estradiol and Insulin
In order to separate the plasma, blood samples were centrifuged at 3000 X g for 15
minutes at 4° C. Plasma and serum were removed from the centrifuged samples and frozen
at -80°C until analyzed later for E2 and insulin concentrations. E2 and insulin concentrations
were determined using an ELISA and performed in duplicate. Specific directions of the
assay procedures can be found in the appendix (Appendices F and G).
Statistical Analysis
All statistical analyses were done using SPSS statistical software (version 19.0,
Chicago, IL). Significance was set a priori at an α < 0.05. All values were displayed as
means + standard deviations (SD).
To determine if there was significant difference in blood insulin concentrations
(µIU/mL) during the mid-follicular phase when compared to blood insulin concentrations
during the mid-luteal phase, a 2x3 (menstrual phase [mid-follicular phase, mid-luteal phase]
x exercise time [pre-exercise, immediately post-exercise, 30 minutes into recovery]) repeated
measures model analysis of variance (ANOVA) was used with a Bonferroni post hoc test if a
significant F-ratio was obtained.
Insulin concentration percent change from exercise to post-exercise and
pre-exercise to recovery was calculated.To determine if there was a significant difference in
percent change a 2x2 (menstrual phase [mid-follicular, mid-luteal] x percent change in
insulin [pre-exercise to immediately post-exercise, pre-exercise to recovery]) repeated
measures model ANOVA was used with a Bonferroni post hoc test if a significant F-ratio
was obtained. Figure 3 shows the calculations used to determine percent change in insulin
27
Figure 3: Calculations used to determine percent change in insulin concentration overtime.
Pre-exercise to immediately post-exercise:
(([POST] – [PRE]) / [PRE]) x 100 = percent change
Pre-exercise to 30 minutes into recovery:
(([REC] – [PRE]) / [PRE]) x 100 = percent change
[PRE] – concentration of insulin pre-exercise
[POST] – concentration of insulin immediately post-exercise
CHAPTER IV
Results
Subject Characteristics
Twelve healthy women were recruited for this study. Two women were unable to
complete the study due to personal reasons, leaving ten remaining women who completed all
aspects of the study. All subjects met the inclusion criteria of healthy, recreationally active,
ages 18 – 30, eumenorrheic (≥ six months) prior to the investigation, not using hormonal
contraceptives or other hormonal therapy, and lastly not taking any insulin or other
medication that may affect the insulin response. Subject physical characteristics can be
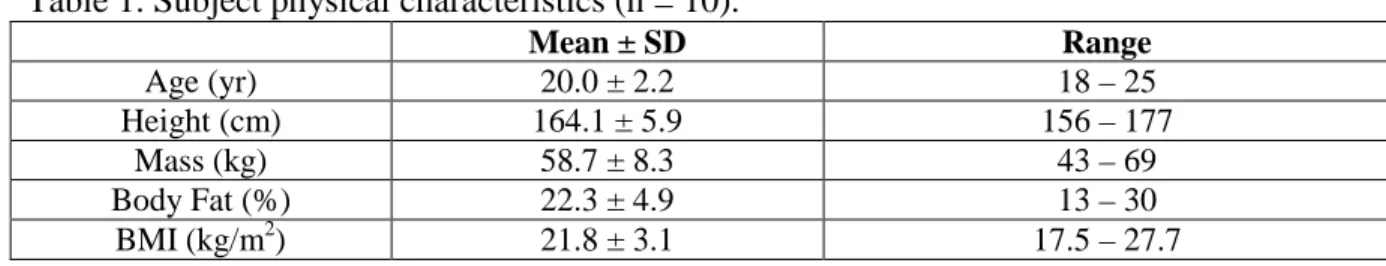
found in Table 1.
Table 1. Subject physical characteristics (n = 10).
Maximal Oxygen Uptake Determination
The criteria for a maximal response to the VO2max test were: a respiratory exchange
ratio of 1.1 or greater, reaching age predicted maximal heart rate (± 5%), a RPE of 18 or
greater, and a decrease or plateau in VO2 with an increased workload. The VO2max tests
were stopped due to subject volitional fatigue. Therefore, only five subjects met all of the
criteria for a maximal response to the VO2max test. Since not all of the subjects met all of
the criteria for a VO2max test, the tests will be referred to from here on out as VO2peak tests.
Mean ± SD Range
Age (yr) 20.0 ± 2.2 18 – 25
Height (cm) 164.1 ± 5.9 156 – 177
Mass (kg) 58.7 ± 8.3 43 – 69
Body Fat (%) 22.3 ± 4.9 13 – 30
29
The mean (± SD) time of the VO2peak tests were 846.5 ± 79.9 seconds. The mean respiratory
exchange ratio was 1.19 ± 0.05, the mean maximal heart rate was 190 ± 6 bpm, and the mean
maximal RPE was 18 ± 2. The mean VO2peak was 50.7 ± 9.0 ml/kg/min with a range of 38
– 65 ml/kg/min.
Menstrual Phase Determination
Each subject was asked to use an ovulation kit to determine ovulation, which was
used to help determine the dates for the first and second exercise sessions. The average
length of the menstrual cycle was 30 ± 3 days. Testing during the mid-follicular phase, low
E2 concentrations, occurred on day 5 ± 3 of the menstrual cycle; while testing during the
mid-luteal phase, high E2 concentrations, occurred on day 24 ± 4 of the menstrual cycle.
Mean E2 concentration during the mid-follicular phase was 27.04 ± 6.12 pg/ml. Mean E2
concentration during the mid-luteal phase was 67.64 ± 21.7 pg/ml. The difference in E2
concentrations between the mid-follicular and mid-luteal phases was significant (t = -5.695; p
< 0.001).
Exercise Sessions One and Two
Subjects ran for one hour at 69.7 ± 7.3% of their pre-determined VO2peak during the
mid-follicular phase and 67.6 ± 7.9% of their pre-determined VO2peak during the mid-luteal
phase. VO2 during each exercise session was collected breath by breath but averaged over 15
second intervals. However, there was no significant difference in the running intensities
between exercise sessions (t = 0.617; p = 0.545).
Heart rates at rest, and all three time points during exercise, were compared between
both exercise sessions. Resting HR was 75 ± 13 bpm during the mid-follicular phase and 66
30
interaction effect of menstrual cycle phase and time point at rest (p = 0.169) and during
exercise (p = 0.169) on HR between the mid-follicular and mid-luteal phases of the menstrual
cycle (F = 2.259; p = 0.169). There was no significant difference found due to the main
effect for differing phases of the menstrual cycle (F = 0.098, p = 0.762). There was a
significant difference due to the main effect of time from rest to the exercise (F = 59.564; p <
0.001). A post hoc determined the exercise HR at all measurement points were greater than
the resting HR (p < 0.001), but not different from one another (p > 0.05). Heart rates during
exercise are reported in Table 2.
The RPE at all three exercise time points were compared between both exercise
sessions (Table 2). There was no significant difference due to the interaction effect of
menstrual phase and time during exercise on RPE between the mid-follicular and mid-luteal
phases of the menstrual cycle (F = 0.499; p = 0.625). There was no significant difference
found due to the main effect for differing phases of the menstrual cycle (F = 3.115; p =
0.111). There was a significant difference found due to the main effect of time during
exercise (F = 8.565; p = 0.010). A post hoc determined all time points during exercise
differed significantly from one another (p < 0.05).
Oxygen uptake averaged over each monitored time point was compared between both
sessions (Table 2). No significant difference was found due to the interaction effect of
menstrual cycle phase and time during exercise (F = 1.859; p = 0.225). No significant
difference was found due to main effect between phases of the menstrual cycle (F = 2.662; p
= 0.137). There was a significant difference due to the main effect between time points
31
occurred when comparing 10 minutes to 60 minutes (p = 0.028) and 30 minutes to 60
minutes (p = 0.017).
The RER during the last minute of each monitored time period was compared
between both exercise sessions (Table 2). There was not a significant difference found due
to the interaction effect of menstrual cycle phase and time point during exercise (F = 3.912, p
= 0.065). There was not a significant difference found due to the main effect between phases
of the menstrual cycle (F = 0.06, p = 0.813). There was a significant difference in RER
between the different time points during exercise (F= 9.359, p = 0.008). A post hoc analysis
determined the specific significance was the RER at 10 minutes (0.91 ± 0.05; 0.90 ± 0.06)
and 60 minutes (0.88 ± 0.06; 0.86 ± 0.07) as the RER decreased over time (p = 0.004).
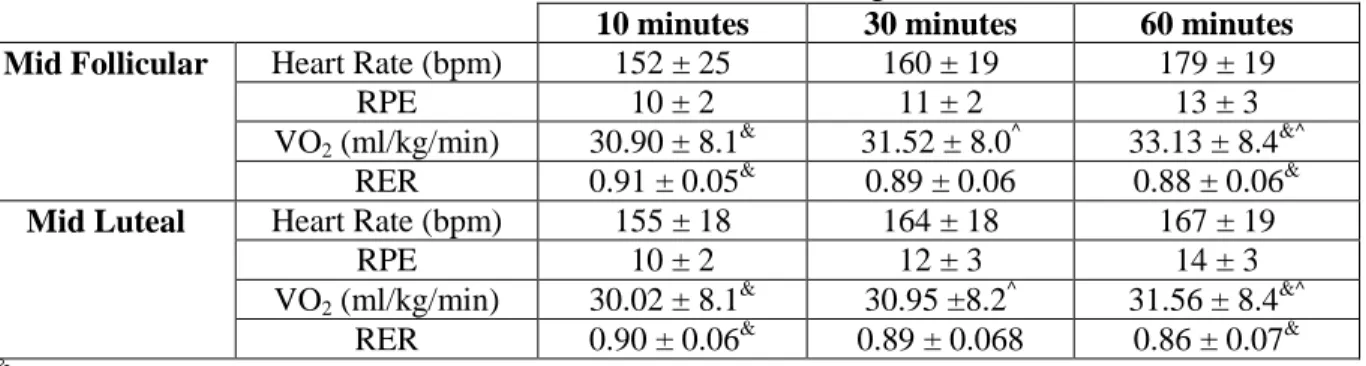
Table 2. The HR, RPE, and VO2 measurements during the one hour exercise sessions at 65% of VO2max during the mid-follicular and mid-luteal phases of the menstrual cycle. The HR, RPE, and VO2 were obtained at 10, 30, and 60 minutes during the exercise.
10 minutes 30 minutes 60 minutes
Mid Follicular Heart Rate (bpm) 152 ± 25 160 ± 19 179 ± 19
RPE 10 ± 2 11 ± 2 13 ± 3
VO2 (ml/kg/min) 30.90 ± 8.1 &
31.52 ± 8.0^ 33.13 ± 8.4&^ RER 0.91 ± 0.05& 0.89 ± 0.06 0.88 ± 0.06&
Mid Luteal Heart Rate (bpm) 155 ± 18 164 ± 18 167 ± 19
RPE 10 ± 2 12 ± 3 14 ± 3
VO2 (ml/kg/min) 30.02 ± 8.1 &
30.95 ±8.2^ 31.56 ± 8.4&^ RER 0.90 ± 0.06& 0.89 ± 0.068 0.86 ± 0.07&
&
Indicates a significance between the 10 minute time point and the 60 minute time point, p < 0.05; ^Indicates a significance between the 30 minute time point and the 60 minute time point, p < 0.05
Lactate and Glucose Response to Exercise
Blood lactate concentrations were measured immediately post-exercise. During the
mid-follicular phase of the menstrual cycle lactate concentration was 3.0 ± 1.8 mM/L.
During the mid-luteal phase of the menstrual cycle lactate concentration was 2.4 ± 1.3
mM/L. There was no significant difference between post-exercise lactate concentrations
32
Blood glucose concentrations were measured pre-exercise, immediately
post-exercise, and 30 minutes into recovery, during both the mid-follicular and mid-luteal phases
of the menstrual cycle exercise sessions. There was no significant difference found due to
the interaction effect of menstrual cycle phase and time point (F = 0.179; p = 0.839). There
was a significant difference due to menstrual cycle phase (F = 5.731; p = 0.040), with levels
being slightly greater in the mid-follicular phase. There was also a significant difference due
to time point (F = 8.767; p = 0.010). A post hoc determined the specific significance due to
time point was between post-exercise and recovery (p = 0.007; Table 3).
Table 3.Blood glucose concentrations (mg/dL) pre-exercise, immediately post-exercise, and 30 minutes into recovery during the mid-follicular and mid-luteal phases of the menstrual cycle. Pre-Exercise (mg/dL) Post-Exercise (mg/dL) Recovery (mg/dL)
Mid-follicular 80 ± 13* 86 ± 15*# 78 ± 10*#
Mid-luteal 75 ± 11* 82 ± 10*# 76 ± 13*#
*Indicates a significant difference between the mid-follicular and mid-luteal phases of the menstrual cycle p < 0.05; #Indicates a significance between post-exercise and the recovery, p < 0.05
Insulin Response to Estradiol and Exercise
Blood insulin concentrations were measured pre-exercise, immediately post-exercise,
and 30 minutes into recovery during both exercise sessions (see Table 4). No significant
difference was found due to the interaction effect of menstrual cycle phase and time point (F
= 0.984; p = 0.415). No significant difference was found in insulin concentration due to the
main effect of menstrual cycle phase (F = 0.247; p = 0.631). In addition, no significant
difference was found in insulin concentration due to the main effect of time point (F = 0.685;
p = 0.532).
Insulin concentration percent change between exercise to post-exercise and
33
percent change was found due to the interaction effect of menstrual cycle phase and time
point (F = 0.507; p = 0.494). No significant difference was found in percent change due to
the main effect of menstrual cycle phase (F = 0.861; p = 0.378). Furthermore, no significant
difference was found in percent change due to the main effect of time point (F = 0.121; p =
0.736).
Table 4. Blood insulin concentrations (µIU/ml) pre-exercise, post-exercise, and 30 minutes into recovery during the mid-follicular and mid-luteal phases of the menstrual cycle.
Pre-Exercise (µIU/ml) Post-Exercise (µIU/ml) Recovery (µIU/ml)
Mid-follicular 3.85 ± 3.14 3.11 ± 1.64 2.69 ± 1.05
Mid-luteal 3.05 ± 1.18 2.85 ± 1.70 2.97 ± 1.09
Table 5. Insulin concentration percent change between exercise to post-exercise and pre-exercise to recovery during the mid-follicular and mid-luteal phases of the menstrual cycle.
Pre-Exercise to Post-Exercise
(%)
Pre-Exercise to Recovery
(%)
Mid-follicular -6.31 ± 22.65 -8.13 ± 20.54
Mid-luteal -1.00 ± 7.56 -0.46 ± 4.96
It should be noted that all hormonal values reported are not corrected for plasma
volume shifts. This was done because no significant main effect differences (p > 0.05) were
observed in the magnitude of the plasma volume movement because of menstrual cycle
phase. Furthermore the data for hematocrit and hemoglobin, from which plasma volume
34
Table 6. Individual measurements of VO2peak, E2, and insulin concentration percent change during the mid-follicular and mid-luteal phases of the menstrual cycle for each subject. These data are previously reported as mean ± standard deviation in earlier tables.
10 9 8 7 6 5 4 3 2 1
Subj
ec
t
45.9 64.6 43.4 42.4 63.2 55.2 45.1 53.8 38.4 54.7
VO 2pe a k (m l/k g /min )
23.55 21.05 29.11 18.93 26.81 37.63 33.49 20.74 27.00 32.06
E 2 (p g /ml ) Mi d -f o ll ic u la r
1.00 -1.62 0.71 3.78 -65.86 -16.32 -0.32 19.45 0.14 -4.08 Ins
ul in Pr e-E x erc ise t o Po st -E x er ci se (%)
0.00 -1.62 5.76 -1.66 -63.90 -17.97 -3.13 1.20 0.82 -0.74 Ins
ul in Pr e-E x erc ise to R eco v ery (%)
73.69 43.08 75.49 57.38 102.81 69.50 91.67 37.41 44.66 80.73
E 2 (p g /ml ) Mi d -L ut ea l
-6.07 -8.17 2.46 14.93 0.75 -6.76 4.05 -11.35 -0.53 0.74 Ins
ul in Pr e-E x erc ise to Po st -E x erc is e (%)
5.01 1.48 -1.68 -4.67 -0.53 -5.96 -0.45 -7.86 1.72 8.39 Ins
CHAPTER V
Discussion
The purpose of this study was to determine the influence of changes in circulating E2
concentrations on the insulin response to an acute bout of exercise (60 minutes) in college
age women, who were not using hormonal contraceptives. Circulating E2 concentrations
were manipulated by exercise testing subjects at the mid-follicular (low E2) and mid-luteal
(high E2) phases of the menstrual cycle. There was not a significant difference in resting
blood insulin concentration during the mid-follicular phase when compared to the mid-luteal
phase of the menstrual cycle. Additionally, the added stress of exercise did not bring about a
significant change in blood insulin concentrations during the mid-follicular or mid-luteal
phase of the menstrual cycle. These findings were contrary to what had been hypothesized.
Ten subjects participated in this study which was the goal in order to achieve the
pre-calculated statistical power of 0.80 (β). The subjects were healthy and met all the inclusion
criteria. Furthermore, to the knowledge of the investigator all subjects complied with all of
the study guidelines.
The physiological responses of the subjects for HR, VO2, and RPE to the 60 minute
exercise sessions showed the expected responses to such exercise, and were not significantly
different between the phases of the menstrual cycle (4). These latter findings support that
any observed changes in humoral or hormonal factors were more likely a function of
36
Since the focus of this study was on metabolism, the discussion will be delimited to
those measured outcomes that relate to energy metabolism as influenced by the hormone
insulin. Thus, only blood lactate, glucose and insulin responses are discussed at length.
Lactate Response to Exercise
Blood lactate concentration was measured post-exercise, and no difference was found
in concentrations between the mid-follicular and mid-luteal phases of the menstrual cycle.
This is consistent with earlier work where blood lactate was measured either at rest, during
exercise, or post-exercise (11, 12, 13, 23). In these studies blood lactate concentration
significantly increased as exercise time increased but there was not a significant difference in
blood lactate concentration due to changes in E2 concentration (due to different phases of the
menstrual cycle).
The observed lactate response, however, does not agree with all literature as some
studies have reported reduced lactate responses to exercise in the luteal phase of the
menstrual cycle due to an increased lipid mobilization induced by elevated E2 (27, 28). The
reason for the difference in findings between these and the present study is unclear, but may
relate to the intensity of exercise utilized. The studies finding reduced lactate responses to
exercise tended to use higher exercise intensities than the current study.
Glucose Response to Exercise
Blood glucose concentration was measured pre-exercise, immediately post-exercise,
and 30 minutes into recovery. There was a main effect of menstrual cycle phase, resulting in
blood glucose concentration being greater in the mid-follicular phase when compared to
blood glucose concentration measured in the mid-luteal phase (mid-follicular > mid-luteal).
37
concentration between immediately post-exercise and 30 minutes into recovery differed
(decrease from exercise to recovery). Previous published results are varied when looking at
the effects of E2 and exercise on blood glucose concentration.
In contrast with the current study, Horton et al. (12) found no difference in resting
glucose values between different phases of the menstrual cycle in eumenorrheic women.
However, there was a significant difference in the interaction effect of menstrual phase and
exercise time, with blood glucose concentrations being higher in the first 45 minutes of
exercise in the mid-luteal phase. Campbell et al. (23) discovered that in eumenorrheic
women, menstrual phase had no effect on blood glucose concentration, but there was a
significant decrease in blood glucose concentration at 120 minutes of exercise when subjects
were not given a carbohydrate supplement during the exercise. Lavoie et al. (13) reported a
significant interaction effect of menstrual phase and exercise time. In eumenorrheic subjects
undergoing a 24-hour carbohydrate poor diet and an overnight fast, blood glucose
concentration significantly decreased after 70 and 90 minutes of exercise in the luteal phase
of the menstrual cycle but remained constant in the follicular phase of the menstrual cycle.
Bonen et al. (11), however, reported a significant increase in blood glucose concentration
during exercise but the change was similar in each phase of the menstrual cycle. Similar
findings of Bonen et al. (11) were seen by Hackney et al. (14), who reported a similar blood
glucose response to exercise and an oral glucose load in each phase of the menstrual cycle.
In the current study blood glucose decreased from immediately post-exercise into
recovery, which contradicts some of the earlier results in studies where glucose increased.
Differences between studies may be due to the time point at which blood sampling occurred.
38
At rest and during exercise, E2 has been shown to increase lipolysis and decrease
gluconeogenesis and glycogenolysis (8, 9, 17, 20). The increased concentration of E2 and a
greater reliance on lipids as an energy source during the mid-luteal phase may be the factor
accounting for the significantly lowered blood glucose concentration in the current study (8).
This interpretation is supported by the tendency towards a lower exercise lactate
(non-significant) found in the mid-luteal phase as corroborated by other studies (27, 28). But, at
this point, this view is speculative since lipid utilization was not measured in the current
study.
Insulin Response to Estradiol and Exercise
Blood insulin concentration was measured pre-exercise, immediately post-exercise,
and 30 minutes into recovery. No significant differences were found when comparing blood
insulin concentrations between phases or across time points during exercise. Typically
exercise is associated with a reduction in circulating insulin levels (4). This did occur in the
present study, as immediately post exercise and 30 minutes into recovery insulin
concentrations were reduced from pre-exercise, but not to a level to reach statistical
significance. This lack of significance may be a function of a “basement effect” occurring
within the data values (16). That is, the initial pre-exercise concentrations of insulin were
low enough that a further reduction below a minimum background level (i.e., basement level)
was not physiologically possible or analytically detectable.
These insulin findings are in agreement with some, but not all, studies as previous
results are highly varied when looking at the effects of E2 and exercise on blood insulin
concentration. For example, Horton et al. (12) reported a significant interaction effect
39
higher during the first 45 minutes of exercise in the mid-luteal phase when compared to the
mid-follicular phase. Campbell et al. (23) reported a significant main effect of exercise time
on insulin concentration (decreasing) and, although not significant, these investigators also
reported a tendency for blood insulin concentration to be higher in the luteal phase of the
menstrual cycle (p = 0.07). Lavoie et al. (13) also reported a significant decrease in insulin
due to the main effect of exercise over time on insulin concentration (p < 0.01) in both the
follicular and luteal phases of the menstrual cycle. Although not reaching statistical
significance, Lavoie et al. did observe a trend towards lower insulin concentration during the
luteal phase of the menstrual cycle. Bonen et al. (11) reported an opposite finding to Lavoie
et al. (13), but somewhat similar to Campbell et al. (23), with slightly elevated levels of
blood insulin concentration during the luteal phase of the menstrual cycle. Regrettably, the
current findings do not add any clarity to the issue of the influence of E2 and menstrual phase
on insulin responses to exercise. These mixed findings within studies suggest further
research is needed and warranted on this topic.
Insulin Percent Change
To determine if the added stress of exercise perhaps caused varying degrees of
relative change in the insulin response during the different phases of the menstrual cycle,
blood insulin concentration percent change was calculated between pre-exercise to
immediately post-exercise and pre-exercise to 30 minutes into recovery. This means of
expressing the insulin data also resulted in no significant differences between phases or
across time points during exercise. Interestingly, all of the studies previously mentioned
looked at the absolute insulin concentrations, and how concentrations were affected by