h
e
re
P
ri
ce
s
C
o
m
e
F
ro
m
:
T
h
e
I
n
te
ra
c
ti
o
n
o
f
D
em
an
d
a
n
d
S
u
p
p
ly
Unit III
C
h
ap
te
r
3:
W
h
e
re
P
ri
ce
s
C
o
m
e
F
ro
m
:
T
h
e
I
n
te
ra
c
ti
o
n
o
f
D
em
an
d
a
n
2 of 42
© 2008 Prentice Hall Business Publishing Economics R. Glenn Hubbard, Anthony Patrick O’Brien, 2e.
Perfectly competitive market
A
market in which there are many
buyers and sellers, not one buyer
or seller can directly influence the
market price. The market
h
e
re
P
ri
ce
s
C
o
m
e
F
ro
m
:
T
h
e
I
n
te
ra
c
ti
o
n
o
f
D
em
an
d
a
n
d
S
u
p
p
ly
Demand schedule
A table showing the relationship
between the price of a product and the quantity of the
product demanded.
Quantity demanded
The amount of a good or
service that a consumer is willing and able to
purchase at a given price.
Demand curve
A curve that shows the relationship
between the price of a product and the quantity of the
product demanded.
Market demand
The demand by all the consumers
C
h
ap
te
r
3:
W
h
e
re
P
ri
ce
s
C
o
m
e
F
ro
m
:
T
h
e
I
n
te
ra
c
ti
o
n
o
f
D
em
an
d
a
n
d
S
4 of 42
© 2008 Prentice Hall Business Publishing Economics R. Glenn Hubbard, Anthony Patrick O’Brien, 2e.
The Demand Side of the Market
FIGURE 3-1
A Demand Schedule and Demand Curve
h
e
re
P
ri
ce
s
C
o
m
e
F
ro
m
:
T
h
e
I
n
te
ra
c
ti
o
n
o
f
D
em
an
d
a
n
d
S
u
p
p
ly
The Demand Side of the Market
Law of demand
The rule that, holding everything
else constant, when the price of a product falls,
the quantity demanded of the product will
increase, and when the price of a product rises,
the quantity demanded of the product will
decrease.
Market Demand-
sum of the market’s consumer
demand
Learning
Objective
3.1
C
h
ap
te
r
3:
W
h
e
re
P
ri
ce
s
C
o
m
e
F
ro
m
:
T
h
e
I
n
te
ra
c
ti
o
n
o
f
D
em
an
d
a
n
6 of 42
© 2008 Prentice Hall Business Publishing Economics R. Glenn Hubbard, Anthony Patrick O’Brien, 2e.
http://www.stlouisfed.org/education_resources/economic-lowd
own-video-companion-series/episode-2-demand/
h
e
re
P
ri
ce
s
C
o
m
e
F
ro
m
:
T
h
e
I
n
te
ra
c
ti
o
n
o
f
D
em
an
d
a
n
d
S
u
p
p
ly
The Demand Side of the Market
Ceteris paribus
(“all else equal”)
The
requirement that when analyzing the
relationship between two variables—such
as price and quantity demanded—other
variables must be held constant.
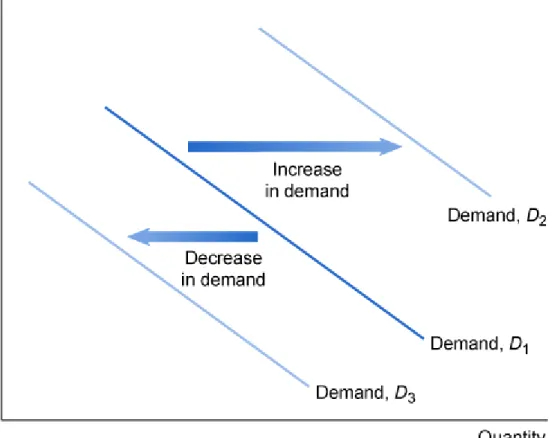
A shift of a demand curve is
an increase or
decrease in demand
. A movement along a
demand curve is
an increase or decrease
in the quantity demanded
.
Learning
Objective
3.1
C
h
ap
te
r
3:
W
h
e
re
P
ri
ce
s
C
o
m
e
F
ro
m
:
T
h
e
I
n
te
ra
c
ti
o
n
o
f
D
em
an
d
a
n
d
S
8 of 42
© 2008 Prentice Hall Business Publishing Economics R. Glenn Hubbard, Anthony Patrick O’Brien, 2e.
The Demand Side of the Market
FIGURE 3-3
A Change in Demand versus a Change in the Quantity Demanded
h
e
re
P
ri
ce
s
C
o
m
e
F
ro
m
:
T
h
e
I
n
te
ra
c
ti
o
n
o
f
D
em
an
d
a
n
d
S
u
p
p
ly
The Demand Side of the Market
Learning
Objective
3.1
FIGURE 3-2
Shifting the Demand Curve
C
h
ap
te
r
3:
W
h
e
re
P
ri
ce
s
C
o
m
e
F
ro
m
:
T
h
e
I
n
te
ra
c
ti
o
n
o
f
D
em
an
d
a
n
d
S
10 of 42
© 2008 Prentice Hall Business Publishing Economics R. Glenn Hubbard, Anthony Patrick O’Brien, 2e.
The Demand Side of the Market
Normal good
A good for which the demand increases
as income rises and decreases as income falls.
Income ↓ Demand ↓ (direct relationship)
Inferior good
(Generic Items) A good for which the
demand increases as income falls and decreases as
income rises.
Income ↓ Demand ↑ (inverse relationship)
Variables That Shift The Demand Curve
h
e
re
P
ri
ce
s
C
o
m
e
F
ro
m
:
T
h
e
I
n
te
ra
c
ti
o
n
o
f
D
em
an
d
a
n
d
S
u
p
p
ly
The Demand Side of the Market
Learning
Objective
3.1
Substitutes
Goods and services that can be used
for the same purpose.
Price of A ↑ , Demand for B ↑ (Direct Relationship)
Complements
Goods and services that are used
together.
Price of A ↑ , Demand for B ↓ (Inverse Relationship)
Variables That Shift Market Demand
•
Price of related goods (SUBSTITUTION EFFECT)
Consumers can be influenced by an
C
h
ap
te
r
3:
W
h
e
re
P
ri
ce
s
C
o
m
e
F
ro
m
:
T
h
e
I
n
te
ra
c
ti
o
n
o
f
D
em
an
d
a
n
d
S
12 of 42
© 2008 Prentice Hall Business Publishing Economics R. Glenn Hubbard, Anthony Patrick O’Brien, 2e.
The Demand Side of the Market
Demographics
The characteristics
of a population with respect to age,
race, and gender.
Population-
Number of Buyers
Direct Relationship w/ Demand ↑↑
•
Population and demographics
•
Expected Future Prices
Consumers choose not only which
products to buy but also when to buy
them.
h
e
re
P
ri
ce
s
C
o
m
e
F
ro
m
:
T
h
e
I
n
te
ra
c
ti
o
n
o
f
D
em
an
d
a
n
d
S
u
p
p
ly
The Demand Side of the Market
Learning
Objective
3.1
Variables That Shift Market Demand
TABLE 3-1
C
h
ap
te
r
3:
W
h
e
re
P
ri
ce
s
C
o
m
e
F
ro
m
:
T
h
e
I
n
te
ra
c
ti
o
n
o
f
D
em
an
d
a
n
d
S
14 of 42
© 2008 Prentice Hall Business Publishing Economics R. Glenn Hubbard, Anthony Patrick O’Brien, 2e.
The Demand Side of the Market
Variables That Shift Market Demand
TABLE 3-1
h
e
re
P
ri
ce
s
C
o
m
e
F
ro
m
:
T
h
e
I
n
te
ra
c
ti
o
n
o
f
D
em
an
d
a
n
d
S
u
p
p
ly
Supply schedule
A table that shows the relationship
between the price of a product and the quantity of the
product supplied.
Supply curve
A curve that shows the relationship
between the price of a product and the quantity of the
product supplied.
The Supply Side of the Market
Learning
Objective
3.2
Supply Schedules and Supply Curves
Quantity supplied
The amount of a good or service
that a firm is willing and able to supply at a given
C
h
ap
te
r
3:
W
h
e
re
P
ri
ce
s
C
o
m
e
F
ro
m
:
T
h
e
I
n
te
ra
c
ti
o
n
o
f
D
em
an
d
a
n
d
S
16 of 42
© 2008 Prentice Hall Business Publishing Economics R. Glenn Hubbard, Anthony Patrick O’Brien, 2e.
The Supply Side of the Market
Supply Schedules and Supply Curves
FIGURE 3-4
h
e
re
P
ri
ce
s
C
o
m
e
F
ro
m
:
T
h
e
I
n
te
ra
c
ti
o
n
o
f
D
em
an
d
a
n
d
S
u
p
p
ly
http://www.stlouisfed.org/education_resources/economic-lowd
own-video-companion-series/episode-1-supply/
C
h
ap
te
r
3:
W
h
e
re
P
ri
ce
s
C
o
m
e
F
ro
m
:
T
h
e
I
n
te
ra
c
ti
o
n
o
f
D
em
an
d
a
n
d
S
18 of 42
© 2008 Prentice Hall Business Publishing Economics R. Glenn Hubbard, Anthony Patrick O’Brien, 2e.
The Supply Side of the Market
Law of supply
The rule that, holding
everything else constant, increases in
price cause increases in the quantity
supplied, and decreases in price cause
decreases in the quantity supplied.
h
e
re
P
ri
ce
s
C
o
m
e
F
ro
m
:
T
h
e
I
n
te
ra
c
ti
o
n
o
f
D
em
an
d
a
n
d
S
u
p
p
ly
The Supply Side of the Market
Learning
Objective
3.2
Variables That Shift Supply
•
Prices of inputs (Input Costs ↑ Supply ↓)
•
Technological change (Technology↑ Supply ↑) Direct
•
Number of firms in the market (Direct)
•
Expected future prices
•
Taxes (Inverse)
•
Government Policies
•
Subsidies
C
h
ap
te
r
3:
W
h
e
re
P
ri
ce
s
C
o
m
e
F
ro
m
:
T
h
e
I
n
te
ra
c
ti
o
n
o
f
D
em
an
d
a
n
d
S
20 of 42
© 2008 Prentice Hall Business Publishing Economics R. Glenn Hubbard, Anthony Patrick O’Brien, 2e.
The Supply Side of the Market
FIGURE 3-5
h
e
re
P
ri
ce
s
C
o
m
e
F
ro
m
:
T
h
e
I
n
te
ra
c
ti
o
n
o
f
D
em
an
d
a
n
d
S
u
p
p
ly
Imagine you are an ice cream producer. How
would you react to the following scenarios?
• The price of milk goes up 30 cents a gallon.
• The government raises the minimum wage to
$8 an hour.
• A hurricane wipes out the sugar crop in
Hawaii.
• New regulations from the government
C
h
ap
te
r
3:
W
h
e
re
P
ri
ce
s
C
o
m
e
F
ro
m
:
T
h
e
I
n
te
ra
c
ti
o
n
o
f
D
em
an
d
a
n
d
S
22 of 42
© 2008 Prentice Hall Business Publishing Economics R. Glenn Hubbard, Anthony Patrick O’Brien, 2e.
The Supply Side of the Market
FIGURE 3-6
A Change in Supply versus a Change in the Quantity Supplied
h
e
re
P
ri
ce
s
C
o
m
e
F
ro
m
:
T
h
e
I
n
te
ra
c
ti
o
n
o
f
D
em
an
d
a
n
d
S
u
p
p
ly
Market Equilibrium: Putting Demand and Supply
Together
FIGURE 3-7
Market Equilibrium
C
h
ap
te
r
3:
W
h
e
re
P
ri
ce
s
C
o
m
e
F
ro
m
:
T
h
e
I
n
te
ra
c
ti
o
n
o
f
D
em
an
d
a
n
d
S
24 of 42
© 2008 Prentice Hall Business Publishing Economics R. Glenn Hubbard, Anthony Patrick O’Brien, 2e.
Market equilibrium
A situation in which
quantity demanded equals quantity
supplied. Q
supplied
= Q
demanded
The interaction of supply and demand.
Competitive market equilibrium
A
market equilibrium with many buyers and
many sellers.
h
e
re
P
ri
ce
s
C
o
m
e
F
ro
m
:
T
h
e
I
n
te
ra
c
ti
o
n
o
f
D
em
an
d
a
n
d
S
u
p
p
ly
Market Equilibrium: Putting Demand and Supply
Together
Learning
Objective
3.3
Surplus
= Q
supplied
> Q
demanded
Shortage
= Q
d
> Q
s
C
h
ap
te
r
3:
W
h
e
re
P
ri
ce
s
C
o
m
e
F
ro
m
:
T
h
e
I
n
te
ra
c
ti
o
n
o
f
D
em
an
d
a
n
d
S
26 of 42
© 2008 Prentice Hall Business Publishing Economics R. Glenn Hubbard, Anthony Patrick O’Brien, 2e.
Together
FIGURE 3-8
The Effect of Surpluses and Shortages on the Market Price
h
e
re
P
ri
ce
s
C
o
m
e
F
ro
m
:
T
h
e
I
n
te
ra
c
ti
o
n
o
f
D
em
an
d
a
n
d
S
u
p
p
ly
The Effect of Demand and Supply Shifts on Equilibrium
FIGURE 3-9
The Effect of an Increase in Supply on Equilibrium
The Effect of Shifts in Supply on Equilibrium
C
h
ap
te
r
3:
W
h
e
re
P
ri
ce
s
C
o
m
e
F
ro
m
:
T
h
e
I
n
te
ra
c
ti
o
n
o
f
D
em
an
d
a
n
d
S
28 of 42
© 2008 Prentice Hall Business Publishing Economics R. Glenn Hubbard, Anthony Patrick O’Brien, 2e.
The Effect of Demand and Supply Shifts on Equilibrium
FIGURE 3-10
h
e
re
P
ri
ce
s
C
o
m
e
F
ro
m
:
T
h
e
I
n
te
ra
c
ti
o
n
o
f
D
em
an
d
a
n
d
S
u
p
p
ly
The Effect of Demand and Supply Shifts on Equilibrium
Shifts in a Curve versus Movements along a Curve
Learning
Objective
3.4
C
h
ap
te
r
3:
W
h
e
re
P
ri
ce
s
C
o
m
e
F
ro
m
:
T
h
e
I
n
te
ra
c
ti
o
n
o
f
D
em
an
d
a
n
30 of 42
© 2008 Prentice Hall Business Publishing Economics R. Glenn Hubbard, Anthony Patrick O’Brien, 2e.
Price ceiling
A legally determined maximum price
that sellers may charge.
Price floor
h
e
re
P
ri
ce
s
C
o
m
e
F
ro
m
:
T
h
e
I
n
te
ra
c
ti
o
n
o
f
D
em
an
d
a
n
d
S
u
p
p
ly
Why the Supply Curve and Demand Curves are not
really linear.
Law of Diminishing Returns- rule stating as more units of
factors of production are added to other factors of
production, after some point the total output continues to
increase but at a diminishing rate (SUPPLY)
Law of Diminishing Marginal Utility- rule stating the additional
satisfaction a consumer gets from purchasing one more
unit of a product will lessen with each additional unit
C
h
ap
te
r
3:
W
h
e
re
P
ri
ce
s
C
o
m
e
F
ro
m
:
T
h
e
I
n
te
ra
c
ti
o
n
o
f
D
em
an
d
a
n
d
S
32 of 42
© 2008 Prentice Hall Business Publishing Economics R. Glenn Hubbard, Anthony Patrick O’Brien, 2e.
Consumer surplus
The difference between the highest price a
consumer is willing to pay and the price the
consumer actually pays.
Marginal benefit
The additional benefit to a consumer from
consuming one more unit of a good or service.
Consumer Surplus and Producer Surplus
h
e
re
P
ri
ce
s
C
o
m
e
F
ro
m
:
T
h
e
I
n
te
ra
c
ti
o
n
o
f
D
em
an
d
a
n
d
S
u
p
p
ly
Learning
Objective
4.1
Consumer Surplus and Producer Surplus
Consumer Surplus
FIGURE 4-1
C
h
ap
te
r
3:
W
h
e
re
P
ri
ce
s
C
o
m
e
F
ro
m
:
T
h
e
I
n
te
ra
c
ti
o
n
o
f
D
em
an
d
a
n
d
S
34 of 42
© 2008 Prentice Hall Business Publishing Economics R. Glenn Hubbard, Anthony Patrick O’Brien, 2e.
Consumer Surplus and Producer Surplus
Consumer Surplus
FIGURE 4-2
h
e
re
P
ri
ce
s
C
o
m
e
F
ro
m
:
T
h
e
I
n
te
ra
c
ti
o
n
o
f
D
em
an
d
a
n
d
S
u
p
p
ly
Consumer Surplus and Producer Surplus
FIGURE 4-3
Total Consumer Surplus in the Market for Chai Tea
Learning
Objective
4.1
C
h
ap
te
r
3:
W
h
e
re
P
ri
ce
s
C
o
m
e
F
ro
m
:
T
h
e
I
n
te
ra
c
ti
o
n
o
f
D
em
an
d
a
n
d
S
36 of 42
© 2008 Prentice Hall Business Publishing Economics R. Glenn Hubbard, Anthony Patrick O’Brien, 2e.
Consumer Surplus and Producer Surplus
Producer surplus
The difference between
the lowest price a firm would have been
willing to accept and the price it actually
receives.
h
e
re
P
ri
ce
s
C
o
m
e
F
ro
m
:
T
h
e
I
n
te
ra
c
ti
o
n
o
f
D
em
an
d
a
n
d
S
u
p
p
ly
Producer Surplus
FIGURE 4-4
Calculating Producer Surplus
Learning
Objective
4.1
C
h
ap
te
r
3:
W
h
e
re
P
ri
ce
s
C
o
m
e
F
ro
m
:
T
h
e
I
n
te
ra
c
ti
o
n
o
f
D
em
an
d
a
n
d
S
38 of 42
© 2008 Prentice Hall Business Publishing Economics R. Glenn Hubbard, Anthony Patrick O’Brien, 2e.
The Efficiency of Competitive Markets
FIGURE 4-6
Economic Surplus Equals the Sum of Consumer Surplus and Producer Surplus
Economic Surplus
Economic surplus
The sum of
h
e
re
P
ri
ce
s
C
o
m
e
F
ro
m
:
T
h
e
I
n
te
ra
c
ti
o
n
o
f
D
em
an
d
a
n
d
S
u
p
p
ly
The Efficiency of Competitive Markets
FIGURE 4-7
When a Market Is Not in Equilibrium There is a Deadweight Loss
Deadweight Loss
Deadweight loss
The reduction in economic surplus
C
h
ap
te
r
3:
W
h
e
re
P
ri
ce
s
C
o
m
e
F
ro
m
:
T
h
e
I
n
te
ra
c
ti
o
n
o
f
D
em
an
d
a
n
d
S
40 of 42
© 2008 Prentice Hall Business Publishing Economics R. Glenn Hubbard, Anthony Patrick O’Brien, 2e.
The Efficiency of Competitive Markets
Economic efficiency
A market outcome in which the marginal
benefit to consumers of the last unit
produced is equal to its marginal cost of
production, and in which the sum of
consumer surplus and producer surplus is at
a maximum.
h
e
re
P
ri
ce
s
C
o
m
e
F
ro
m
:
T
h
e
I
n
te
ra
c
ti
o
n
o
f
D
em
an
d
a
n
d
S
u
p
p
ly
Government Intervention in the Market:
Price Floors And Price Ceilings
FIGURE 4-8
The Economic Effect of a Price Floor in the Wheat Market
Price Floors: Government Policy in Agricultural Markets
C
h
ap
te
r
3:
W
h
e
re
P
ri
ce
s
C
o
m
e
F
ro
m
:
T
h
e
I
n
te
ra
c
ti
o
n
o
f
D
em
an
d
a
n
d
S
42 of 42
© 2008 Prentice Hall Business Publishing Economics R. Glenn Hubbard, Anthony Patrick O’Brien, 2e.
Price Floors And Price Ceilings
Black Markets
h
e
re
P
ri
ce
s
C
o
m
e
F
ro
m
:
T
h
e
I
n
te
ra
c
ti
o
n
o
f
D
em
an
d
a
n
d
S
u
p
p
ly
The Economic Impact of Taxes
Tax Incidence: Who Actually Pays a Tax?
Tax incidence
The actual
division of the burden of a tax
between buyers and sellers in a
market.
C
h
ap
te
r
3:
W
h
e
re
P
ri
ce
s
C
o
m
e
F
ro
m
:
T
h
e
I
n
te
ra
c
ti
o
n
o
f
D
em
an
d
a
n
d
S
44 of 42
© 2008 Prentice Hall Business Publishing Economics R. Glenn Hubbard, Anthony Patrick O’Brien, 2e.
The Economic Impact of Taxes
The Effect of Taxes on Economic Efficiency
FIGURE 4-10
h
e
re
P
ri
ce
s
C
o
m
e
F
ro
m
:
T
h
e
I
n
te
ra
c
ti
o
n
o
f
D
em
an
d
a
n
d
S
u
p
p
ly
Elasticity: The Responsiveness of
Demand and Supply
Elasticity
A measure of how much
C
h
ap
te
r
3:
W
h
e
re
P
ri
ce
s
C
o
m
e
F
ro
m
:
T
h
e
I
n
te
ra
c
ti
o
n
o
f
D
em
an
d
a
n
d
S
46 of 42
© 2008 Prentice Hall Business Publishing Economics R. Glenn Hubbard, Anthony Patrick O’Brien, 2e.
Price elasticity of demand The responsiveness of the quantity
demanded to a change in price
The Price Elasticity of Demand and Its Measurement
h
e
re
P
ri
ce
s
C
o
m
e
F
ro
m
:
T
h
e
I
n
te
ra
c
ti
o
n
o
f
D
em
an
d
a
n
d
S
u
p
p
ly
Elastic demand - Demand is elastic when the percentage
change in quantity demanded is greater than the
percentage change in price, so the price elasticity is
greater than 1 in absolute value. %∆Q > %∆P
The Price Elasticity of Demand and Its Measurement
Learning Objective 6.1
Demand is inelastic when
% ∆ P > % ∆ Q
Elastic Demand and Inelastic Demand
Unit-elastic demand- Demand is unit-elastic when
the % ∆ P = % ∆ Q
C
h
ap
te
r
3:
W
h
e
re
P
ri
ce
s
C
o
m
e
F
ro
m
:
T
h
e
I
n
te
ra
c
ti
o
n
o
f
D
em
an
d
a
n
d
S
48 of 42
© 2008 Prentice Hall Business Publishing Economics R. Glenn Hubbard, Anthony Patrick O’Brien, 2e.
The Price Elasticity of Demand and Its Measurement
An Example of Computing Price Elasticities
FIGURE 6-1
Elastic and
Inelastic
h
e
re
P
ri
ce
s
C
o
m
e
F
ro
m
:
T
h
e
I
n
te
ra
c
ti
o
n
o
f
D
em
an
d
a
n
d
S
u
p
p
ly
The Price Elasticity of Demand and Its Measurement
Learning Objective 6.1
The Midpoint Formula
C
h
ap
te
r
3:
W
h
e
re
P
ri
ce
s
C
o
m
e
F
ro
m
:
T
h
e
I
n
te
ra
c
ti
o
n
o
f
D
em
an
d
a
n
d
S
50 of 42
© 2008 Prentice Hall Business Publishing Economics R. Glenn Hubbard, Anthony Patrick O’Brien, 2e.
The Price Elasticity of Demand and Its Measurement
Polar Cases of Perfectly Elastic and Perfectly Inelastic Demand
Table 6-1
h
e
re
P
ri
ce
s
C
o
m
e
F
ro
m
:
T
h
e
I
n
te
ra
c
ti
o
n
o
f
D
em
an
d
a
n
d
S
u
p
p
ly
The Price Elasticity of Demand and Its Measurement
Learning Objective 6.1
When Demand Curves Intersect, the Flatter
Curve Is More Elastic
Polar Cases of Perfectly Elastic and Perfectly Inelastic Demand
Perfectly inelastic demand
-demand is
completely unresponsive to a change in price.
C
h
ap
te
r
3:
W
h
e
re
P
ri
ce
s
C
o
m
e
F
ro
m
:
T
h
e
I
n
te
ra
c
ti
o
n
o
f
D
em
an
d
a
n
d
S
52 of 42
© 2008 Prentice Hall Business Publishing Economics R. Glenn Hubbard, Anthony Patrick O’Brien, 2e.
The Price Elasticity of Demand and Its Measurement
Table 6-1
Summary of the Price
h
e
re
P
ri
ce
s
C
o
m
e
F
ro
m
:
T
h
e
I
n
te
ra
c
ti
o
n
o
f
D
em
an
d
a
n
d
S
u
p
p
ly