Mahajan P. T, Golahit S. B IJSRE Volume 5 Issue 1 January 2017 Page 6142
Volume||5||Issue||01||January-2017||Pages-6142-6155||ISSN(e):2321-7545 Website: http://ijsae.in Index Copernicus Value- 56.65 DOI: http://dx.doi.org/10.18535/ijsre/v5i01.02
Promoting an Institute: An essential obligation for Technical Education Evolution
AuthorsMahajan P. T1, Golahit S. B2
1
Research Scholar Registrar, R. C. Patel Institute of Technology, Shirpur, Maharashtra, India
2
Research Guide Head of Department, Department of Economics, KVPS‘s S.P.D.M. College, Shirpur, Maharashtra, India
E-mail: [email protected], [email protected]
ABSTRACT
Purpose:Technical education in India contributes a major share to the overall education system and plays a vital role in the social and economic development of the nation. Despite of rapid growth of technical education in last decade in terms of the no. of institutes and intake capacity in India, institutes failed to attract enrollments. Last three years saw, increasing gap in between the actual no. of enrollments and intake capacity; 46% of seats were vacant in Technical Education in India in 2015. The purpose of this paper is to highlight institute’s role in promoting enrollments in Technical education.
Design methodology: A qualitative research by a survey (through a structured questionnaire) of students who are presently enrolled (Current-students) and those who have completed their study (Alumni) belonging to the institutes offering Technical Education situated in Khandesh region of India and affiliated to the North Maharashtra University, Jalgaon.
Findings: The study found that diversified characteristics of enrollments are related with the promotion mix of TE institute in selection of technical educational institute. This study investigates the usefulness of school visits, institution publications, websites, campus visits, word-of-mouth (friends, alumni, school teachers), advertisements (radio, television, magazines) and events on campus, as a tool of promotion. Social Networking and Institute’s Website are the new forms of promotion mix in selection TE institute in rural part of India.
Research limitations: The survey is delimited to the enrollments of technical education belonging to North Maharashtra University, Jalgaon and located in Khandesh region of India.
Practical implications
60-70% of population belongs to rural part of India. Different promotional strategies of promotion mix can be used based on geographic and demographic segmentation. This will enhance, making awareness, fondness regarding Technical Education in the rural part and will act as lubricant in decision making of selecting their technical educational institute.
Keywords: Enrollments, Segmentation, Promotion Mix, Technical Education.
INTRODUCTION
Mahajan P. T, Golahit S. B IJSRE Volume 5 Issue 1 January 2017 Page 6143 institution of the country. Technical education contributes substantially to the socio-economic development of the country [2]. The economic growth of a country largely depends on technological improvements and on its scientific and technical manpower. Technical education, therefore, has a crucial role in speeding up the country's industrial development. It provides one of the most potent means for development of skilled manpower as required by various sectors in the country's economy. India possesses Asia's oldest, largest and most diverse infrastructure for scientific and technical training that has made important contributions to the country's scientific and industrial development [3].
Literature showed, historically, institutes & universities have been extremely slow in adapting to societal change [4]. Kotler's (1972), has an argument that marketing is a generic concept applicable to all organizations (not just profit seeking business corporations), various sectors of our society have "discovered marketing" [5]. While laggards to the adoption of a marketing orientation, many universities have now adopted the conscious practice of strategic marketing [6]. Because marketing and strategy are not at the top of the administration‘s things-to-do list, many institutes find themselves in reactive positions to repair damages left from their inability to adjust. Whether it is higher education or business, the strategic framework should be underpinned by the same characteristics: reflective, innovative, brand supportive dominant logic and exceptional capabilities [7]. According to Darrell Norman Bureell, Brain C, Grizzell (2008), the most successful institutes will be those that can do strategic marketing planning carve out niches and fulfill needs of students by adding valuable services that will drive students to the institution [8]. Part of this planning will include investment in advertising and marketing initiatives aimed at developing institutional brand names and student prospect leads. Growth in this climate will be hinged on organizational changes that support environment that is market driven and sales oriented. Because today‘s students have so many choices, enrollment personnel must become more skilled at selling prospective students on the benefits of their institution over another [9]. Johnson and Jones (2006), in ‗Declining Interest in Engineering Studies at a Time of Increased Business Need‘, have stated that the area of concern in the engineering education pipeline is the lack of diversity in the student population [10]. They suggested to expand pre-college efforts at attracting women into the engineering education pipeline and enhance the public understanding of engineering and its contributions to society. P.B. Sathivel (2003) see demographic variable like type of institutions, gender of respondents, size of institutions, age of institutions and commitment of top management and its leadership as major factor in attracting the prospective students [11]. He also emphasis on some value based education services like customer focus, course delivery, communication, campus facilities learning environment as major factors. Kelley and Mahady (2003:2) believe that promotion is an element sometimes overlooked by non-profit organizations [12]. The increasingly competitive higher education market, which began decades ago and continues today, has more recently pushed colleges and universities to evaluate their identity and their image, establish what their strengths and weakness are, and develop a clear mission and vision that reflects organizational identity and aspiration as colleges and universities develop strategies for positioning or repositioning themselves [13].
PROMOTION MIX AND HOLISTIC MARKETING
Mahajan P. T, Golahit S. B IJSRE Volume 5 Issue 1 January 2017 Page 6144 professional brochures and promotional material as vehicles for communication Higher education institutions are the senders, while the receivers of the message are the potential students, existing students, parents, employers or alumni. The most popular communication/promotion objectives are general image enhancement and awareness of the institutions [15]. Kotler & Fox (1995) view that Higher education institutions need to select a medium that will attract attention, arouse interest and present the message clearly. Higher education institutions need knowledge about the language of the prospective students, knowledge of forms of communication and general background information about the prospective students in order to encode successfully. Laurer (2006) suggests that institutions must coordinate all the promotional elements so that they meet the needs of students and parents who will pay for their products and services [16].
As Technical Education (TE) in India is turning more competitive, it has become necessary for TE institutions to engage in strategic marketing. More than promotional activities, strategic marketing involves to draw students toward the institution; it should also include market segmentation and positioning [17]. The reason why segmentation is important and timely is that universities and institutes are currently struggling with how to best serve their learners in the face of declining financial resources, increased calls for accountability by Government, increasing competition among institutions and more discerning students, particularly those referred to as the ‗millennials‘ [18].
The holistic marketing concept is based on the development, design, and implementation of marketing programs, processes, and activities that recognizes their breadth and inter-dependencies. Holistic marketing recognizes that "everything matters" with marketing— and that a broad, integrated perspective is often necessary. Four components of holistic marketing are relationship marketing, integrated marketing, internal marketing, and social responsibility marketing [19].
Internal marketing: Internal marketing refers to the process of planning and executing marketing activities aimed at the creation and improvement of exchange processes within the organization. The goal of internal marketing is to accomplish the organization‘s objectives and communication processes in a more efficient and effective way [20]. Internal marketing ensures that the promises made by the marketing function of TE institutions to external markets are delivered. For internal marketing to be effective and function properly, various process is needed: exchanges between the institutions and their staff & current-students, exchanges between top management and the departments, exchanges between different departments, and exchanges between the department and current-students and alumni. In internal marketing communication flows, vertically as well as in horizontal directions. In addition, Ahmed, Rafiq, & Saad (2003) propose the concept of IM mix or set of controllable instrument inside the organizational that can be used effectively to influence employees so that they are motivated and acted in customer-oriented fashion [21]. Lamb et al. (2004:323) express that opinion that relationship selling emphasizes a win-win situation and the accomplishment of mutual objectives that benefit both the buyer and seller in the long-term.
Mahajan P. T, Golahit S. B IJSRE Volume 5 Issue 1 January 2017 Page 6145
External marketing: Bansal & Sharma, (2001) attempt to develop and sustaining an organizational culture that emphasizes internal customer well-being as a means to attract and retain external customer patronage. Once internal marketing processes are completed, institute starts to use external marketing communication, which extends from the organization to the customer, and this includes promotional tools such as advertising, sales promotions, public relations and direct marketing [24]. These tools are discussed briefly as below-
Personal Selling: Personal selling is a paid communication, which normally calls for a personal and often one-to-one contact between the organization and customer [25]. It is the most effective way of oral or face-to-face communication. Here staff or faculty of institute acts on the behalf of the institute and interact with the family of the students or teachers of schools. Staff can interact with families, students and school teachers through career counselling seminars arranged in schools. Even education fairs can take a form of personal selling where the representative of the institute interact with the visitors. However, this form is economically useful when the institute think that its customers are in the near and surrounding region. Customers on large scale cannot be targeted. But this form creates a positive influence on the customers.
Sales Promotion: Sales promotions can be described as all the activities, methods and incentives
designed to speed up the response from customers [26]. Institutes sales promotional activities includes fee concessions, loan facilities, medical and insurance, fee installments, scholarships etc. This form is frequently used to attract economically backward students and to attract talents. Communication of this form can be made through advertisement or distributing leaflets or brochures.
Public Relations: Strydom et al. (2000:350) define public relations as management through communication or perception, and the strategic relationship between an organization and its internal and external public. Public relations can be defined as a deliberate, planned and sustained efforts to establish or to maintain mutual and understanding between the institute and the customers to develop core values of the institute. This may be in between; staff-alumni, institute-alumni, staff-schools & teachers, institute-schools and teachers or institute-community. It creates, develops and maintains positive image of the institute which is very effective tool of promotion in era of competition. Institute do arrange social programs like health & medical campus, cleanliness drive, tree plantation, computer literacy programs to develop public relation with the community. Institute also take support of Facebook, twitter, LinkedIn and social blogs to maintain their relations with the customers of technical education. It is the responsibility of the public relation officer to maintain good relationships with the education departments of government, principals of schools, school teachers, society, press and alumni, because they are role-players that can influence the institution‘s selection process. According to Jones (2002:58), open days, social events and winter or summer schools are all used by higher education institutions with great success to improve and maintain the relationship [27].
Advertising: It is paid and impersonal form of promotion to attract mass customers. Advertising can also supply information on price, guarantees and performance evidence [28]. Advertising can be defined as impersonal, paid, one-way mass communication about the service product of an organization used to reach the target market and fulfil the organization‘s overall goals (Lamb et al., 2004:467). All customers can be targeted through radio, TV or print media advertisement through mass communication. It is created to develop attitudes, create awareness. It also includes outdoor advertising. Institutes use banners and hoardings, TV advertisement on local channels and cinema hall, audio advertisement on radio or bus stand to promote themselves. Not many TE institutes advertise on television, because it is expensive and reaches to a general audience.
Mahajan P. T, Golahit S. B IJSRE Volume 5 Issue 1 January 2017 Page 6146 promote their brands, logos and products. Social responsibility is a factor of why companies get involved in sponsorship. Sponsorship of schools can help boost the reputation of a company in its given community. This will give a caring and socially responsible image to the consumers [30]. It creates social impact on community. Institutes sponsors sports event, cultural nights, technical symposium or competitions; even they sponsor social events like health & medical camps, education fairs, cleanliness drive etc. Attributes of such events are then associated with sponsored institutes. TE institutes use sponsoring programs to improve goodwill, enhancing image, increase awareness, staff and student‘s recruitment and to create competitive advantage.
Publicity: It is non-paid form of promotion which may be due to the customers ‗word of mouth‘ with the other customers or with the community. Institute‘s best publicity is through the news published in the newspapers. It creates a huge impact on customers as well as on community. TE institutes can make use of public relations and publicity, not only to maintain a positive image but also to educate the public about the institutions‘ goals, objectives, introduce new programs. Chester (2005) believes the new tool that higher education institutions must make use of is writing press releases or articles that will be highly visible on search engines like Google [31]. Publicity is directly related to the attitude of institute towards its service and the satisfaction of the customers towards the service delivered. Institute that delivers quality service and have satisfied customers are more likely to get positive publicity. Institutes have now started to follow social networking (Facebook, twitter, LinkedIn) for their publicity. More likes, more followers; more favorable the institute is.
Direct Marketing through E-mail, SMS and Telephonic Communication: Direct marketing is defined as the use of mail, telephone, fax, e-mail and other non-personal tools to communicate directly with specific consumers to obtain a direct response [32]. This form of promotion used when the institute has known customers with the database of customer. Institute design highly focused communication with highlighting features. Institute can even negotiate on the financial aspects.
Social and Digital marketing: Webpages and brochures must be user-friendly and reflect the image of the institution. Students are making use of search engines as a tool for finding higher education institutions [33]. The terms ―social‖ and ―digital‖ refer to the use of both social media and digital marketing more generally, and include the role of effective and intuitive websites. Institutes are making greater use of social media and digital platforms like Twitter, Facebook, YouTube, and podcasts to market their programs, while website design and interface is proving a crucial component in how institutes present themselves to prospective students. The latest poll indicated that 100 percent of respondent institutions are now using some form of social media – but there is no reliable data on how effective the use of such tools are in terms of enrollment or elevating institutional value [34].
Relationship marketing
Mahajan P. T, Golahit S. B IJSRE Volume 5 Issue 1 January 2017 Page 6147 Conceptual framework of Promotion Mix in Technical Education
Relationship M arketing Integrated
M arketing
Internal M arketing Social M arketing
Vertical & Horizontal Communication
Personal Selling
School Visits Exhibitions Counseling
Seminars
Advertising
Sales Promotion
Public Relations
Sponsorship Programs
Community Pre- Student Parents & Family Friends
Post- Students Schools & School Teachers M anagement People Staff Current- Students
Interactions & Meets
Promotion M ix
Fig 1: Promotion Mix in technical Education, Self-Creation through Literature Review
TECHNICAL EDUCATION SCENARIO IN INDIA
The Tenth plan period saw a big increase in the number of technical and management institutions, mainly due to private initiatives. During the Tenth Plan, the number of AICTE approved Degree Engineering/ Technology institutions rose from 1057 to 1522 and the annual intake from 2.96 lakh to 5.83 lakh. By the end of Tenth Plan, the aggregate number of technical institutions were 4512 and the intake capacity was 7.83 lakh. However, The AICTE council had stopped giving approval to new colleges in 2014. The report of 2013 said, some institutes or colleges had not been able to fill up their seats in different engineering and management courses during the last three to four academic sessions. HRD Ministry sources said on May 22, 2013 that more than 200 technical institutions submitted applications seeking closure of their courses due to various reasons, including poor admissions. Of these, 143 had been allowed to close their courses.
No Indian University could make a place in first 100 position in ‗World Reputation Rankings 2016‘. Indian Institute of Science, South India, ranked in between 300-400, as per the report 2016 of Academic Ranking of World Universities [36].
Programs 2016-17 2015-16 2014-15 2013-14 2012-13
Engineering No. of Institutes 6469 6431 6385 6218 6098 Sanctioned intake 2996810 3094458 3182559 2951850 2699252 Actual Enrollments Not Available 1642711 1729769 1790364 1748299 Pharmacy No. of Institutes 1523 1465 1431 1421 1425
Sanctioned intake 169686 173837 177815 169665 161292 Actual Enrollments Not Available 103094 102043 98452 99096 Management No. of Institutes 3354 3475 3609 3759 3882
Sanctioned intake 412460 433170 456419 452148 444479 Actual Enrollments Not Available 245177 249381 234237 236561
MCA No. of Institutes 1233 1344 1461 1568 1739
Sanctioned intake 94159 107001 116276 122884 132148 Actual Enrollments Not Available 33750 34361 40542 54569
Architect No. of Institutes 169 171 176 165 159
Sanctioned intake 12879 13954 14430 12930 11863 Actual Enrollments Not Available 6991 7907 6962 5911
Mahajan P. T, Golahit S. B IJSRE Volume 5 Issue 1 January 2017 Page 6148 Despite of fee reimbursement schemes of Central Government of India for ecumenical backward and category students with some fee concessions offered by TE institutes at institute levels, TE institutes have failed to attract enrollments. Every year 60-70% of students are benefited through these schemes. This created an importance of holistic marketing and promotion mix to encourage the enrollments in TE.
RESEARCH METHODOLOGY
The objective of this research was to find out people‘s influence, which is a referred group for a student, on the geographic and demographic characteristics in selection of technical educational institute for a student. A qualitative research through a survey was made. It comprised of a structured questionnaire sent through e-mail to the current-students enrolled and passed-out students (alumni) belonging to the technical institutes affiliated to North Maharashtra University. Sample size (n) was calculated at 95% Confidence Level for
which Standard Normal Variate (Z) is 1.96 & at Standard Error (e) of 0.03 by n=Z2 (p)(1-p)/e2 ; where n =
Sample Size to be used for this study, N = unknown population, p = Estimated Portion of Population N. For p = 90%, ‗n‘ comes out to be 553. However, sample size of 655 was selected by quota sampling from technical institutes offering different programs in engineering, pharmacy and management & different students (Current as well Post-students) based on their location of native place, gender, father‘s qualification, occupation and income and technical educational program. The questionnaire comprised of geographic and demographic factors of students with questions measuring influencers impact on the selection of technical institute on a scale ranging from 0 to 5, where value zero, was no influence at all and value five, was most influence. The characteristics of the sample is described as below;
By Gender
Male: 447; Female: 208
By Native Place
District: 162; Taluka: 278; Village: 215
By Technical Educational Program
Engineering: 486; Pharmacy: 112; Management: 57
By Institute’s Location
District: 54; Taluka: 578; Village: 23
Hypothesis
H1: Promotion mix which influences the selection of TE institute is associated with diversified students.
DATA INTERPRETATION AND FINDINGS
Descriptive statistics of influence of promotion mix on Gender in selecting TE institute.
2 .3 8 5 2 .5 1
9 3.24
5 3 .1 8 8 2 .8 6 1 2 .7 9 3 3 .0 1 4 2 .7 2 6 3 2 .1 7 6 7 2 .2 9 9 8 2 .5 8 6 1 2 .5 5 9 3 2 .3 4 6 8 2 .3 6 6 9 2 .6 5 5 5 2 .3 5 7 9 2 .6 4 6 5 0 1 2 3 4 5 V is u al /A ir Med ia Ban n ers /H o ard in g s In st it u te W eb si te So ci al N et w o rk in g Face-t o -face co u n sel in g E d u cat io n al Fai rs Bro ch u re/ L eafl et Sp o n so rs h ip Pro g ram Pu b li ci ty
Bar-chart 1: Mean of Promotion Mix Genderwise
Mahajan P. T, Golahit S. B IJSRE Volume 5 Issue 1 January 2017 Page 6149
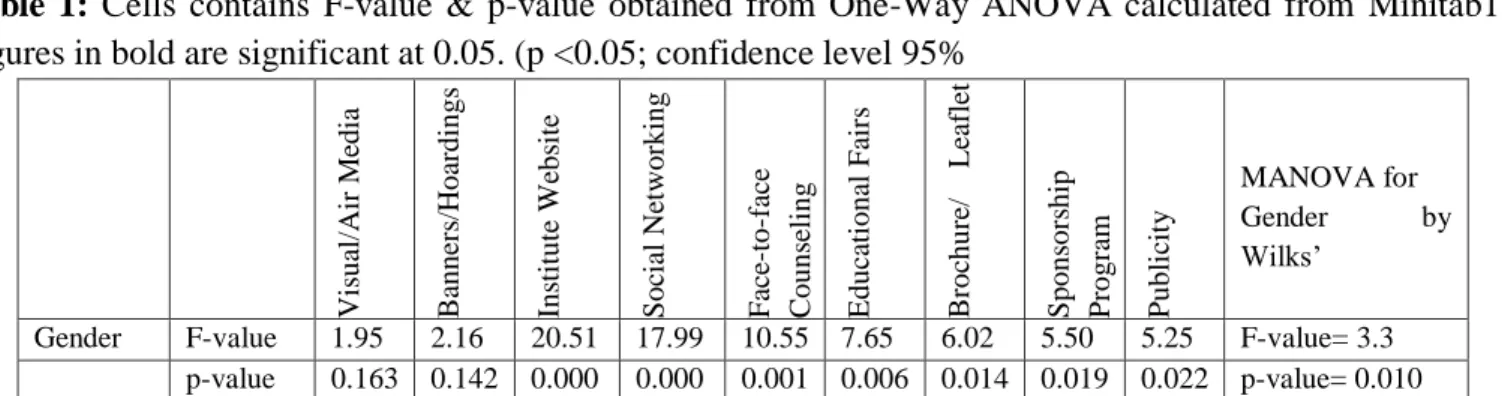
Table 1: Cells contains F-value & p-value obtained from One-Way ANOVA calculated from Minitab17: Figures in bold are significant at 0.05. (p <0.05; confidence level 95%
Vis
ua
l/
Air
M
edia
B
anne
rs
/Hoa
rdings
Ins
ti
tut
e
W
ebs
it
e
S
oc
ial
Ne
twor
king
F
ace
-to
-f
ac
e
C
ouns
eli
ng
E
duc
ati
ona
l
F
air
s
B
roc
hur
e/
L
ea
flet
S
pons
or
ship
P
rogr
am
P
ubli
cit
y
MANOVA for Gender by Wilks‘
Gender F-value 1.95 2.16 20.51 17.99 10.55 7.65 6.02 5.50 5.25 F-value= 3.3 p-value 0.163 0.142 0.000 0.000 0.001 0.006 0.014 0.019 0.022 p-value= 0.010
Bar-chart 1 represents mean of responses given by Male and Female on promotion mix which influenced them in selecting TE institute. Table 1 shows MANOVA calculated for all responses combined is significant at 0.05 i.e. p =0.010<0.05 with F-value 3.3. Hypothesis H1 is accepted for factor, gender. This means, there is difference in between male and female students in accepting ‗Promotion Mix‘ as an influencer. Male and Female responses are not same on at least for one promotion mix.
Table 1 shows F-value and p-value of gender-wise responses on Promotion Mix in the selection of TE institute, calculated with On-Way ANOVA by Minitab 17. There is a relationship between Gender and influence of promotional mix; Institute Website value= 20.51, p-value= 0.000), Social Networking (F-value= 17.99, p-(F-value= 0.000), Face-to-face counseling (F-(F-value= 10.55, p-(F-value= 0.001), Educational fairs (F-value= 7.65, p-value= 0.006), Brochure/leaflet (F-value= 6.02, p-value= 0.014), Sponsorship Programs (F-value= 5.50, p-value= 0.019) and Publicity (F-value= 5.25, p-value= 0.022); which is significant at 0.05; as p<0.05 for all these promotional mix. The strength of relationship can be measured by F-value, which is high for Institute Website, Social Networking, Face-to-face counseling and Educational fairs, which indicates that these promotional mixes are highly associated with the gender.
However, based on the same test, there is no difference in gender (male & female) on the influence of Visual/Air Media (p=0.163) and Banners/Hoardings (p=0.142), where p value is >0.05. We reject H1 for these influencers.
It can be seen from bar-chart that mean of female responses on the influence of all promotion mix is higher than male students which indicates that female students have more influence of promotional mix in selecting TE institute than male students.
Descriptive statistics of influence of promotion mix on Native Place in selecting TE Institute.
Mahajan P. T, Golahit S. B IJSRE Volume 5 Issue 1 January 2017 Page 6150
Table 2: Cells contains F-value & p-value obtained from One-Way ANOVA calculated from Minitab17: Figures in bold are significant at 0.05. (p <0.05; confidence level 95%
Vis ua l/ Air M edia B anne rs /Hoa rdings Ins ti tut e W ebs it e S oc ial Ne twor king F ac e-to -f ace C ouns eli ng E duc ati ona l F air s B roc hur e/ L ea flet S pons or ship P rogr am P ubli cit y MANOVA for Gender by Wilks‘
Native Place
F-value 1.5 5.43 2.51 2.49 4.64 9.46 4.21 8.94 2.79 F-value=2.252
p-value 0.223 0.005 0.082 0.084 0.010 0.000 0.015 0.000 0.062 p-value=0.002
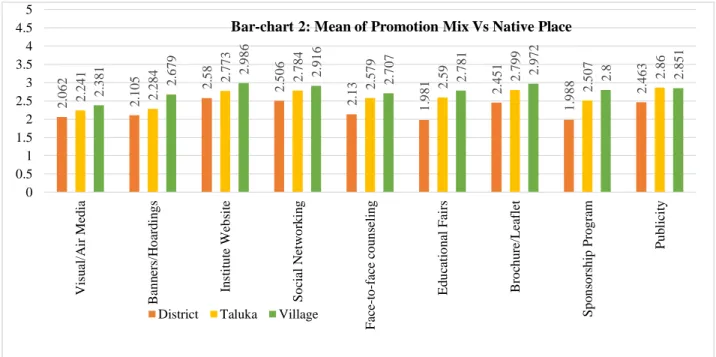
Table 2 shows F-value and p-value of responses of students as per their native place on Promotion Mix in the selection of TE institute, calculated with On-Way ANOVA by Minitab 17. There is a relationship between native place of students and influence of promotional mix on them in selecting TE institute. Banners/Hoardings (F-value= 5.43, p-value= 0.005), Face-to-face counseling (F-value= 4.64, p-value= 0.010), Educational fairs (F-value= 9.46, p-value= 0.000), Brochure/leaflet (F-value= 4.21, p-value= 0.015), Sponsorship Programs (F-value= 9.94, p-value= 0.000) are significant at 0.05; as p<0.05 for all these promotional mixes and hence their influences are related to the native place of students. The strength of relationship can be measured by F-value, which is high for Educational fairs, Sponsorship Programs & Banners/Hoardings which indicates that these promotional mixes are highly associated with their Native Place.
However, based on the same test, there is no difference in the responses given by students residing in District, taluka and Village place on the influence of Visual/Air Media (p=0.223), institute Website (p=0.082) and Publicity (p=0.062), where p value is >0.05. We reject H1 for these influencers.
It can be seen from bar-chart 2 that Banners/Hoardings (mean=2.67) have created much impact on Village students than the District (mean=2.10) and Taluka students (mean=2.84). Similarly, Face-to-face counseling, Educational fairs, Brochure/leaflet and Sponsorship Programs for which mean of responses belonging to Village students is higher than the mean of students belonging to District and Taluka place which shows Village students are more influenced by these promotional mixes than District and taluka students in selecting TE institutes.
2 .0 6 2 2 .1 0 5 2 .5 8 2 .5 0 6 2 .1 3 1 .9 8 1 2 .4 5 1 1 .9 8
8 2.46
3 2 .2 4 1 2 .2 8
4 2.77
3 2 .7 8 4 2 .5 7 9 2 .5 9 2 .7 9 9 2 .5 0 7 2 .8 6 2 .3 8 1 2 .6 7 9 2 .9 8 6 2 .9 1 6 2 .7 0 7 2 .7 8 1 2 .9 7 2 2
.8 2.85
1 0 0.5 1 1.5 2 2.5 3 3.5 4 4.5 5 V is u al /A ir Med ia Ban n ers /H o ard in g s In st it u te W eb si te So ci al N et w o rk in g Face-t o -face co u n sel in g E d u cat io n al Fai rs Bro ch u re/ L eafl et Sp o n so rs h ip Pro g ram Pu b li ci ty
Bar-chart 2: Mean of Promotion Mix Vs Native Place
Mahajan P. T, Golahit S. B IJSRE Volume 5 Issue 1 January 2017 Page 6151 Descriptive statistics of influence of promotion mix on Technical Program in selecting TE institute.
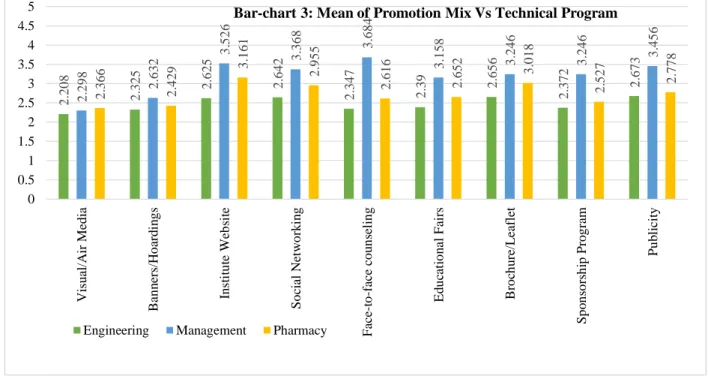
Bar-chart 3 shows mean of responses given by students admitted in Engineering, Management and Pharmacy on promotion mix which influenced them in selecting TE institute. Table 3 shows MANOVA calculated for all responses combined is significant at 0.05 i.e. p =0.000<0.05 with F-value 3.241. Hypothesis H1 is accepted for Technical Program. This means, there is difference in between students admitted in different Technical Program in accepting ‗Promotion Mix‘ as an influencer. Responses of these students are not same on at least for one promotion mix.
Table 3: Cells contains F-value & p-value obtained from One-Way ANOVA calculated from Minitab17: Figures in bold are significant at 0.05. (p <0.05; confidence level 95%
Vis ua l/ Air M edia B anne rs /Hoa rdings Ins ti tut e W ebs it e S oc ial Ne twor king F ac e-to -f ac e C ouns eli ng E duc ati ona l F air s B roc hur e/ L ea flet S pons or ship P rogr am P ubli cit y MANOVA for Gender by Wilks‘
Technical Program
F-value 0.39 0.83 9.86 5.09 13.33 4.91 4.3 5.65 4.66 F-value= 3.241
p-value 0.676 0.436 0.000 0.006 0.000 0.008 0.014 0.004 0.010 p-value= 0.000
Table 3 is presented with F-value and p-value of responses of students admitted in different technical programs; engineering, management and pharmacy, on their influence of Promotion Mix in the selection of TE institute, calculated with On-Way ANOVA by Minitab 17. There is a relationship between such students who differs by technical program and influence of promotional mix on them in selecting TE institute. Institute website (F-value= 9.86, p-value= 0.000), Social Networking (F-value= 5.09, p-value= 0.006), Face-to-face counseling (F-value= 13.33, p-value= 0.000), Educational fairs (F-value= 4.91, p-value= 0.008), Brochure/leaflet (F-value= 4.3, p-value= 0.014), Sponsorship Programs (F-value= 5.65, p-value= 0.004) and Publicity (F-value= 4.66, p-value= 0.010) are significant at 0.05; as p<0.05 for all these promotional mixes and hence their influences are related to the students admitted in different Technical Programs. The strength of relationship can be measured by F-value, which is high for Face-to-face Counseling & Institute Website which indicates that these promotional mixes are highly associated with types of Technical Programs.
2 .2 0 8 2 .3 2 5 2 .6 2 5 2 .6 4 2 2 .3 4 7 2 .3 9 2 .6 5 6 2 .3 7 2 2 .6 7 3 2 .2 9 8 2 .6 3 2 3 .5 2 6 3 .3 6 8 3 .6 8 4 3 .1 5 8 3 .2 4 6 3 .2 4 6 3 .4 5 6 2 .3 6 6 2 .4 2
9 3.1
6 1 2 .9 5 5 2 .6 1 6 2 .6 5 2 3 .0 1 8 2 .5 2 7 2 .7 7 8 0 0.5 1 1.5 2 2.5 3 3.5 4 4.5 5 V is u al /A ir Me d ia Ban n ers /H o ard in g s In st it u te W eb si te So ci al N et w o rk in g Face-t o -face co u n sel in g E d u cat io n al Fai rs Bro ch u re/ L eafl et Sp o n so rs h ip Pro g ram Pu b li ci ty
Bar-chart 3: Mean of Promotion Mix Vs Technical Program
Mahajan P. T, Golahit S. B IJSRE Volume 5 Issue 1 January 2017 Page 6152 However, based on the same test, there is no difference in the responses given by students differed by type of Technical Program on the influence of Visual/Air Media (p=0.676), Banners/Hoardings (p=0.436), where p value is >0.05. We can reject H1 for these influencers.
Students admitted in Management program are highly influenced by Education Fairs, Institute Website followed by the Pharmacy and Engineering students.
Descriptive statistics of influence of promotion mix on Location of Institute in selecting TE institute.
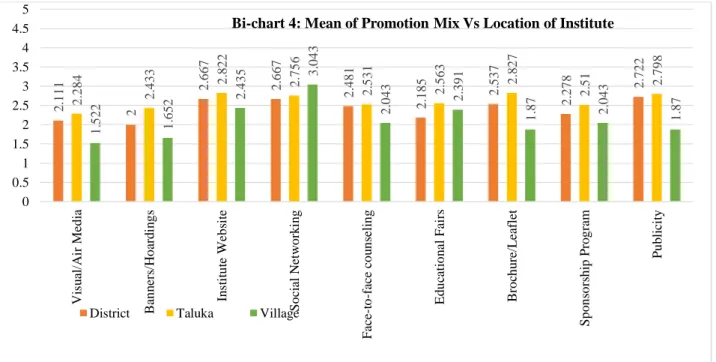
Bar-chart 4 shows mean of responses given by students admitted in institutes located at District, Taluka and Village on promotion mix which influenced them in selecting TE institute. Table 4 shows MANOVA calculated for all responses combined is significant at 0.05 i.e. p =0.002<0.05 with F-value 2.259. Hypothesis H1 is accepted. This means, there is difference in between students admitted in institutes located at District, Taluka and Village in accepting ‗Promotion Mix‘ as an influencer. Responses of these students are not same on at least for one promotion mix. Students admitted in different location of institutes have different opinions on accepting Banners/Hoardings value=0.033, F-value=3.42) and Brochure/Leaflet (p-value=0.021, F-value=3.86) as an influencer in selecting TE institute. Students belonging to institutes located at Taluka have more impact of Banners/Hoardings (mean=2.433) and Brochure/Leaflet (mean=2.827) than the students belonging to institutes located at District and Village.
Table 4: Cells contains F-value & p-value obtained from One-Way ANOVA calculated from Minitab17: Figures in bold are significant at 0.05. (p <0.05; confidence level 95%
Vis ua l/ Air M edia B anne rs /Hoa rdings Ins ti tut e W ebs it e S oc ial Ne twor king F ac e-to -f ac e C ouns eli ng E duc ati ona l F air s B roc hur e/ L ea flet S pons or ship P rogr am P ubli cit y MANOVA for Gender by Wilks‘
Location of Institute
F-value 2.21 3.42 0.69 0.36 0.74 0.94 3.86 1.01 2.83 F-value= 2.259
p-value 0.110 0.033 0.501 0.695 0.480 0.392 0.021 0.365 0.060 p-value= 0.002
2 .1 1 1 2 2 .6 6 7 2 .6 6 7 2 .4 8 1 2 .1 8 5 2 .5 3 7 2 .2 7 8 2 .7 2 2 2 .2 8 4 2 .4 3 3 2 .8 2 2 2 .7 5 6 2 .5 3 1 2 .5 6 3 2 .8 2 7 2 .5
1 2.79
8 1 .5 2 2 1 .6 5 2 2 .4 3
5 3.0
4 3 2 .0 4 3 2 .3 9 1 1 .8 7 2 .0 4 3 1 .8 7 0 0.5 1 1.5 2 2.5 3 3.5 4 4.5 5 V is u al /A ir Me d ia Ban n ers /H o ard in g s In st it u te W eb si te So ci al N et w o rk in g Face-t o -face co u n sel in g E d u ca ti o n al Fai rs Bro ch u re/ L eafl et Sp o n so rs h ip Pro g ram Pu b li ci ty
Bi-chart 4: Mean of Promotion Mix Vs Location of Institute
Mahajan P. T, Golahit S. B IJSRE Volume 5 Issue 1 January 2017 Page 6153 However, there is no difference among the students differed by location of their institutes on the influence of Visual/Air Media (p=0.110), Institute Website (p=0.501), Social Networking (p=0.695), Face-to-face
Counseling (p=0.480), Educational Fairs (p=0.392), Sponsorship Program (p=0.365), and Publicity (p=0.060) where p value is >0.05. We can reject H1 for these influencers.
SUMMARY OF FINDINGS
It is found that female students, search and analyze all sources of primary information available through promotional activities. Institute website, social networking sites, face-to-face communication, education fairs, institute‘s print material, sponsorship and publicity programs have influenced them in selecting institute of TE of their choice. This is may be for, backing-up their decision and to convince their parents and family for the decision which is essential in case of female.
It is surprising that, instead of less infrastructural facilities, rural students (belonging to village) are keen to search and gather information from institute websites and social networking sites. Villages students have considered all sources of promotion mix as well as they are influenced from these sources.
Management students are influenced by all the promotional activities of institute ahead of engineering and pharmacy students. Engineering students are less influenced by the promotional mix, this means that they are searching new sources.
Institutes who are placed in villages are concentrating only on social networking. They are lagging in other promotional mix. Institutes placed in urban are strong in their publicity program than the others. Institute those who are placed in urban area are strong in face-to-face interactions, website and print materials.
CONCLUSION
Mahajan P. T, Golahit S. B IJSRE Volume 5 Issue 1 January 2017 Page 6154 through media; may be print or visual. Institute website can act as mirror image for the institute. It is a primary source and can be impressive source through creative design, informative stats and the depth of engagement. As one can now tell these are not futuristic and farfetched predictions. Emerging trends related to TE marketing suggest that there are numerous methods of recruiting and engaging with students, including institutional websites, mobile marketing, and social media, among others. As such, it is a crucial time to create an integrated branding and marketing approach that ties together these various approaches. All the areas discussed already exist at numerous institutions. Yet change with technology is difficult especially in TE institutes. Trustees need to accept new forms of promoting an institution and a holistic marketing approach by developing relationships and bonds with the community as their customer.
REFERENCES
1. Data Source: Government of India (website:http://mhrd.gov.in/statist). Educational Statistics at a
Glance (2016). Published By: Government of India, Ministry of Human Resource Development, New Delhi.
2. Kasturirangan, K., (2004). Technical education and national development. University News, 42(31),
Aug 2004. 18-21.
3. Dasgupta P. R., Secretary, Urban Affairs and Employment, Government of India, Source:
http://pib.nic.in/feature/fe0199/f0501991.html.
4. Smith L, Tamer S., (1984). Marketing Planning for Colleges & Universities. Long Range Planning,
17(6), 104-117, Retrieved October 8, 2007.
5. Kotler, Philip (1972), A Generic Concept of Marketing. Journal of Marketing. 36 (April), 46-54.
6. Kotler, Philip and Patrick E. Murphy (1981), Strategic Planning for Higher Education. Journal of
Higher Education, 52 (September-October), 470-489.
7. Beverland, M., Napoli, J., and Lindgreen, A. (2007). Industrial global brand leadership.
8. Darrell Norman Bureell and Brain C., Grizzell (2008). Competitive Marketing and Planning Strategy
in Higher Education. Academic Leadership: Online Journal, Vol. 6 No. 1.
9. Levine, A. (2000). The future of colleges: 9 inevitable Changes. Chronicle of Higher Education,
October 27 2000.
10.Johnson Wayne and Jones Russel. Declining Interest in Engineering Studies at a Time of Increased
Business Need. Book: Universities and Business: partnering for knowledge society, part V, Chapter 20, p-233-240.
11.Sathivel, P.B., Rajendran, G. & Raju, R. (2005). TQM Implementation and students’ satisfaction of
academic performance. The TQM Magazine, Vol.17 No. 6, pp. 573-89.
12.Kelley, H. & Mahady, T. 2003. Marketing for non-profit organizations - Introduction. [Online].
Available from: http://www.charityvillage.com/cv/research/rfmk48.html [Downloaded: 12-05-2006].
13.Bok, 2003; Kirp, 2003; Zemsky, Wegner, and Massy, 2005. Strategic Leadership: Integrating
Strategy and Leadership in Colleges and Universities. Published by: Americal Council on Education, 2007.
14.Kotler, P. & Fox, K. 1995. Strategic marketing for educational institutions. Englewood Cliffs, New
Jersey, USA: Prentice Hall.
15.Kittle, B. 2000. Institutional advertising in higher education. Journal of Marketing for Higher
Education, 9(4).
16.Laurer, L.D. 2006. Advancing higher education in uncertain times. [Online]. Available from:
http://www2.university [Downloaded: 2006-12-6].
17.Cann, C.W., & George, M.A. (2003). Key elements of a successful drive toward marketing strategy
Mahajan P. T, Golahit S. B IJSRE Volume 5 Issue 1 January 2017 Page 6155
18.Howe, N. & Strauss, W. (2000). Millennials rising: the next great generation. (New York, NY,
Vintage Books).
19.Keller Kevine and Kotler Philip. Holistic Marketing - A broad, Integrated Prospective to Marketing
Management. Chapter 30 of Does Marketing Need Reform? Fresh Perspectives on the Future; 2006; p-300.
20.Lamb, C.W., Hair, J.F., McDaniel, C., Boshoff, C. & Terblanche, N.S. 2004. Marketing
management. 2nd ed. South Africa, Cape Town: Oxford University Press..
21.Ahmed, P. K., Rafiq, M., and Saad, N. M. (2003). Internal Marketing and the Mediating role of Organizational Competencies. European Journal of Marketing, 37, 1221-1278..
22.Kitchen, P., & Burgmann, I. (2015). Integrated marketing communications: Making it work at a strategic level. Journal of Business Strategy. 36: 34–39. doi:10.1108/JBS-05-2014-0052.
23.Belch, G. E., & Belch, M. A. (2004). Advertising and promotion: An integrated Marketing
communications perspective. (6th ed.). New York: McGraw-Hill/Irwin..
24.Bansal, H. S., Mendelson, M. B., Sharma, B. (2001). The Impact of Internal Marketing Activities on
External Marketing Outcomes. Journal of Quality Management, 6, 61-76..
25.Machado, R. & Cassim, S. (2002). Marketing for entrepreneurs. 2nd ed..
26.Strydom, J., Jooste, C. & Cant, M. 2000. Marketing management. 4th ed. Cape Town: Juta.
27.Jones, M. (2002). The effectiveness of marketing communication strategies employed by universities
and Technikons in the Cape Peninsula with specific reference to career exhibitions and open days in attracting first year students. Unpublished Masters thesis. Cape Town: University of Cape Town.
28.Kotler, P. & Armstrong, G. (2001). Principles of marketing. 9th ed. Englewood Cliffs, New Jersey,
USA: Prentice Hall.
29.Lagae, Wim (2005). Sports Sponsorship and Marketing Communication: A European Perspective.
Harlow: FT Prentice Hall cop. 2005.
30.Jobber, David (2007). Principles and Practice of Marketing. 5th ed. McGraw-Hill 2007..
31.Chester, P.A. (2005). EDU Internet strategies to market higher education organizations. Press
release (EDU–IS).
32.Du Plessis, P.J. & Rousseau, G.G. (2005). Buyer behavior: A multi-cultural approach. 3rd ed. Cape
Town: Oxford.
33.Seymour, L. (2000). Giving the Web the new college try: Students online surf to sample life on
campus. The Washington Post. 28 March: 11..
34.Barnes, N. and Lescault, A. Social Media Adoption Soars as Higher‐Ed Experiments and
Reevaluates Its Use of New Communications Tools. U‐Mass Dartmouth Center for Marketing
Research, 2012. p. 5‐10.
35.Morgan, R. M. & Hunt, S. D. (1994, July). The commitment-trust theory of relationship marketing.
Journal of Marketing, 58, 20–38.
36.Internet Source: Academic Ranking of World Universities.