WHY IS SCHIZOPHRENIA WORSE FOR BLACK AMERICANS? UNDERSTANDING PATHWAYS TO REAL-WORLD IMPAIRMENT
Arundati Nagendra
A dissertation submitted to the faculty at the University of North Carolina at Chapel Hill in partial fulfillment of the requirements for the degree of Doctor of Philosophy in the Department
of Psychology and Neuroscience in the College of Arts and Sciences.
Chapel Hill 2019
iii ABSTRACT
Arundati Nagendra: Why is Schizophrenia Worse for Black Americans? Understanding Pathways to Real-World Impairment
(Under the direction of David L. Penn)
A recent meta-analysis of 55 studies revealed that Black Americans are 2.4 times more
likely than Whites to be diagnosed with schizophrenia. After diagnosis, Black Americans with
schizophrenia experience worse objective functional outcomes (e.g., hospitalizations,
homelessness) than their White counterparts. However, there is a paucity of systematic research
on why this happens. This knowledge is necessary in order to develop effective and targeted
interventions. This three-paper dissertation aims to answer some foundational questions about
the experiences of Black Americans with schizophrenia after diagnosis. Taken together, the
proposed studies endeavor to expand the body of research on racial disparities in schizophrenia
from a narrow focus on diagnosis, to a broader exploration of why Black Americans diagnosed
iv
TABLE OF CONTENTS
LIST OF TABLES……… vi
LIST OF FIGURES………... vii
GENERAL INTRODUCTION: WHY IS SCHIZOPHRENIA WORSE FOR BLACK AMERICANS? UNDERTANDING PATHWAYS TO REAL-WORLD IMPAIRMENT………. 1
References………. 6
PAPER 1: DEMOGRAPHIC, PSYCHOSOCIAL, CLINICAL, AND NEUROCOGNITIVE BASELINE CHARACTERISTICS OF BLACK AMERICANS IN THE RAISE-ETP STUDY……….. 10
Introduction………... 10
Methods………. 11
Participants……… 11
Measures……… 12
Data analytic strategy……… 13
Results………... 14
Demographic characteristics……….. 14
Psychosocial functioning………... 14
Clinical status……… 14
Neurocognition……….. 15
Trend-level findings……….. 15
Discussion……….. 15
v
PAPER 2: NEIGHBORHOOD SOCIOECONOMIC STATUS AND RACIAL DISPARITIES IN SCHIZOPHRENIA – AN EXPLORATION OF DOMAINS
OF FUNCTIONING………. 26
Introduction………... 26
Methods………. 29
Participants……… 29
Measures……… 29
Data analytic strategy……… 33
Results………... 34
Discussion……….. 35
References………. 44
PAPER 3: EVALUATION OF RACIAL BIAS IN BLACK VERSUS WHITE AMERICANS WITH SCHIZOPHRENIA – A DIFFERENTIAL ITEM FUNCTIONING ANALYSIS………... 50
Introduction………... 50
Methods………. 52
Participants……… 52
Measure: The Positive and Negative Syndrome Scale……….. 53
Data Analytic Strategy……….. 54
Results………... 55
Demographics……… 55
Subscale unidimensionality………... 55
Primary and Exploratory Analyses: Measurement Invariance between Groups as DIF Analysis……… 56
vi
Discussion………. 58
References………. 63
GENERAL DISCUSSION: WHY IS SCHIZOPHRENIA WORSE FOR BLACK AMERICANS? THE IMPORTANCE OF NEUROCOGNITION AND
RACE-RELATED FACTORS……….. 67
vii
LIST OF TABLES
Table
1. Paper 1, Table 1. Descriptive Statistics………. 21
2. Paper 2, Table 1. Sample Description and Group Comparisons………... 42
3. Paper 2, Table 2. Correlations Between NC, SC, SSPA, UPSA-B,
and SLOF scores………... 43
viii
LIST OF FIGURES
Figure
1. Paper 3, Figure 1. CFA models for Emotional Distress, Negative Symptoms, Positive Symptoms, and Disorganized Thoughts items
1
GENERAL INTRODUCTION
WHY IS SCHIZOPHRENIA WORSE FOR BLACK AMERICANS?: UNDERSTANDING PATHWAYS TO REAL-WORLD IMPAIRMENT
Racial disparities in schizophrenia have been observed in the US since the late 1960s, such that Black Americans are disproportionately diagnosed with the illness (Metzl, 2009).
Scholars have debated the role of bias in the diagnostic process versus “genuine” racial
differences (i.e., cultural correlates of being Black) in explaining these disparities (see Schwartz
& Blankenship, 2014, for a review). A recent meta-analysis of 55 studies revealed that Black
Americans are 2.4 times more likely than Whites to be diagnosed with schizophrenia, even after accounting for treatment setting, geographical location, and rigor of diagnostic procedure
(Olbert, Nagendra, & Buck, 2018). The findings of the meta-analysis indicate that bias may play some role in observed racial diagnostic disparities; however, they also strongly suggest that the
experience of being Black in the US is “schizophrenogenic”, and that this vulnerable group warrants clinical and research attention.
In contrast to the accumulation of research on racial diagnostic disparities, few studies
have explored racial disparities after the diagnostic event. This is a striking oversight, given evidence from large-scale studies showing that Black individuals with schizophrenia experience
worse real-world outcomes than their White counterparts. Specifically, Blacks are about twice as likely to be unemployed (Rosenheck et al., 2006), about three times more likely to be
hospitalized (Rost, Hsieh, Xu, Menachemi, & Young, 2011), experience elevated rates of
homelessness (Folsom et al., 2005), and face a higher risk of incarceration (Baillargeon,
2
of systematic research on racial disparities after the diagnostic event amounts to a massive gap in our understanding of why Black Americans with schizophrenia experience such destructive
real-world outcomes. This knowledge is necessary in order to develop effective and targeted
interventions. Thus, the three proposed papers aim to answer some foundational questions about
the experiences of Black Americans with schizophrenia after diagnosis.
The first paper documents the initial treatment presentation of Black Americans
diagnosed with first-episode psychosis (FEP) across four broad domains – demographics (e.g.,
education level, type of insurance), psychosocial functioning (e.g., quality of life, self-stigma), neurocognition, and clinical factors (e.g., symptoms, duration of untreated psychosis). The study
is intended to illuminate whether racial differences noted in chronic psychosis (e.g., cognitive
impairments, Keefe et al., 2006; Kern et al., 2008) are present at the onset of the illness or develop over time. This has important implications regarding the often-unmet treatment needs of
Black Americans, as it points to key areas for early intervention that may improve long-term outcomes. Data for this study is provided by the NIMH-funded RAISE Early Treatment
Program, a seminal multisite study on community treatment interventions for FEP (Kane et al., 2016). The sample consists of 152 Black and 218 White individuals with FEP and is considered
to be nationally representative. Findings from this project indicate that as compared to White Americans, Black Americans with FEP appear to begin treatment with disadvantages in known
predictors of outcome (e.g., more severe disorganized symptoms), as well as generally poorer
functioning (e.g., higher rates of homelessness and transience) than their White counterparts. The implications of these findings in terms of treatment intervention, participation, and outcome are
3
The second paper hones in more specifically on four domains of functioning in schizophrenia: neurocognition, social cognition, social skills, and clinician-rated community
functioning. These domains were chosen because they have shown strong associations with objective outcomes and are amenable to direct intervention (e.g., Cellard et al., 2011; Combs et
al., 2007; Fett et al., 2011; Mcgurk et al., 2007; Penn, Roberts, Combs, & Sterne, 2007; Revell, Neill, Harte, Khan, & Drake, 2015; Turner, van der Gaag, Karyotaki, & Cuijpers, 2014). While
prior studies have evaluated racial differences in individual domains of functioning (e.g.,
(Brekke, Nakagami, Kee, & Green, 2005; Keefe et al., 2006; Kern et al., 2008; Pinkham, Kelsven, Kouros, Harvey, & Penn, 2017; Sabbag et al., 2015), no known race-based study has
evaluated all four of these domains within one sample. The study aims to answer three questions:
First, are there racial differences in performance across these four domains? This will provide an overview of which areas may be especially important for intervention in order to improve
outcomes. Second, what proportion of observed racial differences can be explained by socioeconomic status? Given the strong overlap between Black race and low socioeconomic
status (Nagendra, Schooler, et al., 2018; Rosenheck et al., 2006), it is necessary to parse their separate effects as they may yield different treatment implications. Third, do neurocognition,
social cognition, and social skills predict community functioning with equal strength across Black and White Americans? Cross-cultural research has demonstrated that even established
constructs may not function the same way across races (Gurak & Weisman de Mamani, 2015;
Rosenfarb & Bellack, 2006; Sue & Sue, 2016; Triandis & Brislin, 1984); thus, it is crucial to establish the predictive validity of domains of functioning in Black Americans in order to
4
al., 2014; Pinkham, Penn, Green, & Harvey, 2016; Pinkham, Harvey, & Penn, 2018). The sample consists of 128 Black and 65 White individuals, diagnosed largely with chronic
schizophrenia-spectrum illnesses (a small subset is diagnosed with first-episode psychosis).
The two papers proposed above are based on the assumption that widely-used
assessments in schizophrenia research are valid in Black Americans. However, cross-cultural psychology has demonstrated that even established measures may not be valid in minority
groups (e.g., Iwata, Turner, & Lloyd, 2002; Perreira, Deeb-Sossa, Harris, & Bollen, 2005).
Within schizophrenia research, there has been evidence that factors independent of genuine impairment may artificially inflate racial differences in assessment scores. For example,
clinicians tend to misinterpret normative cultural mistrust as pathological clinical paranoia in
Black Americans (Whaley, 2001, 2011) and Black Americans perform worse on social cognitive tasks when they are tested by other-race experimenters (Nagendra, Twery, et al., 2018) or when
stimuli consist solely of White individuals (Pinkham et al., 2008). Thus, the third and final paper evaluates the presence and magnitude of racial bias in one of the most widely used assessments
of schizophrenia symptoms – the Positive and Negative Syndrome Scale (PANSS; Kay,
Fiszbein, & Opler, 1987). A robust statistical method, differential item functioning (DIF), is used
to detect item-level bias. The sample was compiled by merging datasets from five NIMH-funded studies, and consists of 1043 Black and 1230 White individuals with schizophrenia-spectrum
disorders. The study found negligible racial biases, suggesting that the PANSS is a valid measure
5
Taken together, the proposed studies endeavor to expand the body of research on racial disparities in schizophrenia from a narrow focus on diagnosis, to a broader exploration of why
Black Americans experience such damaging real-world outcomes. These papers are intended to model the use of large, well-powered samples to answer basic conceptual questions about the
experiences of Black Americans after the diagnostic event. It is hoped that with continued systematic research along these lines, scholars will eventually develop an empirically-supported
sociocultural model of Black Americans with schizophrenia, which can then be used to inform
6
REFERENCES
1. Baillargeon, J., Binswanger, I. A., Penn, J. V, Williams, B. A., & Murray, O. J. (2009). Psychiatric disorders and repeat incarcerations: The revolving prison door. American Journal of Psychiatry, 166, 103–109. https://doi.org/10.1176/appi.ajp.2008.08030416 2. Brekke, J. S., Nakagami, E., Kee, K. S., & Green, M. F. (2005). Cross-ethnic
differences in perception of emotion in schizophrenia. Schizophrenia Research, 77, 289–98. https://doi.org/10.1016/j.schres.2005.04.004
3. Combs, D. R., Adams, S. D., Penn, D. L., Roberts, D., Tiegreen, J., & Stem, P. (2007). Social Cognition and Interaction Training (SCIT) for inpatients with schizophrenia spectrum disorders: Preliminary findings. Schizophrenia Research, 91, 112–6. https://doi.org/10.1016/j.schres.2006.12.010
4. Fett, A.-K. J., Viechtbauer, W., Dominguez, M.-G., Penn, D. L., van Os, J., &
Krabbendam, L. (2011). The relationship between neurocognition and social cognition with functional outcomes in schizophrenia: a meta-analysis. Neuroscience and Biobehavioral Reviews, 35, 573–588. https://doi.org/10.1016/j.neubiorev.2010.07.001
5. Folsom, D. P., Hawthorne, W., Lindamer, L., Gilmer, T., Bailey, A., Golshan, S., … Jeste, D. V. (2005). Prevalence and risk factors for homelessness and utilization of mental health services among 10,340 patients with serious mental illness in a large public mental health system. American Journal of Psychiatry, 162, 370–376.
https://doi.org/10.1176/appi.ajp.162.2.370
6. Gurak, K., & Weisman de Mamani, A. (2017). Caregiver expressed emotion and
psychiatric symptoms in African-Americans with schizophrenia: An attempt to understand the paradoxical relationship. Family Process, 45, 476–486.
https://doi.org/10.1111/famp.12188
7. Iwata, N., Turner, R. J., & Lloyd, D. A. (2002). Race and ethnicity and depressive symptoms in community-dwelling young adults: A differential item functioning analysis. Psychiatry Research, 110, 281–289. https://doi.org/10.1016/S0165-1781(02)00102-6 8. Kay, S. R., Fiszbein, A., & Opler, L. A. (1987). The Positive and Negative Syndrome Scale (PANSS) for schizophrenia. Schizophrenia Bulletin, 13, 261–276.
https://doi.org/10.1093/schbul/13.2.261
9. Keefe, R. S. E., Bilder, R. M., Harvey, P. D., Davis, S. M., Palmer, B. W., Gold, J. M., … Lieberman, J. A. (2006). Baseline neurocognitive deficits in the CATIE schizophrenia trial. Neuropsychopharmacology, 31, 2033–2046. https://doi.org/10.1038/sj.npp.1301072
7
11. McGurk, S. R., Twamley, E. W., Sitzer, D. I., McHugo, G. J., & Mueser, K. T. (2007). A meta-analysis of cognitive remediation in schizophrenia. American Journal of
Psychiatry, 164, 1791–1802. https://doi.org/10.1176/appi.ajp.2007.07060906
12. Metzl, J. (2009). The Protest Psychosis: How schizophrenia became a Black disease. Boston, MA: Beacon Press.
13. Nagendra, A., Schooler, N. R., Kane, J. M., Robinson, D. G., Mueser, K. T., Estroff, S. E., … Penn, D. L. (2018). Demographic, psychosocial, clinical, and neurocognitive baseline characteristics of Black Americans in the RAISE-ETP study. Schizophrenia Research, 193, 64–68. https://doi.org/10.1016/j.schres.2017.06.038
14. Nagendra, A., Twery, B. L., Neblett, E. W., Musta, H., Jones, T. S., Gatewood, D. A., & Penn, D. L. (2018). Social cognition and African American men: The roles of perceived discrimination and experimenter race on task performance. Psychiatry Research, 259, 21 26. https://doi.org/10.1016/j.psychres.2017.09.074
15. Olbert, C. M., Nagendra, A., & Buck, B. (2018). Meta-analysis of black vs. white racial disparity in schizophrenia diagnosis in the United States: Do structured assessments
attenuate racial disparities? Journal of Abnormal Psychology, 127, 104–115. https://doi.org/10.1037/abn0000309
16. Penn, D. L., Roberts, D. L., Combs, D., & Sterne, A. (2007). Best practices: The Development of the Social Cognition and Interaction Training program for schizophrenia spectrum disorders. Psychiatric Services, 58, 449–451.
https://doi.org/10.1176/appi.ps.58.4.449
17. Perreira, K. M., Deeb-Sossa, N., Harris, K. M., & Bollen, K. (2005). What are we measuring? An evaluation of the CES-D across race/ethnicity and immigrant generation. Social Forces, 83, 1567–1601. https://doi.org/10.1353/sof.2005.0077
18. Pinkham, A. E., Harvey, P. D., & Penn, D. L. (2018). Social cognition psychometric evaluation: Results of the final validation study. Schizophrenia Bulletin, 44, 737–748. https://doi.org/10.1093/schbul/sbx117
19. Pinkham, A. E., Kelsven, S., Kouros, C., Harvey, P. D., & Penn, D. L. (2017). The effect of age, race, and sex on social cognitive performance in individuals with
schizophrenia. The Journal of Nervous and Mental Disease, 205, 346–352. https://doi.org/10.1097/NMD.0000000000000654
20. Pinkham, A. E., Penn, D. L., Green, M. F., Buck, B., Healey, K., & Harvey, P. D. (2014). The Social Cognition Psychometric Evaluation study: Results of the expert survey and RAND panel. Schizophrenia Bulletin, 40, 813–823.
8
21. Pinkham, A. E., Penn, D. L., Green, M. F., & Harvey, P. D. (2016). Social cognition psychometric evaluation: Results of the initial psychometric study. Schizophrenia Bulletin, 42, 494–504. https://doi.org/10.1093/schbul/sbv056
22. Pinkham, A. E., Sasson, N. J., Calkins, M. E., Richard, J., Hughett, P., Gur, R. E., & Gur, R. C. (2008). The other-race effect in face processing among African American and Caucasian individuals with schizophrenia. The American Journal of Psychiatry, 165, 639 45. https://doi.org/10.1176/appi.ajp.2007.07101604
23. Prince, J. D., Akincigil, A., & Bromet, E. (2007). Incarceration rates of persons with first-admission psychosis. Psychiatric Services, 58, 1173–1180.
https://doi.org/10.1176/appi.ps.58.9.1173
24. Revell, E. R., Neill, J. C., Harte, M., Khan, Z., & Drake, R. J. (2015). A systematic review and meta-analysis of cognitive remediation in early schizophrenia. Schizophrenia Research, 168, 213–222. https://doi.org/10.1016/j.schres.2015.08.017
25. Rosenfarb, I. S., Bellack, A. S., & Aziz, N. (2006). Family interactions and the course of schizophrenia in African American and White patients. Journal of Abnormal
Psychology, 115, 112–120. https://doi.org/10.1037/0021-843X.115.1.112
26. Rosenheck, R., Leslie, D., Keefe, R., McEvoy, J., Swartz, M., Perkins, D., … Lieberman, J. (2006). Barriers to employment for people with schizophrenia. American Journal of Psychiatry, 163, 411–417. https://doi.org/10.1176/appi.ajp.163.3.411
27. Rost, K., Hsieh, Y.-P., Xu, S., Menachemi, N., & Young, A. S. (2011). Potential disparities in the management of schizophrenia in the United States. Psychiatric Services, 62, 613–618. https://doi.org/10.1176/appi.ps.62.6.613
28. Sabbag, S., Prestia, D., Robertson, B., Ruiz, P., Durand, D., Strassnig, M., & Harvey, P. D. (2015). Absence of bias in clinician ratings of everyday functioning among African American, Hispanic and Caucasian patients with schizophrenia. Psychiatry Research, 229, 347–352. https://doi.org/10.1016/j.psychres.2015.06.042
29. Schwartz, R. C., & Blankenship, D. M. (2014). Racial disparities in psychotic disorder diagnosis: A review of empirical literature. World Journal of Psychiatry, 4, 133–140. https://doi.org/10.5498/wjp.v4.i4.133
30. Turner, D. T., van der Gaag, M., Karyotaki, E., & Cuijpers, P. (2014). Psychological
interventions for psychosis: A meta-analysis of comparative outcome studies. American Journal of Psychiatry, 171, 523–538. https://doi.org/10.1176/appi.ajp.2013.13081159
9
32. Whaley, A. L. (2011). Clinicians’ competence in assessing cultural mistrust among African American psychiatric patients. Journal of Black Psychology, 37, 387–406. https://doi.org/10.1177/0095798410387133
33. Wykes, T., Huddy, V., Cellard, C., McGurk, S. R., & Czobor, P. (2011). A meta-analysis of cognitive remediation for schizophrenia: Methodology and effect sizes. American
10
PAPER 1: DEMOGRAPHIC, PSYCHOSOCIAL, CLINICAL, AND NEUROCOGNITIVE BASELINE CHARACTERISTICS OF BLACK AMERICANS IN THE RAISE-ETP
STUDY1
Introduction
The Recovery After an Initial Schizophrenia Episode Early Treatment Program
(RAISE-ETP) was a 24-month cluster randomized controlled trial that compared NAVIGATE, a
multidisciplinary team-based intervention for first-episode psychosis (FEP), to community care
across 34 sites (Kane et al., 2016). The results showed that, as compared to community care,
NAVIGATE participants improved more in quality of life (QoL), symptoms, and participation in
work and school, but did not differ in hospitalizations.
Despite this evidence supporting the effectiveness of NAVIGATE as a treatment for FEP, its
specific impact on individuals of different racial and ethnic backgrounds has not yet been
comprehensively explored. Ethnic minorities have a modest increased risk of schizophrenia
across countries (van Os et al., 2010). However, even as compared to other ethnic minorities in
the US, Black Americans appear disproportionately affected by schizophrenia (Schwartz &
Blankenship, 2014). A recent review showed that as compared to Caucasians, Black Americans
are more likely to be diagnosed with a nonaffective psychotic disorder, and exhibit distinct
clinical presentations (e.g., more prominent first-rank symptoms), lower rates of treatment
engagement, and poorer outcomes (Lawson, 2008). These findings suggest that Black Americans
1 This paper originally appeared as a published manuscript. The original citation is as follows: Nagendra, Schooler,
11
with psychosis have somewhat different and often-unmet treatment needs. However, the nature
of these characteristics and the implications for differential treatment needs has not yet been
comprehensively explored in individuals with FEP.
In the RAISE-ETP study, 41% (N = 152) of participants were Black American, providing an
opportunity to examine racial differences in important factors, such as medication type and
dosage, duration of untreated psychosis, baseline symptomatology, and neurocognition (Emsley
et al., 2005). A recent analysis of baseline psychiatric prescriptions of RAISE-ETP participants
revealed that Black Americans were more likely than Caucasians to receive prescriptions for
first-generation antipsychotics in univariate but not multivariate analyses, and that there were no
significant racial differences were found for dosage of medication in univariate or multivariate
analyses (Robinson et al., 2015). However, the RAISE-ETP study collected a wealth of other
data that may further illuminate race-based disparities in FEP. The current paper examines
demographic, psychosocial, clinical, and neurocognitive baseline differences between Black
American and Caucasian participants in RAISE-ETP, with the goal of highlighting key areas for
intervention and research on racial disparities.
Method Participants
The RAISE-ETP sample consisted of 404 individuals with FEP at 34 sites in the United
States. The current paper examines the subset of Black American (N=152) and Caucasian
(N=218) participants. The 34 participants with other race identification are not examined.
Recruitment procedures and participant characteristics are detailed in the primary RAISE-ETP
12 Measures
All measures described were collected at the time of study enrollment. Trained and
blinded clinical raters assessed diagnosis, symptoms and quality of life via live, secure video
connection. Other measures were assessed at the sites.
Demographic characteristics.Demographic variables in addition to race and ethnicity
included age, gender, client and parental education, marital and residential status, insurance type,
and number of criminal justice contacts in the 30 days prior to enrollment. For residential status,
the “Homeless/Transient” cases generally reflect unstable or transient living situations (e.g.,
“extended family members or homeless”, “brother's back yard”, “living with friends”). Total
income was not assessed, as the variable had large amounts of missing data (35.4%, N=131).
Psychosocial Functioning. Quality of life was measured with Heinrich’s Quality of Life Scale based on the 30 days prior to study enrollment (Heinrichs et al., 1984). Self-reported
student and work status was also obtained as an objective measure of functioning. Self-reported
measures related to recovery were measured with the Mental Health Recovery scale (Young &
Bullock, 2003), a modified version of the Perceived Well-Being Scale (Ryff, 1989), the Stigma
Scale (King et al., 2007) and the Brief Evaluation of Medication Influences and Beliefs scale
(Dolder et al., 2004).
Clinical Status. Diagnoses of psychotic and substance use disorders were assessed with the Structured Clinical Interview for the DSM-IV (SCID). Duration of untreated psychosis was
assessed as part of the SCID interview and defined as the time between the onset of first
psychotic symptom and initiation of antipsychotic medication treatment.
Symptoms were measured with the Positive and Negative Syndrome Scale, the Clinical
13
(Addington et al., 2003) based on the seven days prior to the assessment. Information on
psychiatric history was also collected (e.g., onset of symptoms, first psychiatric hospitalization).
Neurocognition.Neurocognition was measured with the Brief Assessment of Cognition in Schizophrenia (BACS) administered by trained raters at the sites (Keefe et al., 2004).
Data analytic strategy.
Independent samples t-tests and chi-squares were used to analyze all variables except for
neurocognition, which was assessed with a one-way ANCOVA with level of education entered
as a covariate. Non-normal distributions in dependent variables for t-tests were bootstrapped
using 5000 replicates. Significant omnibus results for chi-square tests were followed up by
examining cell differences with adjusted standardized residuals (ASR) +/- 2.00. Due to the
strong positive skew of DUP, the non-parametric Mann-Whitney U Test was conducted to
compare median values on this variable. Tests were conducted with and without outliers (defined
as any values +/- 3 SD the mean); however, no differences in significance tests emerged when
outliers were excluded. Thus, all reported results include outliers.2 Finally, given the large
number of statistical tests, we first report on significant group differences, followed by a
summary of trend-level findings.
14 Results
Demographic characteristics.
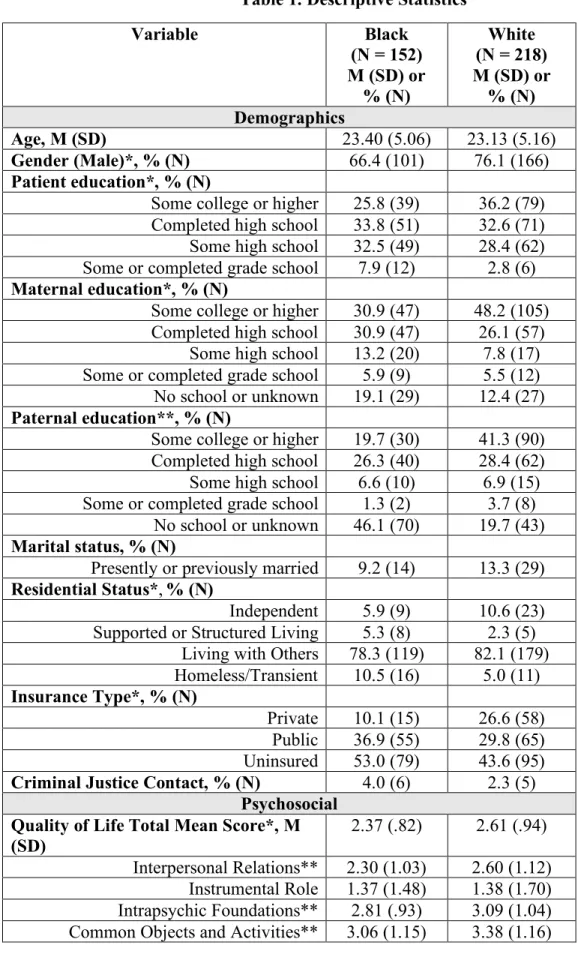
Descriptive statistics are provided in Table 1. Black Americans were less likely to be
male (χ2=4.19, p<.05) and to have obtained a college degree or higher (χ2=9.90, p<.05) than
Caucasians. Moreover, a lower proportion of Black American participants’ mothers (χ2=12.46,
p<.05) and fathers (χ2=35.14, p<.01) had obtained a college degree or higher than the parents of Caucasian participants. There was also a significant difference in residential status (χ2=8.32,
p<.05); a greater proportion of Black Americans than Caucasians were homeless or transient. Finally, Black Americans were less likely than Caucasians to have private insurance (χ2=15.20,
p<.01). There were no significant racial differences in marital status, work or student status, or
criminal justice contacts.
Psychosocial Functioning.
Black Americans demonstrated poorer functioning on the QoL total mean score as
compared to Caucasians (t=-2.56, p<.05), including significantly lower scores on three out of
four QoL subscales: Interpersonal Relations, (t=-2.66, p<.01), Intrapsychic Foundations (t=-2.63,
p<.01), and Common Objects and Activities (t=-2.65, p<.01). Black American and Caucasian participants did not differ in scores on the QoL instrumental role subscale, or student or work
status. There were no significant racial differences on the Perceived Well-Being Scale and the
Brief Evaluation of Medication Influences and Beliefs.
Clinical Status.
On the PANSS, Black Americans exhibited significantly higher scores on the
disorganization scale (t=2.07, p<.05) than Caucasians. Groups did not differ on the PANSS total
15
Black Americans were significantly less likely to meet criteria for lifetime alcohol abuse than
Caucasians (χ2=13.15, p<.01).
There were no significant group differences in diagnosis, duration of untreated psychosis,
cannabis use, Calgary Depression Scale scores, age of onset, age of first psychiatric and
psychotic symptoms, first psychiatric hospitalization, and number and duration of total
hospitalizations.
Neurocognition.
A one-way ANCOVA demonstrated Black American participants performed more poorly
on the BACS composite neurocognition score (F=7.79, p<.01) after covarying for education. In
addition, after covarying for education, Black American participants performed worse than
Caucasians on five of the six subtests (Verbal Memory, F=7.52, p<.01; Digit Sequencing,
F=10.57, p<.01; Token Motor, F=8.51, p<.01; Fluency, F=6.87, p<.01; Tower of London,
F=16.31, p<.01). Trend level findings.
Black Americans reported marginally higher scores on the Mental Health Recovery
Measure, (t=1.85, p=.07), marginally lower scores on the Stigma Scale, (t=-1.74, p=.08), and
marginally higher ratings on the Clinical Global Impressions – Severity scale, (t=1.80, p=.07).
Additionally, Black Americans performed marginally worse than Caucasians on the Symbol
Coding subtest of the BACS (F=3.60, p=.06).
Discussion
Black Americans with FEP begin treatment with disadvantages in known predictors of
treatment outcome (i.e., neurocognition and education level), as well as poorer quality of life
16
lack of private insurance may pose practical barriers to treatment access and engagement.
Impaired neurocognition and disorganized symptoms may also hinder the ability of Black
Americans to fully benefit from therapeutic interventions. Thus, specific treatment targets for
Black Americans with FEP could include an emphasis on case management to address practical
barriers to care (e.g., homelessness, lack of private insurance) and quality of life, and greater use
of cognitive remediation to improve neurocognitive deficits. Our results also highlight areas in
which there are no significant differences between Black Americans and Caucasians who come
to treatment for FEP. These include diagnosis, DUP, symptoms other than disorganization, paths
to care indexed by number of prior hospitalizations, and the age at which psychiatric illness was
first diagnosed. Finally, they are less likely to have a diagnosis of co-occurring alcohol disorder.
Regarding symptom presentation, a robust body of research demonstrates that clinicians
rate Black Americans higher than Caucasians on first-rank symptoms (Strakowski et al., 2003),
hallucinations and paranoia (Adebimpe et al., 1981, 1982; Strakowski et al., 1996), and negative
symptoms (Chang, Newman, D’Antonio, McKelvey, & Serper, 2011; Mark, Palmer, Russo, &
Vasey, 2003; reviewed by Schwartz and Blankenship, 2014). In contrast, the present study found
that Black Americans were rated higher only on disorganized symptoms. There are several
potential reasons for this discrepancy. First, previous studies included individuals with affective
diagnoses as well as schizophrenia-spectrum disorders (Li, Eack, Montrose, Miewald, &
Keshavan, 2011; Strakowski et al., 2003; Trierweiler, Muroff, Jackson, Neighbors, & Munday,
2005), while the current study excluded individuals with affective psychosis. Second, many
studies on racial differences were conducted on inpatient samples (Chang et al., 2011;
Strakowski et al., 2003; Trierweiler et al., 2005), who likely experience more severe symptoms
17
with chronic psychotic disorders (Chang et al., 2011; Strakowski et al., 1996, 2003; Trierweiler
et al., 2005), rather than first-episode psychosis. Thus, the current study may highlight unique
characteristics of outpatient individuals with first-episode, non-affective psychosis.
While the current findings present important research and treatment implications, the
cross-cultural validity of assessments should be carefully considered. For example, stereotype
threat has been shown to deplete neurocognitive performance in Black Americans (Pennington,
Heim, Levy, & Larkin, 2016; Steele & Aronson, 1995). Moreover, the majority of
neurocognitive assessments bear the implicit assumption that test-takers are exposed to the same
concepts, vocabulary, and life experiences as individuals from White, middle-class backgrounds
(Laing & Kamhi, 2003), and consequently may be sensitive to factors such as level of
acculturation (Manly, 2008). Similar critiques may also be leveled at the assessment of
disorganized symptoms. Additionally, a wealth of studies suggest that clinicians may
overpathologize Black Americans with psychotic symptoms for several reasons, including
neglecting to integrate contextual or situational information into symptom evaluation,
misinterpreting culturally normative behaviors, and demonstrating differential applications of
diagnostic standards based on race (Adebimpe, 1981; Neighbors, Trierweiler, Ford, & Muroff,
2003; Olbert, Nagendra, & Buck, under review; Strakowski et al., 2003; Trierweiler et al., 2000,
2005; Whaley, 2001). Taken together, neurocognition and disorganized symptoms, as they are
currently assessed, may not accurately reflect latent ability or symptomatology in Black
Americans.
Despite being rated as significantly impaired on multiple quality of life dimensions,
statistical trends suggested that Black Americans self-reported less stigma and more recovery
18
healthy Black Americans report higher levels of global self-esteem than Caucasians (Twenge &
Crocker, 2000). Black Americans are also more likely to detach global self-esteem from
situation- or domain-specific self-evaluations (Twenge & Crocker, 2000). Consequently, Black
Americans with psychosis may be less likely than Caucasians to integrate a diagnosis of
psychosis into their global self-concept. In turn, this may result in lower levels of stigma and a
more hopeful sense of recovery. If this trend level pattern of resiliency is confirmed in future
studies, treatments specific to Black Americans that capitalize on this strength could be
developed.
Another potential explanation for this trend is the “John Henryism” phenomenon
recognized in Black American culture (Bennett et al., 2004), in which individuals respond to
long-term psychosocial stressors with a high-effort and solution-oriented approach, often at the
cost of physical health (Bennett et al., 2004). Thus, Black Americans with psychosis who face
multiple psychosocial disadvantages may self-report greater orientation towards recovery,
potentially at the cost of increased physiological stress. Again, some of these results were at
trend levels of statistical significance; therefore, this conclusion is tentative. Future studies that
examine culture-specific conceptualizations of recovery, and the role that John Henryism plays
in responding to severe mental illness, may add important nuance to our understanding of racial
disparities. The exploration of culture-specific factors, such as perceived racism and racial
identity, will also be crucial to disentangling the effects of race from those of socioeconomic
status.
Despite research that demonstrates that Black Americans are disproportionately affected
by psychosis, racial disparities in this area remain understudied. The current study points to
19
compared to Caucasians, with the hope that future research will focus on the development of
20
Table 1. Descriptive Statistics
Variable Black
(N = 152) M (SD) or
% (N)
White (N = 218) M (SD) or
% (N) Demographics
Age, M (SD) 23.40 (5.06) 23.13 (5.16)
Gender (Male)*, % (N) 66.4 (101) 76.1 (166) Patient education*, % (N)
Some college or higher 25.8 (39) 36.2 (79) Completed high school 33.8 (51) 32.6 (71) Some high school 32.5 (49) 28.4 (62) Some or completed grade school 7.9 (12) 2.8 (6) Maternal education*, % (N)
Some college or higher 30.9 (47) 48.2 (105) Completed high school 30.9 (47) 26.1 (57)
Some high school 13.2 (20) 7.8 (17) Some or completed grade school 5.9 (9) 5.5 (12) No school or unknown 19.1 (29) 12.4 (27) Paternal education**, % (N)
Some college or higher 19.7 (30) 41.3 (90) Completed high school 26.3 (40) 28.4 (62) Some high school 6.6 (10) 6.9 (15) Some or completed grade school 1.3 (2) 3.7 (8)
No school or unknown 46.1 (70) 19.7 (43) Marital status, % (N)
Presently or previously married 9.2 (14) 13.3 (29) Residential Status*,% (N)
Independent 5.9 (9) 10.6 (23) Supported or Structured Living 5.3 (8) 2.3 (5)
Living with Others 78.3 (119) 82.1 (179) Homeless/Transient 10.5 (16) 5.0 (11) Insurance Type*, % (N)
Private 10.1 (15) 26.6 (58) Public 36.9 (55) 29.8 (65) Uninsured 53.0 (79) 43.6 (95) Criminal Justice Contact, % (N) 4.0 (6) 2.3 (5)
Psychosocial Quality of Life Total Mean Score*, M (SD)
2.37 (.82) 2.61 (.94)
21
Student status (Enrolled), % (N) 20.4 (31) 18.8 (41) Work status (Employed), % (N) 11.8 (18) 15.6 (34) Recovery, M (SD)
Mental Health Recovery† 5.05 (1.31) 4.80 (1.20) Well-Being 4.03 (.85) 3.94 (.78)
Stigma† 3.86 (1.23) 4.08 (1.15) Medication Influences and Beliefs 4.90 (1.05) 4.93 (1.01)
Clinical Status Diagnosis, % (N)
Schizophrenia 53.9 (82) 51.4 (112) Schizoaffective 21.7 (33) 19.3 (42) Schizophreniform 14.5 (22) 17.4 (38) Brief Psychotic Disorder or Psychotic
Disorder NOS
9.9 (15) 11.9 (26)
Lifetime Alcohol Use** % (N)
Abuse 6.6 (10) 17.0 (37) Dependence 19.7 (30) 26.1 (57) None 65.1 (112) 56.9 (124) Lifetime Cannabis Use, % (N)
Abuse 15.8 (24) 14.7 (32) Dependence 19.1 (29) 20.6 (45) None 65.1 (99) 64.7 (141) PANSS Composite, M (SD) 2.60 (.49) 2.51 (.51) Positive 3.16 (.93) 3.00 (.97) Negative 2.80 (.81) 2.75 (.90) Disorganized* 2.71 (.92) 2.51 (.94) Excited 1.68 (.63) 1.69 (.74) Depressed 2.72 (1.15) 2.65 (1.06) Clinical Global Impressions: Severity†,
M (SD)
4.14 (.82) 3.98 (.83)
Calgary Depression Scale Mean Total Score, M (SD)
1.01 (.90) .95 (.94)
Psychiatric History, M (SD)
Duration of untreated psychosis
(Median & Interquartile range) (16.00-89.00 338.00)
70.00 (14.25-260.00)
Age of onset 18.42 (5.25) 19.40 (5.95) Age in years of first psychiatric symptoms 16.79 (6.17) 16.23 (6.53) Age in years of first psychotic symptoms 18.65 (5.73) 19.63 (6.46)
Age in years of first psychiatric hospitalization
20.90 (4.74) 21.32 (5.03)
Number of psychiatric hospitalizations 1.96 (1.52) 1.99 (2.37) Total duration in days of hospitalizations 23.96 (29.06) 22.20 (36.39)
Neurocognition (BACS), M (SD)
22 **p < .01, *p < .05, †p < .10
Verbal Memory** 35.49 (10.56) 39.44 (11.87) Digit Sequencing** 16.82 (4.87) 18.68 (4.37)
23
REFERENCES
1. Kane, J. M., Robinson, D. G., Schooler, N. R., Mueser, K. T., Penn, D. L., Rosenheck, R. A., Addington, J., Brunette, M. F., … Heinssen, R. K. (2016). Comprehensive versus usual
community care for first-episode psychosis: 2-year outcomes from the NIMH RAISE Early treatment program. The American Journal of Psychiatry, 173, 362-372.
2. van Os, J., Kenis, G., & Rutten, B. F. (2010). The environment and schizophrenia. Nature, 468, 203-212.
3. Schwartz, R. C., & Blankenship, D. M., (2014). Racial disparities in psychotic disorder diagnosis: A review of empirical literature. World Journal of Psychiatry, 4, 133-140.
4. Arnold, L. M., Keck, P. E., Collins, J., Wilson, R., Fleck, D. E., Corey, K. B., Amicone, J., Adebimpe, V. R., & Strakowski, S. M. (2004). Ethnicity and first-rank symptoms in patients with psychosis. Schizophrenia Research, 67, 207-212.
5. Lawson, W. B., 2008. Schizophrenia in African Americans, in: Mueser, K.T. & Jeste, D.V. (Eds) Clinical Handbook of Schizophrenia. New York, NY, The Guilford Press, pp. 616-623.
6. Emsley, R., Chiliza, B., & Schoeman, R. (2008). Predictors of long-term outcome in schizophrenia. Current Opinion in Psychiatry, 21, 173-177.
7. Robinson, D. G., Schooler, N., John, M., Correll, C. U., Marcy, P., Addington, J., Brunette, M. F., … Kane, J. M. (2015). Prescription practices in the treatment of first-episode schizophrenia spectrum disorders: Data from the national RAISE-ETP study. The American Journal of Psychiatry, 172, 237-248.
8. Heinrichs, D. W., Hanlon, T. E., & Carpenter, W. T. (1984). The Quality of Life Scale: An instrument for rating the schizophrenic deficit syndrome. Schizophrenia Bulletin, 10, 388–98.
9. Young, S. L., & Bullock, W. A., 2003. The Mental Health Recovery Measure. Available from University of Toledo Department of Psychology, (#918). Toledo, OH 43606-3390.
10. Ryff, C. D. Happiness is everything, or is it? (1989). Journal of Personality and Social Psychology, 57, 1069–81.
11. King, M., Dinos, S., Shaw, J., Watson, R., Stevens, S., Passetti, F, Weich, S., & Serfaty, M., (2007). The Stigma Scale: Development of a standardised measure of the stigma of mental illness. British Journal of Psychiatry, 190, 248–54.
24
13. Addington, D., Addington, J., & Maticka-Tyndale, E. (1993). Assessing depression in schizophrenia: The Calgary Depression Scale. The British Journal of Psychiatry, 63, 39-44.
14. Keefe, R. S. E., Goldberg, T. E., Harvey, P. D., Gold, J. M., Poe, M. P., & Coughenour, L. (2004). The Brief Assessment of Cognition in Schizophrenia: Reliability, sensitivity, and comparison with a standard neurocognitive battery. Schizophrenia Research, 68, 283–97.
15. Strakowski, S. M., Keck Jr., P. E., Arnold, L. M., Collins, J., Wilson, R. M., Fleck, D. E., Corey, K. B., … Adebimpe, V. R. (2003). Ethnicity and diagnosis in patients with affective disorders. The Journal of Clinical Psychiatry, 7, 747-754.
16. Adebimpe, V. R. (1981). Overview: White norms and psychiatric diagnosis of Black patients. The American Journal of Psychiatry, 138, 279-285.
17. Strakowski, S. M., Flaum, M., Amador, X., Bracha, H. S., Pandurangi, A. K., Robinson, D., & Tohen, M. (1996). Racial differences in the diagnosis of psychosis. Schizophrenia Research, 21, 117-124.
18. Chang, N., Newman, J., D’Antonio, E., McKelvey, J., & Serper, M. (2011). Ethnicity and symptom expression in patients with acute schizophrenia. Psychiatry Research, 185, 453-455.
19. Mark, T. L., Palmer, L. A., Russo, P. A., & Vasey, J. (2003). Examination of treatment pattern differences by race. Mental Health Services Research, 5, 241-250.
20. Trierweiler, S. J., Muroff, J. R., Jackson, J. S., Neighbors, H. W., & Munday, C. (2005). Clinical race, situational attributions, and diagnoses of mood versus schizophrenia disorders. Cultural Diversity and Ethnic Minority Psychology, 11, 351-364.
21. Pennington, C. R., Heim, D., Levy, A. R., & Larkin, D. T. (2016). Twenty years of stereotype threat research: A review of psychological mediators. PLoS One, 11, 1-25.
22. Steele, C. M., & Aronson, J. (1995). Stereotype threat and the intellectual test performance of African Americans. Attitudes and Social Cognition, 69, 797-811.
23. Laing, S. P., & Kamhi, A. (2003). Alternative assessment of language and literacy in culturally and linguistically diverse populations. Language, Speech, and Hearing Services in School, 34, 44-55.
24. Manly, J. J. (2008). Critical issues in cultural neuropsychology: Profit from diversity. Neuropsychology Review, 18, 179-183.
25
26. Trierweiler, S. J., Neighbors, H. W., Munday, C., Thompson, E. E., Binion, V. J., & Gomez, J. P. (2000). Clinician attributions associated with the diagnosis of schizophrenia in African American and Non-African American patients. Journal of Clinical and Consulting Psychology, 68, 171-175.
27. Whaley, A. (2001). Cultural mistrust and the clinical diagnosis of paranoid schizophrenia in African American patients. Journal of Psychopathology and Behavioral Assessment, 2, 93-100.
28. Twenge, J. M, & Crocker, J. C. (2000). Race and self-esteem: Meta-analyses comparing Whites, Blacks, Hispanics, Asians, and American Indians and Comment on Gray-Little and Hafdahl. Psychological Bulletin, 128, 371-408.
29. Bennett, G. G., Merritt, M. M., Sollers III, J. J., Edwards, C. L., Whitfield, K. E., Brandon, D. T., & Tucker, R. D. (2004). Stress, coping, and health outcomes among Black Americans: A review of the John Henryism hypothesis. Psychology & Health, 19, 369-383.
26
PAPER 2: NEIGHBORHOOD SOCIOECONOMIC STATUS AND RACIAL DISPARITIES IN SCHIZOPHRENIA
AN EXPLORATION OF DOMAINS OF FUNCTIONING1
Introduction
A recent meta-analysis of 55 studies found that Black Americans are 2.4 times more
likely to be diagnosed with schizophrenia than their White counterparts (Olbert et al., 2018).
Moreover, large-scale studies of objective real-world outcomes in schizophrenia demonstrate
that Black Americans are more likely than White individuals to be hospitalized (Rost et al.,
2011), homeless (Folsom et al., 2005), and incarcerated (Baillargeon et al., 2009; Prince et al.,
2014), as well as less likely to obtain competitive employment (Rosenheck et al., 2006). These
findings highlight that Black Americans are disproportionately impacted by schizophrenia.
However, we have a limited understanding of the pathways through which Black Americans with
schizophrenia experience worse objective outcomes. This knowledge is necessary in order to
develop effective and targeted interventions for this group.
One promising strategy that may illuminate why Black Americans experience
psychosocial impairments after diagnosis is to evaluate domains of functioning known to be
associated with long-term outcomes, including (a) social and community functioning (e.g.,
interpersonal relationships, work skills); (b) neurocognition (NC); (c) social cognition (SC); (d)
social skills; and (e) everyday living skills (i.e., “functional capacity”). These domains have
27
received a wealth of attention in schizophrenia research, as they might be more amenable to
direct intervention than broad, objective outcomes such as hospitalization and incarceration (Fett
et al., 2011; Halverson et al., 2019; Harvey et al., 2011; Turner et al., 2014).
However, research on associations between race and domains of functioning is sparse and
fragmented. Prior studies have indicated that Black Americans tend to obtain lower scores on
measures of NC (Keefe et al., 2006; Nagendra et al., 2018a; Sabbag et al., 2016) and SC (Brekke
et al., 2005; Pinkham et al., 2017). However, the only known study that has evaluated everyday
living skills, as well as social and community functioning, did not find significant racial
differences (Sabbag et al., 2016). Additionally, we are not aware of recent studies that have
evaluated the relationship between race and social skills performance. The dearth of systematic
research across domains of functioning amounts to a sizeable gap in our conceptualization of
why Black Americans with schizophrenia experience such negative objective outcomes. Thus,
the current study has three aims, which are intended to elucidate relationships between race and
domains of functioning.
First, we evaluated whether there are Black-White racial differences in measures of NC,
SC, social skills, social and community functioning, and everyday living skills. These analyses
quantify the presence and magnitude of racial disparities across domains. Second, we assessed
the extent to which socioeconomic status (SES) explains observed relationships between race
and functioning, given the strong overlap between Black race and low SES in schizophrenia
(e.g., Nagendra et al., 2018; Rosenheck et al., 2006). SES was evaluated at two levels:
individual (i.e., participant education2) and area (e.g., neighborhood education). Prior research on
28
healthy individuals has demonstrated that individual- and area-level SES may impact functioning
through complementary pathways. For example, there is a well-established relationship between
individual education and cognitive performance (Guerra-Carrillo et al., 2017); however, living in
a neighborhood with few institutional resources (e.g., parks, community centers) may hasten
cognitive decline over time (Clarke et al., 2012; Stern, 2009). Conversely, individuals with low
levels of formalized education who live in neighborhoods that facilitate social and mental
stimulation may show improvements in social and cognitive functioning over time. Thus, the
present study will evaluate the extent to which area-level SES mediates the relationship between
race and domains of functioning, while controlling for individual level SES.
Finally, this study evaluated whether NC, SC, social skills, and everyday living skills
predict community functioning comparably across Black and White Americans. An important
part of schizophrenia research is to identify and address predictors of real-world impairment in
the illness (Bowie et al., 2010; Gold, 2004). However, at present, research has not demonstrated
that these predictors of outcome function similarly in Black and White Americans. This is a
crucial oversight, as cross-cultural psychology has demonstrated that even well-established
constructs may not function in the same way across races (e.g., Chen, 2008). For example,
expressed emotion (EE) – the tendency for family members to exhibit critical, hostile, or
emotionally-overinvolved statements - was considered a robust predictor of relapse in
schizophrenia (Hooley, 2007; Kopelowicz et al., 2002). However, studies suggest that for Black
individuals with schizophrenia, higher EE may actually be associated with better outcomes
(Gurak & Weisman de Mamani, 2017; Rosenfarb et al., 2006). Moreover, a recent meta-analysis
revealed that the relationship between neurocognition and functional outcomes is weaker in
29
skills, and everyday living skills to our current conceptualization of impairment and outcomes in
schizophrenia, it is important to assess if these factors show predictive validity in Black as well
as White Americans.
Methods
Participants
Participants were 108 non-Hispanic Black and 61 non-Hispanic White Americans with
schizophrenia-spectrum illnesses from the two data collection phases of the NIMH-funded Social
Cognition Psychometric Evaluation (SCOPE) study (Pinkham et al., 2014, 2016, 2017).
Participants in the SCOPE study were recruited from mental health clinics, hospitals, and
medical centers in Florida, Texas, and North Carolina. However, addresses necessary for
neighborhood-level SES analyses were not collected from participants in North Carolina. Thus,
the sample for this study consists only of individuals from Florida and Texas with complete
addresses. All duplicates between the two phases were removed, and data from the first of two
visits was used.
Demographic, diagnostic, and clinical information for the sample included in the current
study is provided in Table 1 (information for non-hispanic Black and White Americans included
across all three SCOPE study sites is provided in Supplementary Table 1). Black participants
were more likely to be diagnosed with schizophrenia (χ2 = 12.59, p < .01) than schizoaffective
disorder. There were no significant differences in overall symptom severity as measured by total
mean score on the Positive and Negative Syndrome Scale t(167) = 0.15, p = .88.
Measures
Demographic measures. Race and ethnicity were assessed via self-report.
30
measure individual-level SES (e.g., income; Braveman et al., 2005), the data available for
participants in the SCOPE study for these variables was often missing (e.g., 30% of data on
maternal education was not available), or less useful in this cohort (e.g., not all participants had
consistent employment).
For neighborhood SES, census tract designations were geocoded using participant
addresses via the program ArcGIS, then linked to five-year data from the 2013-2017 American
Community Survey (U.S. Census Bureau, 2018). Census tracts are roughly equivalent to
“neighborhoods” (averaging around 4000 individuals) and are considered to be generally
homogeneous units in regards to population characteristics, economic status, and living
conditions (Krieger et al., 2002). No clear consensus exists on the key variables to include in a
composite neighborhood SES score, although economic measures have demonstrated the clearest
relationship with physical health problems (Krieger et al., 2002). Given that domains of
functioning are closely linked to cognitive ability, we also included neighborhood education
level in our composite score. Thus, neighborhood SES was calculated as the mean z-scores of the
percentage of people in a census tract, a) with less than a college degree; b) who were
unemployed; and c) lived below 200% of the poverty line. Higher scores on the neighborhood
SES composite indicate residence in a lower SES neighborhood.
Analyses showed that there were no significant differences between racial groups in years
of participant education, t(167) = 1.23, p = .22; thus, individual SES was excluded from further
analyses. However, Black participants lived in lower SES neighborhoods than their White
counterparts, t(167) = 3.53, p < .01.
31
NC was measured with a subset of five tasks from the Measurement and Treatment
Research to Improve Cognition in Schizophrenia (MATRICS) neurocognitive battery, which
shows robust psychometric properties (Green et al., 2014; Kern et al., 2008; Nuechterlein et al.,
2008). Processing speed was assessed through the Trail Making Test – Part A, Symbol Coding,
and Animal Fluency. Working memory was evaluated through the Letter-Number Test. Verbal
Learning was assessed through the Hopkins Verbal Learning Test. All tasks in the MATRICS
battery have strong psychometric properties and are expected to load onto one factor (Green et
al., 2014). Thus, in the current study, age- and gender-corrected participant t-score totals for each
task were averaged for a NC composite score exhibiting good reliability (Cronbach’s a = .69).
Comparable reliability was observed for Black Americans (Cronbach’s a = .65) and White
Americans (Cronbach’s a = .70).
Four SC tasks were used in the current analyses, all of which show adequate
psychometric properties (Pinkham et al., 2018, 2016). Emotion perception was measured with
the Penn Emotion Recognition Task (ER-40; Kohler et al., 2003) and the Bell-Lysaker Emotion
Recognition Task (BLERT; Bryson et al., 1997). Two tasks were used to measure theory of
mind, the ability to infer the mental states of others: The Reading the Mind in the Eyes Task
(Eyes Task; Baron-Cohen et al., 2001) and Part III of The Awareness of Social Inferences Task
(TASIT; Mcdonald et al., 2003). Based on prior research, the four tasks were expected to load
onto one latent factor (Browne et al., 2016; Ludwig et al., 2017), which was tested via
confirmatory factor analysis. Overall model fit was evaluated using recommendations from Hu
and Bentler (1999) and Bentler (2007), and the model demonstrated good fit to the data.
Standardized loadings and model fit indices are displayed in Supplementary Table 2. Thus, a SC
32
and Eyes Task (Cronbach’s a = .82). Comparable reliability was observed for Black Americans
(Cronbach’s a = .78) and White Americans (Cronbach’s a = .77).
Social skills were measured with the Social Skills Performance Assessment (SSPA),
which shows adequate psychometric properties (Patterson et al., 2001). The SSPA measures
social skills via roleplay exercises that mimic two real life situations: (a) a tenant greeting a new
neighbor; and (b) persuading a landlord to fix a leak as soon as possible. Dimensions of social
skills are rated on a 5-point Likert scale by trained observers, and include interest, fluency,
clarity, focus, affect, grooming, social appropriateness, negotiation ability, persistence, and
overall conversation/ argument. Ratings from two scenes were collapsed into an overall
composite social skill scale with a range from 16 to 80, with higher scores signifying greater
skill. Ratings were converted to z-scores prior to data analysis and exhibited good reliability
(Cronbach’s a = .88). Comparable reliability was observed for Black Americans (Cronbach’s a
= .89) and White Americans (Cronbach’s a = .89).
Real-world functioning was assessed with the Specific Levels of Functioning Scale
(SLOF; Harvey et al., 2011; Schneider & Streuning, 1983). The SLOF is a 30-item, five
point-scale, informant-rated measure of a participant’s behavior and functioning in four domains:
interpersonal relationships (e.g., social contacts, effective communication), social acceptability
(e.g., verbal and physical abuse, repetitive behaviors), participation in community activities (e.g.,
using the telephone, paying bills, leisure time), and work skills (e.g., employable skills, level of
supervision needed). In the current study, ratings were provided by informants who were free of
mental illness (i.e., high contact clinicians, family members, or close friends identified by
participants). Scores on the SLOF range from 30 to 150, with higher scores indicating better
33
SLOF exhibited good reliability in the total sample (Cronbach’s a = .92) and in Black
Americans (Cronbach’s a = .93) as well as White Americans (Cronbach’s a = .92).
Everyday living skills were assessed via the UCSD Performance-Based Skills
Assessment – Brief Version (UPSA-B; Patterson et al., 2006). This measure assesses capacity in
domains of everyday functioning through standardized skills performance situations (e.g.,
counting out money, filling out a check, making a doctor’s appointment). For the purposes of
these analyses, the UPSA-B total scaled score from both domains (comprehension/planning and
financial skills) was used. Scores range from 0-100, with higher scores indicating better
everyday living skills. For analyses, the UPSA-B totals were converted to z-scores. The UPSA-B
exhibited good reliability in the total sample (Cronbach’s a = .89) and in Black Americans
(Cronbach’s a = .83) as well as White Americans (Cronbach’s a = .96).
Data Analytic Strategy
Correlations between domains of functioning, across races, were conducted to ensure that
they were positively and significantly associated with each other.
Our first aim was to evaluate whether there were Black-White racial differences in
measures of functioning. To assess this, a one-way multivariate analysis of variance (MANOVA)
was conducted to compare Black and White Americans on the NC composite, SC composite,
SSPA total score, UPSA-B total score, and SLOF total score.
Our second aim was to assess the extent to which socioeconomic status (SES) indicators
may explain any observed relationships between race and functioning. Using the mediation
package for R (Tingley et al., 2014), race was entered as the predictor variable and any domains
that showed significant racial differences in Aim 1 were entered as dependent variables (each
34
The significance of indirect effects was tested using a bootstrap estimation approach with 10,000
samples.
Our third aim was to evaluate whether neurocognition, social cognition, social skills, and
everyday living skills predict community functioning comparably across Black and White
Americans. Moderation analyses were conducted to assess if the NC composite, SC composite,
SSPA total score, and UPSA-B total score (each modeled separately) predicted SLOF informant
scores comparably across Black and White individuals. Each predictor variable (e.g., NC
composite), the moderator variable (Black/White race), and the covariate (neighborhood SES)
were entered into the PROCESS macro for SPSS (Hayes, 2017) which automatically centered
the predictor and moderator variables and calculated the interaction terms. Moderation effects
were evaluated via statistically significant interaction effects and change in R2. Significant
interaction effects were probed via plots.
Results
Correlations between domains of functioning are presented in Table 2. As expected, all
five domains were strongly positively correlated with each other, ranging in strength from r =
.19 to r = .56.
Our first aim was to evaluate racial group differences on domains of functioning.
Multivariate tests indicated there were statistically significant differences across domains of
functioning based on race, F(5,136) = 9.33, p < .01, such that Black individuals scored lower
than their White counterparts. Univariate tests with a Bonferroni adjustment for multiple
comparisons revealed that there were significant differences on the NC composite F(1,140) =
35
23.27, p < .01. No racial group differences were found in community functioning (SLOF scores),
or social skills (SSPA scores).
Our second aim was to use mediation analyses to test the extent to which neighborhood
SES indicators may explain significant relationships between race and functioning. Three
separate sets of analyses were conducted with race as a predictor, neighborhood SES status as a
mediator, and each of the three variables that showed racial group differences as outcomes (i.e.,
NC composite, SC composite, and everyday living skills). Analyses showed that the relationship
between race and NC was mediated by neighborhood SES (see Figure 1). The bootstrapped
unstandardized indirect effect was .12, and the 95% confidence interval ranged from .23 to
-.03. Thus, the indirect effect was statistically significant. Based on the ratio of the indirect to the
total effect, neighborhood SES accounted for 21% of the relationship between race and NC. A
trend-level mediation effect (p = .09) for neighborhood SES was observed between race and SC,
but neighborhood SES did not significantly mediate the relationship between race and everyday
skills.
Our third aim was to evaluate whether neurocognition, social cognition, social skills, and
everyday living skills predict community functioning comparably across races. Results of
moderation analyses are presented in Table 3. Race did not significantly moderate the
relationship between NC, SC, UPSA-B, or SSPA scores and SLOF scores when covarying for
neighborhood SES.
Discussion
This study examined race in five domains of functioning known to be associated with
objective outcomes in schizophrenia. Results revealed that Black individuals had lower scores
36
composite index of neighborhood SES partially mediated the relationship between race and NC
performance, but not SC or everyday living skills. Lastly, race did not moderate the effects of
NC, SC, social skills, and everyday living skills on functional outcomes.
Our results parallel previous findings that Black Americans with schizophrenia obtain
lower scores on NC measures (Keefe et al., 2006; Nagendra et al., 2018; Sabbag et al., 2016).
However, this is one of the first known studies to explore factors that may contribute to racial
differences in NC performance. Based on our findings, neighborhood SES may explain about
one-fifth (21%) of the relationship between race and NC performance. The mediation effect of
neighborhood SES is consistent with prior research on nonclinical populations showing that
increased institutional resources in a neighborhood (e.g., community centers; Besser et al., 2017;
Clarke et al., 2012) can foster cognitive stimulation, which in turn may improve cognitive
performance (Clarke et al., 2012). Alternatively, it is possible that individuals with lower
cognitive abilities migrate to lower SES neighborhoods. This explanation would be consistent
with the social drift hypothesis of schizophrenia, which suggests that developing the illness is
associated with residence in increasingly lower SES neighborhoods (Sariaslan et al., 2016).
Longitudinal data would clarify the directionality of the relationship between neurocognition and
neighborhood SES in Black Americans with schizophrenia.
Even after considering individual education, and accounting for neighborhood income,
employment, and education, the majority of the relationship between race and NC remained
unexplained. Moreover, neighborhood SES did not mediate the relationship between race and SC
or everyday living skills. Thus, other race- and SES-related mechanisms likely underlie the
relationship between race and domains of functioning. On an individual level, racial and
37
schizophrenia. For example, higher levels of perceived racism in nonclinical Black participants
can deplete cognitive performance (Barnes et al., 2012; Richeson et al., 2005). Moreover,
experimentally-induced thoughts about finances may reduce cognitive performance in
lower-earning individuals (Mani et al., 2013). Additionally, research indicates that healthy Black
individuals may perform better on social cognitive tasks used in schizophrenia research when
they are tested by same-race experimenters (Nagendra et al., 2018) and that Black Americans
with schizophrenia may perform better on social cognitive tasks that include racially diverse
stimuli (Pinkham et al., 2017). Less research has examined the relationship between domains of
functioning and neighborhood quality. However, extant studies across a variety of racial/ethnic
groups have demonstrated that better psychological wellbeing is associated with increased
neighborhood social cohesion (Gapen et al., 2011; Hong et al., 2014) and racial/ethnic diversity
(Hong et al., 2014), as well as less urbanicity (Krabbendam & van Os, 2005). Consequently,
these may be valuable constructs to study when considering predictors of functional outcomes in
Black Americans.
Moderation analyses indicated that NC, SC, everyday living skills, and social skills
predict functional outcomes comparably in Black and White Americans. These findings highlight
the importance of understanding why Black Americans perform more poorly on social and
neurocognitive assessments (Brekke et al., 2005; Keefe et al., 2006; Nagendra et al., 2018;
Pinkham et al., 2017; Sabbag et al., 2016). If the lower cognitive scores of Black Americans are
not entirely due to bias or context effects during the assessment process (e.g., Nagendra et al.,
2018; Pinkham et al., 2008), it may be that an especially important treatment intervention for
Black Americans is cognitive remediation (Cella et al., 2017; Grant et al., 2017; Horan & Green,