*Correspondence to Author:
SANTOSH AGRAHARI
Associate Professor, Department of Electrical and Electronics Engineer-ing, Poornima University, Jaipur
How to cite this article:
PAR AG PUR ANIK, SANTOSH AGR AHARI, ASHISH PANAT. COMPARATIVE ANALYSIS OF CONTROLLED HEALTHY AND MCI PATIENTS USING EEG STA-TISTICS. American Journal of En-gineering Research and Reviews, 2020, 3:21
eSciPub LLC, Houston, TX USA. Website: https://escipub.com/
PARAG PURANIK et al., AJOERR, 2020, 3:21
American Journal of Engineering Research and Reviews
(ISSN:2637-3785)
Research Article AJOERR (2020) 3:21
COMPARATIVE ANALYSIS OF CONTROLLED HEALTHY AND MCI
PATIENTS USING EEG STATISTICS
This paper describes the statistical analysis of EEG signals. EEG examination is carried out and compared between controlled healthy and Mild cognitive impairment (MCI) patients which may further develop dementia or Alzheimer disease. The statistical techniques provide the comparative analysis of EEG signal. The correct evaluation of EEG provides the extraction of valuable in-formation which is important clinically. Also, extracting significant features from EEG is an important task for classification between various patients. The analysis of EEG data provides correct fre-quency rhythms. The relative Power spectral density values by Auto Regressive-Burg process cleared that; associated with the control group, the relative PSD is improved in the theta rhythmic range while expressively reduced in the alpha-2 rhythmic range.
Keywords: EEG analysis, Mild cogbitive impairment (MCI), EEG statistics, Power spectral Density (PSD), coherence analysis
PARAG PURANIK1, SANTOSH AGRAHARI2, ASHISH PANAT3
1Research Scholar, Department of Electrical and Electronics Engineering, Poornima University, Jaipur; 2Associate Professor, Department of Electrical and Electronics Engineering, Poornima University, Jaipur; 3Dean, Innovation and Incubation, SNDT Women’s University, Mumbai
ABSTRACT
INTRODUCTION
The correct evaluation of EEG provides the extraction of valuable information which is important clinically. Also, extracting significant features from EEG is an important task for classification between various patients. The standard analysis is to be used for proper automation and artifact free of EEG data. Since EEG is random signal its statistical analysis will provide correct information regarding patients, disease etc.
EEG statistical analysis is carried out using 16 channel RMS EEG machine. For EEG analysis technique, three set of judgements were suggested (Alzheimer Disease (AD) vs. controlled healthy, Mild Cognitive Impairment (MCI) vs. controlled healthy and MCI vs. AD) for the four EEG rhythms (alpha, delta, beta and theta) and for all sixteen channel electrodes. Hence, the entire amount of assessments were
192. QEEG analysis techniques is used to perform specifically for controlled healthy and MCI. [1][2]
The set of digital filters were used to differentiate EEG power and rhythms for analyzing the EEG indication into particular alpha, delta, theta and beta frequency ranges. These investigations produced the average regular power evaluations for each of the rhythms, at each of the 16-electrodes channel sites (16- channel bipolar montage) for individual member. EEG data for the controlled healthy, MCI and established AD groups were examined by executing preplanned assessments of normal power for respective channel within a given frequency band. A typical two-tailed t-test is to be used later to control statistical implication.[7][16].
The EEG data gathered and processed at NIMHANS, Bangalore and Shantiniketan Hospital, Nagpur for EEG analysis in which 30 patients were considered.
• The EEG recorded for first 10 minutes as a start and relaxing state.
• The ANGEL gaming test was performed and EEG was recorded for 45 minutes.
• The 30 minutes EEG noted during meditation.
• The chanting of mantra was conducted and then the EEG recorded for next 15 minutes
• Lastly relaxing for 10 minutes EEG recorded.
The total time of EEG recording was nearly 1.30 hrs.
Total 30 Subjects were studied for analysis in above steps. According to the medical analysis, Mini mental state examination (MMSE) was conducted for the subjects with the help of the doctor and score below 14 was treated as MCI positive. The MCI level also can be categorized into low, moderate and high. During EEG analysis, subjects were asked to chant the mantra i.e. OM and Gayatri mantra. First OM chanting was considered. During EEG analysis when ‘OM’ was chanted that time duration was noted, this is called event related potential (ERP). [5][8]
During chanting whether ‘OM’ was chanted properly or not, also correct time duration of ‘OM’ is noted or not and lastly what changes are noted during mantra chanting is to be investigated and therefore statistical analysis is carried out.
AJOERR: https://escipub.com/american-journal-of-engineering-research-and-reviews/ 3
I. METHODOLOGY
In this topic, the procedure for calculating the PSD of EEG data is explained. Also, the sample size required for the analysis, EEG recording method is discussed and finally the results are elaborated.
The block diagram of the MCI patients before and after chanting of mantras is shown in figure.1. In this technique, a procedure to calculate PSD and relative PSD is explained.
In figure.1 EEG signals are extracted for all 30 patients. Depending upon the EEG characteristics of EEG the patients are classified
as MCI and Controlled healthy with the help of the doctor. Then EEG preprocessing is performed. In EEG pre-processing specific duration EEG signals are extracted with the help of windowing techniques and low pass filtering. The correct information is extracted for further processing. The relative power spectral density and coherence analysis (t-test) is performed after EEG pre-processing. ANOVA analysis is carried out to differentiate between various patients for different EEG frequencies, by performing mantra chanting (‘OM’). EEG is verified before and after chanting of mantras for all patients by extracting relative power spectral density and combining PSDs of all patients. [9]
A. Calculation of Power Spectral Density (PSD)
The PSD (power spectrum density) estimation is performed. The electrodes namely, AF3, AF4, CP1, C3, Fp1, F3, F4, F7, FC1, FC5, FC6, F8, T7, CP5, P3, P7, PO4, Pz, P4, P8, PO3, O1, O2, Oz, C4, CP2, CP6, T8, FC2, Fp2, Fz and Cz channels are used for PSD estimation.
A linear phase FIR bandpass bypass clear filter of 1–35 Hz band is functional on EEG information to keep away from baseline itinerant and direct current (DC) bias and excessive frequency noise. The 2 artifact elimination techniques have been finished on the records. A modest top and inferior voltage thresholding became used to evade high voltages length and flat channel results (two hundred μV as top certain and 2μV as decrease sure). Second, independent component analysis is used for casting off eye blink and eye measure artefacts. Subsequently, the wiped clean EEG was similarly decimated to 64 Hertz. It has cleared from EEG/EMG waves that contribution to gamma rhythms recorded from head/ scalp electrodes, have omitted gamma activity in the processing. The initial rare samples had been rejected from the information to sidestep filter out transient effect on signal. PSD is predicted at extraordinary electrode places (average of electrode channels at frontal, crucial, occipital, parietal, left and right temporal regions) and for exceptional frequency band (theta range (3-7)Hz, alpha-1&2 [8-12)Hz and beta-1&2[13-30)Hz).This spectral evaluation achieved on statistics recorded during the chanting and post sittings.
Due to limited size of the EEG statistics, possible PSD is assessed using Auto Regressive Burg’s method (non-parametric method). Moreover, a sliding window Hamming technique is taken with a duration of 256 sampling frequency and overlay of 128-256 sampling issues to enhance the spectral values. Firstly, evaluation of the constraints of the version-primarily based approach from a facts series x(n), 0 < n < N - 1.
Next step is to compute the PSD envisioned from those estimations.
PSD evaluation is a non-parametric approach used to compute strength of EEG spectrum which is a frequency function i.e. EEG is proportional to brain frequencies, whilst preserving the constancy among flattening in time and frequency decision. PSD is envisioned the usage of the Bartlett technique, in which the periodograms are averaged for smooth PSD ensuing in better time and frequency decision. This is executed by way of separating the statistics series into non-overlapping orders by a Blackman and Harris window and adding the ensuing PSD calculated from Fourier Transform coefficients. x(n) is the signal, EEG statistics, separated into successive orders xk[n]; k =1,.. K,
each with duration ‘N’ and w(n) be the windowing feature.
The AR technique is created on demonstrating the data order x(n) because causal and discrete filter output is generated where the contribution is white Gaussian noise, that is voiced as given:
𝑥(𝑛) = − ∑ 𝑎(𝑘). 𝑥(𝑛 − 𝑘) + 𝜔(𝑛)
𝑝
𝑘=1
Where a(k) is A-R coefficients, 𝜔(𝑛) is white-noise whose variance is identical to standard deviation and p is the order of the Auto Regressive model.
With the help of A-R constraints by Burg algorithm, PSD is assessed as:
𝑃̂𝐵𝑈𝑅𝐺(𝑓) = 𝑒̂𝑝
|1 + ∑𝑝 𝑎̂𝑝(𝑘)𝑒−𝑗2𝜋𝑓𝑘
𝑘=1 |
ep is the least square error; p=16
The relative PSD for all frequency bands is calculated as follows:
𝑃𝑅𝑒𝑙𝑎𝑡𝑖𝑣𝑒 = ∑ 𝑃𝑖(𝑓)
𝑓2 𝑓=𝑓1
∑𝑓ℎ𝑓=𝑓𝑙𝑃𝑖(𝑓)
AJOERR: https://escipub.com/american-journal-of-engineering-research-and-reviews/ 5
B. Coherence Assessment
Coherence signifies the standardized co-variance of period sequence inside the frequency range area. Precisely,
Pxy (f) is the cross-power spectrum of EEG signal of specified duration.
C. Statistical analysis
The EEG is recorded using standard 10-20 system with 16 electrodes. The EEG is recorded before and after chanting of OM for MCI and controlled healthy group. When ‘OM’ is chanted that particular frequency is noted for all electrodes. The EEG has deviated or not that is
to be verified from all electrodes and therefore statistical analysis is carried out.
The PSD is calculated using AR-Burg’s technique for all 16 electrodes before and after mantra chanting for MCI and controlled healthy group. When ‘OM’ is chanted the event potential is created at each electrode. The power spectral density is calculated at that instance. The relative PSD becomes bulky for long duration of EEG signal and for the said two groups. Therefore, statistical analysis is used.
The Student's t-test is a broadly accepted parametric assessment to assess the variation among the average of two arbitrary variables, or amongst the average of one variable and one identified value (1-sample test). If the norms are accurate, the statistic surveys a Student's t-distribution.
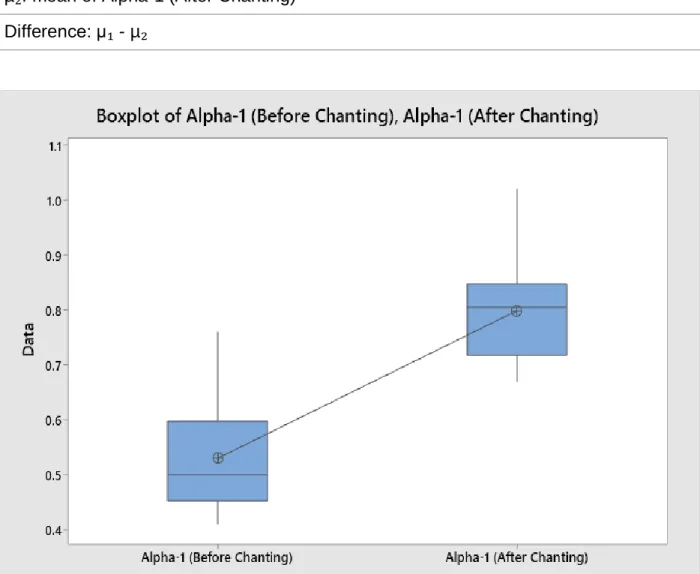
The standard 2-pair t-test is used for the comparison of various frequency ranges of EEG where mean value of alpha ranges is computed: (alpha is taken for explanation) is shown in figure 2.
1-way ANOVA examination is used for analyzing the average values of all electrodes for all 30 subjects. It has one independent variable i.e. PSD values before and after mantra chanting and one dependent variable i.e. electrodes (for both MCI and controlled group). ANOVA gives the details of following statistical parameters such as degree of freedom, sum of squares and mean square (MS=SS/ df) and p-value. The ‘p’ and ‘f’-value provides the high significance to
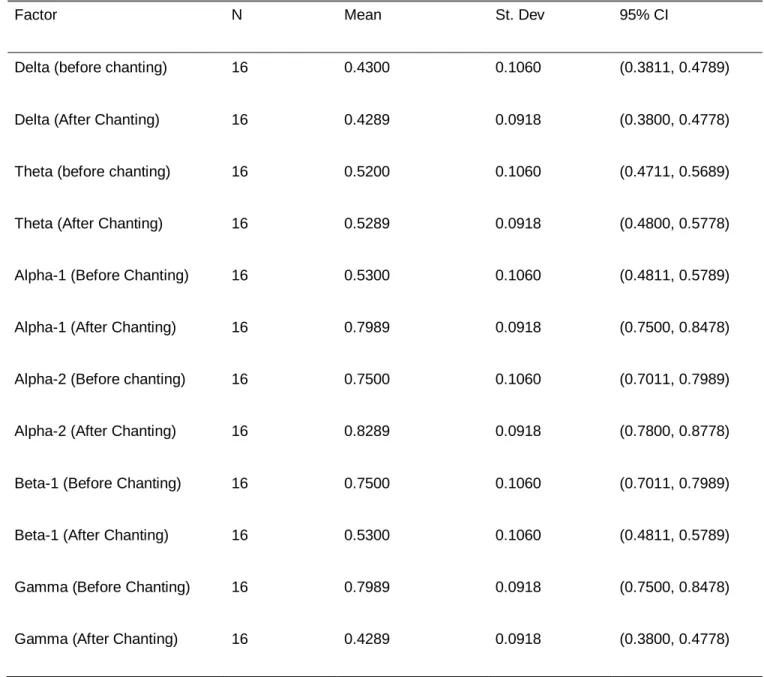
group difference. The following table 1 shows the mean values of all electrodes for different frequency ranges
Results
μ₁: mean of Alpha-1 (Before Chanting)
µ₂: mean of Alpha-1 (After Chanting)
Difference: μ₁ - µ₂
Identical variances not expected for this study
Valuation for Difference
Difference 95% CI for Difference
-0.2689 (-0.3406, -0.1973)
Test
Figure 2. – T-test details on Alpha-1 frequency
Null hypothesis H₀: μ₁ - µ₂ = 0
Alternative hypothesis H₁: μ₁ - µ₂ ≠ 0
T-Value DF P-Value
AJOERR: https://escipub.com/american-journal-of-engineering-research-and-reviews/ 7
TABLE I. MEAN VALUES OF ALL ELECTRODES FOR ALL EEG FREQUENCY BANDS
Factor N Mean St. Dev 95% CI
Delta (before chanting) 16 0.4300 0.1060 (0.3811, 0.4789)
Delta (After Chanting) 16 0.4289 0.0918 (0.3800, 0.4778)
Theta (before chanting) 16 0.5200 0.1060 (0.4711, 0.5689)
Theta (After Chanting) 16 0.5289 0.0918 (0.4800, 0.5778)
Alpha-1 (Before Chanting) 16 0.5300 0.1060 (0.4811, 0.5789)
Alpha-1 (After Chanting) 16 0.7989 0.0918 (0.7500, 0.8478)
Alpha-2 (Before chanting) 16 0.7500 0.1060 (0.7011, 0.7989)
Alpha-2 (After Chanting) 16 0.8289 0.0918 (0.7800, 0.8778)
Beta-1 (Before Chanting) 16 0.7500 0.1060 (0.7011, 0.7989)
Beta-1 (After Chanting) 16 0.5300 0.1060 (0.4811, 0.5789)
Gamma (Before Chanting) 16 0.7989 0.0918 (0.7500, 0.8478)
Gamma (After Chanting) 16 0.4289 0.0918 (0.3800, 0.4778)
For both groups MCI and controlled healthy, the relative PSD is reduced with rise in the frequency. Before chanting of ‘OM’ PSD range is in [0.25 0.7] and in gamma band relative PSD is in the range [0.0045 0.025]. The observation are as follows:
1. In delta and alpha-1 band, relative PSD variations are not there in some electrodes while in some electrodes F8, FP1 and FP2, delta frequency variations are seen and in electrodes O1, O2, P4 and C4 alpha-2 frequency variations are observed.
2. The relative PSD values before and after chanting for MCI group patients were much
on higher side than controlled healthy after mantra chanting in the theta frequency band.
3. In higher frequency bands, the PSD standards of MCI cluster are lesser than that of controlled healthy in parietal, temporal and occipital range.
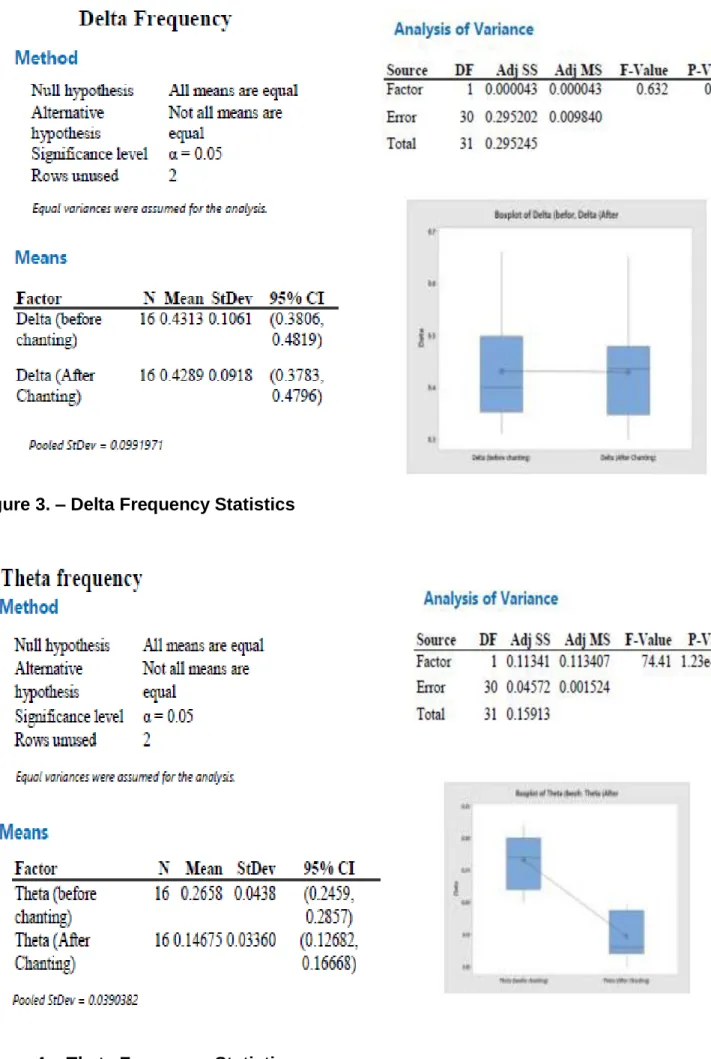
Figure 3. – Delta Frequency Statistics
AJOERR: https://escipub.com/american-journal-of-engineering-research-and-reviews/ 9
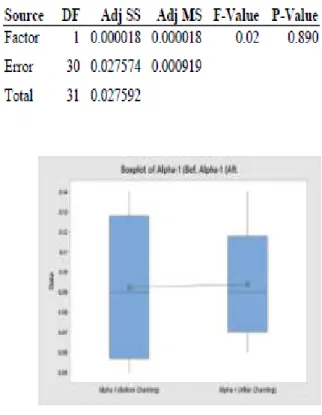
Figure 5. – Alpha-1 Frequency Statistics
In such a way, ANOVA analysis is done for all frequency bands and relative PSD is calculated for MCI group before mantra chanting and after
mantra chanting. The summary of ‘F’value and P-value is shown in the table below Table II
TABLE II. :ANOVA RESULTS FOR RELATIVE PSD OF SIX FREQUENCY RANGES OF MCI GROUP BEFORE AND AFTER CHANTING OF MANTRAS
EEG Rhythms F-value P-value
Delta 0.632 0.948
Theta 74.41 1.23e-004
Alpha-1 0.02 0.890
Alpha-2 37.73 1.002e-007
Beta 17.04 2.003e-005
After statistical corrections and calculations, it is revealed that the relative PSD value in theta and
delta range is enlarged and is reduced in case of other frequency bands.
Coherence results
Figure. 6: Topographic charts of the R-PSD in the alpha-2 rhythmic range for (a) MCI patients before chanting (b) MCI patient after chanting. Temporarily, the coherence values nearby useful influences built are exposed among the channels/ electrodes with high PSD values (relative) in crimson coloration: P3, P4, C3, C4, O1, O2, T5, and T6. A part in gray is occurred when the coherence value is more than 0.34
Figure.6 confirmed the topographic diagram of the R- PSD in the alpha-2 rhythmic range for MCI organization before and after mantra chanting. Temporarily, the practical connections based totally on coherence (grey hyperlinks in Fig. 6) have been inspected among the channels with excessive relative PSD values in purple colour: P3, P4, C3, C4, T5, T6, O1, and O2. It was located that, for both type of patients: CT and MCI, the channel with excessive PSD standards had extra neighbourhood practical influences. Furthermore, it is recommended that, for MCI patients, the nearby practical connections in parieto-occipital regions have been tons scarcer than that of the controlled cluster, representing that the high level, inclusive of data transmission and interactions, had been decreased significantly.
DISCUSSION
AJOERR: https://escipub.com/american-journal-of-engineering-research-and-reviews/ 11
(electrode-T6 and T5) and pre-frontal part (F8, F7) of the brain amid the MCI over the normal aging set and rise in frequency-beta rhythm, over the chronological parts among AD-MCI group. Also, a notable decrease in alpha range is obtained at the posterior and vital region (C4, Cz, C3).
The remark on MCI group exposed the prevalence posterior, reducing the alpha and beta frequency rhythm actions while the occipital pastime of the alpha and beta range is growing with the age. The results showed a prevalence circulation of theta and delta power or sluggish rhythms for each CT and the MCI.
CONCLUSION
The EEG statistics clearly differentiates between the patients i.e. controlled healthy and MCI. The coherence value depicts the changes in the alpha-1, alpha-2, delta and theta range. The delta rhythm is decreased on the pre-front areas for the regular and crucial areas which is probably connected to the cognitive weakening on the hippo-campal (occipital) place. Investigation found out statistically full-size slowing in EEG activity of the MCI category patients. Precisely, delta and theta frequency rhythms are increased at the left temporal and parietal locality (T5, T6) and prefrontal part (F8, F7) a number of the MCI over the healthful organization and boom in Both beta (1 and β-2) rhythms compared to the progressive (temporal) ranges between MCI category (before and after chanting of mantras). Besides, huge decrease in alpha rhythmic frequency on the valuable area (C4,C3,Cz) and at latter region takes place. The relative PSD valued by AR-Burg method cleared that; associated with the control group, the Relative Power Spectral Density is improved in the theta rhythmic range though expressively reduced in the alpha-2 rhythmic range. Also, coherence examination is functional to obtain the dissimilar electrodes in the alpha-2 range of frequency.
REFERENCES
1. Wang, R., Wang, J., Yu, H., Wei, X., Yang, C. and Deng, B. (2014), “Power spectral density and coherence analysis of Alzheimer’s EEG”, Cognitive Neurodynamics, Springer Journal 9(3), pp.291-304.
2. Asrul Adam Zuwairie Ibrahim Norrima Mokhtar, Mohd Ibrahim Shapiai, Paul Cumming, Marizan Mubin (2017), “Improving EEG signal peak detection using feature weight learning of a neural network with random weights for eye event-related applications.” Sadhana, Springer Journal, May 2017, Volume 42, Issue 5, pp 641–653
3. Zhu B, Chai C, Gao S, Ren H, Cao L, et al. (2017), “Analysis of EEG Complexity in Patients with Mild Cognitive Impairment” , J Neurol Disord 5: 354. doi:10.4172/2329-6895.1000354.4
4. Sonja Simpraga1, Ricardo Alvarez-Jimenez, Huibert D. Mansvelder, Joop M. A. van Gerven2, Geert Jan Groeneveld2,3, Simon-Shlomo Poil1,4 & Klaus Linkenkaer-Hansen, “EEG machine learning for accurate detection of cholinergic intervention and Alzheimer’s disease”, Scientific Reports | 7: 5775 | DOI:10.1038/s41598-017-06165-4.
5. Nesma Houmani1, Francois Vialatte, Esteve Gallego-Jutglà4, Ge´rard Dreyfus, Vi-Huong Nguyen-Michel, Jean Mariani, Kiyoka Kinugawa, “Diagnosis of Alzheimer’s disease with Electroencephalography in a differential framework”, PLOS ONE | https://doi.org/10.1371/journal.pone.0193607, pp.- 1-19, 2018.
6. Poil S-S, WillemdeHaan, WiesjeM.vanderFlier, HuibertD.Mansvelder, Philip Scheltens and KlausLinkenkaer-Hansen, “Integrative EEG biomarkers predict progression to Alzheimer’s disease at the MCIstage”, Frontiers in Aging Neuroscience, March 2014, Volume05, Article-58.
7. Fauzan N, Amran N.H, “Early Detection of Mild Cognitive Impairment, Dementia and Alzheimer’s Using Qeeg”, European Journal of Interdisciplinary studies, Sep-Dec 2015, Volume-3, Number-1, ISSN:2411-958X (Print).
8. Horvath A, Szucs A, Csukly G, “ EEG and ERP Biomarkers of Alzheimer’s Disease: A Critical Review”, Frontiers in Bioscience, Landmark 23, 183-220, January 2018.
ONE | DOI:10.1371/journal.pone.0141281 October 28, 2015.
10. Braboszcz C, B. Rael Cahn, Levy J, Fernandez M, Delorme A, “Increased Gamma Brainwave Amplitude Compared to Control in Three Different Meditation Traditions”, PLOS ONE | DOI:10.1371/journal.pone.0170647 January 24, 2017.
11. Banquet J P, Sailhan M, “Quantified EEG Spectral Analysis of sleep and Transcendental Meditation”, Second European Congress on Sleep Research, Rome, Italy, 10 April 1974.
12. Lomas, T., et al., A systematic review of the neurophysiology of mindfulness on EEG oscillations. Neurosci. Biobehav. Rev. (2015), http://dx.doi.org/10.1016/j.neubiorev.2015.09.018 .
13. Ferreri F, SaraM, Fabrizio Vecchio, Giuseppe Curcio, and Fabio Ferrarelli, “Clinical Neurophysiology in Alzheimer’s Disease”, International Journal of Alzheimer’s Disease, Volume 2011, Article ID 134157, 2 pages doi:10.4061/2011/134157
14. Alexandra K, Aharon Satt, “Automatic speech analysis for the assessment of patients with predementia and Alzheimer’s disease”. Alzheimer’s & Dementia: Diagnosis, Assessment & Disease Monitoring 1 (2015) 112–124.
15. Emanuel Neto, Elena A. Allen, Harald Aurlien, Helge Nordby and Tom Eichele, “EEG spectral features discriminate between Alzheimer’s and vascular dementia”, Frontiers in Neurology, February 2015 | Volume 6 | Article 25.
16. Doufesh H, Faisal T, Lim K, “EEG Spectral Analysis on Muslim Prayers”, Article in Applied Psychophysiology and Biofeedback · October 2011 DOI: 10.1007/s10484-011-9170-1 · Source: PubMed.
17. Diego Alfonso Rojas, Leonardo Andrés Góngora and Olga Lucia Ramos, “EEG Signal Analysis Related to Speech Process Through BCI EMOTIV, FFT and Statistical methods”, ARPN Journal of Engineering and Applied Sciences, VOL. 11, NO. 5, March 2016 ISSN 1819-6608.
18. Roberta Lizio, Fabrizio Vecchio, Giovanni B. Frisoni, Raffaele Ferri, Guido Rodriguez,5 and Claudio Babiloni6, International Journal of Alzheimer’s Disease Volume 2011, Article ID 927573, 11 pages doi:10.4061/2011/927573.
19. Alida A. Gouw1,2 and Cornelis J. Stam, “Electroencephalography in the Differential
Diagnosis of Dementia”, Epileptologie 2016, pp.-173-186.
20. Amjed S. Al-Fhoum and Ausilah A. Al-Fraihat, “Methods of EEG Signal Features Extraction Using Linear Aalysis in Frequency and Time-Frequency Domains”, Hindawi Publishing Corporation ISRN Neuroscience Volume 2014, Article ID 730218
21. Anthoula Tsolaki, Dimitrios Kazis, Ioannis Kompatsiaris, “Electroencephalogram and Alzheimer’s Disease: Clinical and Research Approaches”, Hindawi Publishing Corporation International Journal of Alzheimer’s Disease”, Volume 2014, Article ID 349249
22. Davide V. Moretti, “Neurophysiology in Alzheimer’s Disease and Dementia”, EDITORIAL published: 27June2016, Frontiers in Aging Neuroscience.
23. Gregg D. Jacobs, Richard Friedman, “EEG Spectral Analysis of Relaxation Techniques”, Applied Psychophysiology and Biofeedback, Vol. 29, No. 4, December 2004.
24. G.Fiscon, E.Weitschek, P.Bertolazzi, G.Felici, S.De Salvo, P.Bramanti, MC.De Cola, “Alzheimer’s disease patients classification through EEG signals processing”, The IEEE SSCI 2014, Orlando, Florida 9–12 December, 2014.
25. Laura Bonanni, Astrid Thomas, PietroTiraboschi, Bernardo Perfetti, "EEG comparisons in early Alzheimer’s disease, dementia with Lewy bodies and Parkinson’s disease with dementia patients with a 2-year follow-up”, Brain Journal (2008), 131, 690-705
26. Noor Kamal Al-Qazzaz,Sawal Hamid BinMD. Ali, Siti Anom Ahmad, “Role of EEG as Biomarker in the Early Detection and Classification of Dementia”, Hindawi Publishing Corporation, Scientific World Journal, Volume 2014, Article ID 906038, pp.1-16, December 2014.
27. Prof. Shamla Mantri,Vipul Patil, Rachana Mitkar, “ EEG Based Emotional Distress Analysis – A Survey”, International Journal of Engineering Research and Development e-ISSN: 2278-067X, p-ISSN: 2278-800X, www.ijerd.com Volume 4, Issue 6 (October 2012), PP. 24-28.
AJOERR: https://escipub.com/american-journal-of-engineering-research-and-reviews/ 13 29. Ssang-Hee Seo and Jung-Tae Lee, “Stress and
EEG”, Convergence and Hybrid Information Technologies, Book edited by: Marius Crisan, ISBN 978-953-307-068-1, pp. 426, March 2010, INTECH, Croatia
30. Vanitha V, Krishnan P, “Real time stress detection system based on EEG signals”, Biomedical Research 2016; Special Issue: S271-S275.
31. Punnet Mongia, R.K. Sharma“Estimation and Statistical Analysis of Human VoiceParameters to
Investigate the Influence of Psychological Stress and to Determine the VocalTract Transfer Function of an Individual”, Journal of Computer Networks and Communications, vol. 2014, pp.-1-18.
32. S-E.Fotinea, S.Bakamidis, T.Athanaselis, I.Dologlou, “Emotion in Speech: towards anintegration of linguistic, paralinguistic and psychological analysis, Proceedings of IEEE 2013.
AUTHORS PROFILE
Parag Puranik Research Scholar, Department of ECE, Poornima University, Jaipur, IEEE Member and Technical program committee member IEEE Signal Processing Society, Pursuing Research in EEG signal Processing, one copyright published. Completed M.Tech in Electronics Engineering from Nagpur University in 2009, has 15 years of teaching experience. The research interest includes signal Processing, biomedical (EEG) signal processing and statistical analysis.
Dr. Santosh Kumar Agrahari works as an Associate Professor, Department of Electronics & Communication Engineering, Poornima University. He has published more than 25 research papers in International Journals and Conferences. Currently he is supervising 6 candidates for their Ph.D. He has more than 17 years of experience in research and teaching and also one-year industry experience.