http://www.sciencepublishinggroup.com/j/ajomis doi: 10.11648/j.ajomis.20180303.11
ISSN: 2578-8302 (Print); ISSN: 2578-8310 (Online)
Quick Cost Estimation of Expressway Routine Maintenance
Based on Historical Data
Shi Xiaoli
1, Zhang Ming
1, Wang Feng
2, Zhang Ping
21
School of Highway, Chang'an University, Xi ̓an, China 2
Shanxi Provincial Communication Construction, Xi ̓an, China
Email address:
To cite this article:
Shi Xiaoli, Zhang Ming, Wang Feng, Zhang Ping. Quick Cost Estimation of Expressway Routine Maintenance Based on Historical Data.
American Journal of Operations Management and Information Systems. Vol. 3, No. 3, 2018, pp. 66-73. doi: 10.11648/j.ajomis.20180303.11 Received: September 26, 2018; Accepted: October 23, 2018; Published: November 12, 2018
Abstract:
At present, costs of expressway routine maintenance are mainly estimated by calculations of the total costs of the maintenance activities of all structures including subgrades, pavements, bridges and culverts, tunnels and traffic facilities. In this method, engineering quantities of various maintaining activities are calculated in advance and then they are multiplied by the unit prices of each maintaining activity respectively in order to get the total costs. Considering the difficulty in accurately estimating the repairing quantity while calculating the costs of expressway routine maintenance, the paper deeply explores identified historical data of the costs of expressway routine maintenance by an improved Bootstrap method. Conclusion is drawn on the annual cost interval per lane kilometer of the routine maintenance of subgrades, pavements, bridges and culverts, tunnels and traffic facilities on expressways of Shaanxi Province as well as the proportion intervals of structures mentioned above. An efficient method by which calculations and evaluations are based on cost intervals and proportion intervals respectively is raised to estimate the engineering costs of expressway routine maintenance. The method is proved to be a new reliable and accurate one to estimate the costs of expressway routine maintenance as it efficiently calculates the engineering costs in real-life projects.Keywords:
Expressway, Routine Maintenance, Improved Bootstrap Method, Annual Costs Per Lane Kilometer, Quick Cost Estimation1. Introduction
The cost estimation is a key point in the market operation of expressway maintenance, and its accuracy and timeliness is the basis of a scientific investment plan of expressway maintenance. At present, costs of expressway routine maintenance are mainly estimated by calculations of the total costs of the maintenance activities of all structures based on the maintenance budget costs. In this method, engineering quantities of various maintaining activities are calculated in advance and then they are multiplied by the unit prices respectively in order to get the total costs. As a large number of maintaining activities exist in the expressway routine maintenance, expressway maintaining investment decisions should be made three years even five years in advance. By the common method, one should predict engineering quantity of every activity year by year. A mature model, however, has never been built in China to calculate it [1-8]. Only statements of prediction of the pavement maintenance, but no subgrades,
quantity which will be of certain practical significance in the future newly built highway maintenance investment plan after scientific analysis.
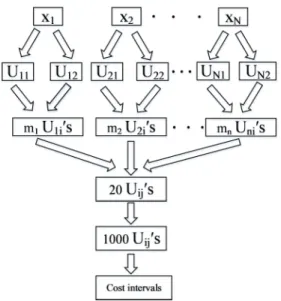
In this paper, the author is devoted to altering the analyzing methods and models of estimating expressway routine maintenance by data analysis. The author collected data of the costs of the annual routine maintenance of twenty expressways in Shaanxi Province since they were open for use, divided them into two groups, namely Shanbei area and Shannan-Guanzhong area, and analyzed costs of routine maintenance of subgrades, pavements, bridges, culverts, tunnels and traffic facilities by the improved Bootstrap Method to get the daily cleaning cost intervals of all structures in the first and second years, routine maintenance costs in the third to ninth years as well as the proportion of costs of routine maintenance of every structure in the two regions. The decision makers can quickly estimate the investment amount of the routine maintenance for future newly built expressways by the data of cost intervals and evaluate the rationality of the estimation by the costs proportion.
2. Pre-Management of Data
(1) Pre-management of historical data
Although maintenance level, road age, traffic volume and traffic composition, and natural environment may affect the deterioration condition and maintenance costs [20], they are determined only by road age and size of the structure once they are in the same region and under the management of the same maintenance agency [18]. As a result, these two factors are supposed to be identified, that is to say:
1. Costs of expressway routine maintenance can be divided into daily cleaning and routine maintenance engineering. Daily cleaning costs include subgrades, pavement, bridges and culverts, tunnels and traffic facilities. Routine maintenance engineering costs include costs of the maintenance of subgrades, pavements, bridges and culverts, tunnels and traffic facilities.
2. The first two years since the opening of an expressway is set to be the warranty period, during which the management agency pays only the daily cleaning costs. So data of the first and second years include only daily cleaning costs in the analysis and the data of the other years is maintenance engineering costs.
3. In order to eliminate the influence of different sizes of structures on the costs, costs of maintaining different structures are transferred into costs per lane kilometer
ijt
C and its proportion Pijt by formula (1) and (2).Cijt
and Pijt are the two analyzing indexes of this paper:
ijt ijt ik ijk TC C n L =
⋅ (1)
100% ijt ijt it TC P TC
= × (2)
In the formulas, TCijt refers to daily cleaning costs or routine maintenance engineering costs of structure j on expressway i in year t (yuan)
ik
n ―refers to number of lanes k on expressway i
ijk
L ―refers to the length of lane k in structure j on expressway i (kilometer)
it
TC ―refers to total costs of cleaning or maintenance engineering in year t on expressway i (yuan)
4. In order to eliminate the influence of factors like labor, materials and machine price, cost data of maintenance in different years is transferred into the cost of the standard year (year 2015) by the price index [13], namely TCijt is the cost of daily cleaning cost or routine maintenance engineering cost of the standard year.
5. As expressways in the survey are opened in different years, time of opening is transferred into road age in the analysis and data with the same road age in the same region are seen as a group of sample.
6. While analyzing the data, abnormal data are removed according the Dixon Criterion [14].
(2) Rationality for analyzing historical data
Once an expressway is completed, it is like a machine consists of components like subgrades, pavements, bridges, culverts, tunnels and traffic facilities. Maintenance of these components is of great importance to the high working efficiency of the machine. The data recorded during the routine maintenance reflect the condition of the components and provide evidence for decision making in expressway medium and heavy maintenance.
Figure 1. Data analyzing framework.
3. Analyzing Methods
Maintenance data of ten expressways from Shanbei area and Guanzhong-Shannan area is analyzed. Bootstrap Method [16] is adopted in this paper to estimate the sample intervals because costs of expressway routine maintenance opened in the same year are discrete and it is hard to find a distribution function for them.
1. Main idea of the Bootstrap Method[17]
Main idea of the Bootstrap Method is drawing samples in the original samples and putting them back. Suppose there are
n samples, the probability of each sample being drawn is 1n. In this method, the original samples are seen as a whole and the subsamples are seen as samples called Bootstrap samples. The calculation of Bootstrap samples is repeated N times to get N observed values. In this way, the distribution of the samples can be got. Due to the lack of distribution density formula, the confidence interval is fixed by percentiles [19]. This method depends only on the given observational information rather than other hypothesis and is suitable when samples are insufficient.
Because of the deficiency of the Bootstrap Method[17], the improved Bootstrap Method is applied in this paper which is shown in Figure 2:
Figure 2. The improved Bootstrap Method.
The improved Bootstrap Method works in the following way: Step1: Identified CijtorPijtis sorted from small to large and are recorded as x x1, 2,x3⋅⋅⋅xn . They are calculated by the
following formula to get U1, U2⋅⋅⋅UN, (U refers to an interval);
1 [x1 (x2 x ) / 2, x1 1 (x2 x ) / 2]1
U = − − + − (3)
i i i 1 i i 1 i [x (x x ) / 2, x (x x ) / 2]
i
U = − − − + + − (
i
= ⋅⋅⋅
2
,
,
N
−
1
) (4)N N N-1 N N N-1 =[x -(x -x ) / 2,x +(x -x ) / 2]
N
U (5)
Step 2: Randomly draw mi samples from every Ui by
random number generator in excel,twenty samples in total
(m1+m2+ ⋅⋅⋅ +mN =20,i=1, 2,⋅⋅⋅N );
by percentiles.
In this paper, the procedure above is conducted by the Bootstrap Method in SPSS and the costs as well as proportion
intervals with confidence interval of 95% is shown in table 1-5.
Table 1. Annual routine maintenance cost intervals (yuan / lane⋅kilometer) and proportion intervals (%) of subgrades.
Road age Region 1 2 3 4 5 6 7 8 9
Guanzhong-Shannan Lower limit 365 (11) 534 (4) 943 (9) 878 (15) 1167 (17) 1235 (9) 1351 (5) 1543 (6) 1350 (7) Upper limit 595 (15) 998 (9) 1246 (14) 1260 (27) 1881 (33) 1962 (12) 2070 (10) 2129 (11) 2041 (10)
Shanbei Lower limit 1046 (11) 1073 (13) 1256 (13) 2757 (11) 2014 (12) 618 (9) 757 (8) 631 (7) 733 (9) Upper limit 1493 (15) 1177 (17) 2262 (20) 3383 (16) 2936 (26) 934 (11) 1091 (10) 740 (8) 938 (12)
Table 2. Annual routine maintenance cost intervals (yuan / lane⋅kilometer) and proportion intervals (%) of pavements.
Road age Region 1 2 3 4 5 6 7 8 9
Guanzhong-Shannan Lower limit 932 (36) (46) 1830 (33) 2718 (30) 2754 (30) 5903 (26) 6449 (34) 4671 (45) 6208 (42) Upper limit 1245 (53) (60) 2521 (44) 4162 (39) 4674 (46) 6886 (59) 8189 (47) 5546 8902
Shanbei Lower limit 1278 (43) 1036 (32) 2499 (27) 2095 (28) 2089 (27) 2404 (30) 3322 (33) 5239 (61) 4735 (52) Upper limit 1866 (54) 1686 (42) 3392 (50) 3310 (44) 3199 (38) 4008 (45) 5208 (53) 5699 (66) 5242 (61)
Table 3. Annual routine maintenance cost intervals (yuan / lane⋅kilometer) and proportion intervals (%) of bridges and culverts.
Road age Region 1 2 3 4 5 6 7 8 9
Guanzhong-Shannan Lower limit 461 (10) 1182 (13) 1438 (6) 1505 (11) 3171 (13) 3790 (13) 3501 (12) 3268 (5) (9) Upper limit 600 (13) 1793 (15) 184 (10) 2028 (17) 3547 (20) 4099 (19) 3992 (17) 3760 (8) (13)
Shanbei Lower limit 1824 (11) 1348 (10) (7) (7) — — — — —
Upper limit 1902 (16) 1637 (15) (10) (10) — — — — —
Table 4. Annual routine maintenance cost intervals (yuan / lane⋅kilometer) and proportion intervals (%) of bridges and tunnels.
Road age Region 1 2 3 4 5 6 7 8 9
Guanzhong-Shannan Lower limit 1128 (8) 2438 (4) 2017 (8) 2954 (8) 3044 (11) 5892 (7) 4639 (8) (9) — Upper limit 1472 (12) 2975 (10) 2516 (12) 3621 (11) 4006 (15) 7133 (9) 5081 (10) (12) —
Shanbei Lower limit 2079 1374 (15) (6) (7) — — — — —
Upper limit 2675 2332 (21) (10) (10) — — — — —
Table 5. Annual routine maintenance cost intervals (yuan / lane⋅kilometer) and proportion intervals (%) of bridges and traffic facilities.
Road age Region 1 2 3 4 5 6 7 8 9
Guanzhong-Shannan Lower limit 204 (9) (9) 1839 (36) 1239 (12) 1924 (16) 1658 (25) 2843 (32) 2267 (20) 2244 (26) Upper limit 272 (15) (11) 2476 (50) 1937 (29) 2637 (27) 2246 (40) 3274 (41) 2492 (35) 3268 (32)
Shanbei Lower limit 655 (19) 737 (22) 1393 (27) 1365 (32) 2642 (25) 2152 (30) 3032 (21) 1352 (17) 1410 (15) Upper limit 1015 (22) 1003 (30) 2637 (45) 1863 (49) 4012 (39) 2844 (39) 3313 (30) 1942 (24) 1914 (20)
In the charts, numbers outside of the brackets are annual costs per lane kilometer of the structures; numbers inside of the brackets are the percentages of expressway routine maintenance costs of each structure. “—” means the missing
data which is because data from some years are so dispersed that they are not enough for a Bootstrap analysis after removing abnormal ones.
4. Analysis of Results
(1) Analysis of the cost intervals of each structure
Based on the annual upper and lower costs per lane kilometer of structures, it can be seen from table 1-5 that:
1. Cost intervals show an increasing tendency in the nine years since the opening of the expressways. The
influence from vehicles, climate and environment resulted in the increase of costs.
2. The largest interval of pavement routine maintenance is [6208, 8902], length of which is 2694 yuan. The largest interval of other structures is [5892, 7133] with a length of 1241 yuan, which is because pavement is directly affected by vehicles. Even in the same region, traffic volume and components show differences on different expressways, thus different damages are imposed on the pavements, which result in the long interval.
higher cleaning frequency. Working quantity of daily cleaning on traffic facilities is fixed, so the costs seldom change.
4. In the third to ninth year since a expressway is opened, costs of pavement is the highest and that on subgrades is the lowest. That is because compared to subgrades, pavements are directed affected by vehicle loads. As a result, they need frequent repair on the holes and cracks, especially in the regions with heavy rainfall.
(2) Analysis of the proportion intervals of each structure Based on the annual upper and lower proportion intervals of structures, it can be seen from table 1-5 that:
1. After an expressway is opened, costs of the maintenance on pavements shows the highest proportion and that of the traffic facility is the second highest. Proportions of bridges and culverts, tunnels and subgrades are similar. As is seen in formula (2), while costs proportions are calculated, length of structures determines the proportion; annual costs per lane kilometer has slight influence on the result. Length of the pavements on the twenty expressways mentioned in this paper is larger than that of other structures.
2. Length of the proportion intervals are affected by that of the cost intervals. When the cost intervals are large, proportion intervals show the same tendency.
3. Costs proportions also reflect the maintenance urgency of each structure. When repairing budget is not enough, different structures should be sequenced according to their urgency.
(3) Application of results
The result can be applied in the estimation of expressway routine maintenance costs and the evaluation of estimation accuracy, that is:
1. While estimating expressway routine maintenance costs, the costs of each structure according to the cost intervals should be calculated first and then collect the data to calculate the total costs.
2. To evaluate the accuracy of the estimation, if the costs of every structure is reasonable by the proportion intervals should be judged. If a certain structure costs 10% beyond the upper or lower limit, the annual costs per lane kilometer should be adjusted to maintain the costs in a reasonable interval.
3. When a maintenance investment is being planned, routine maintenance costs should be estimated according to the investment. In case of data absence, data from neighboring region and year can serve as references; cost intervals and proportion intervals can also be used to evaluate the completed projects.
5. Sample Verification
In order to make a comparison with real routine maintenance costs, the calculation results have been transferred from table 1 to table 5 into TCijt,TCit and Pjt by formula (1) and (2). In the comparative analysis, fractional
error
δ
(seen in formula 6) is used to represent the deviation level of the real value and the estimated one.100%
Rij Ejt
Rjt TC TC
TC
δ
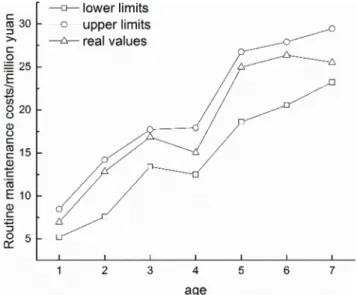
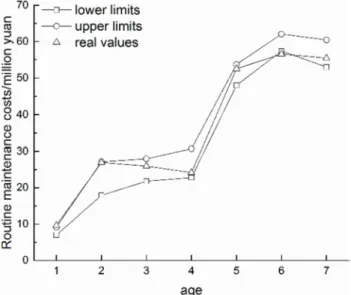
= − × (6)The Shangman Expressway (4 lanes) which was opened in 2009 is chosen to complete the verification in the paper. Length of the structures are: subgrades 35.562km, pavements 94.502km, bridges and culverts 37.85km, tunnels 21.09km, traffic facilities 94.502km. Routine maintenance costs of each structure is transferred into a real value according the price index. Routine maintenance costs are calculated by substituting interval data in table 1-5 into formula 1 and 2. Comparison between the real values and estimated ones is shown in Figure 3 to 7.
Figure 3. Comparison between real routine maintenance costs on subgrades and estimated ones.
Figure 5. Comparison between real routine maintenance costs on bridges and culverts and estimated ones.
Figure 6. Comparison between real routine maintenance costs on tunnels and estimated ones.
Figure 7. Comparison between real routine maintenance costs on traffic facilities and estimated ones.
1. The first two years since the opening of an expressway is set to be the warranty period, during which the management agency usually pays only the daily cleaning costs. However, in real engineering some routine maintenance costs may occur, which leads to an increasing tendency in the costs of the first two years. 2. The real values are all between the upper and lower
limits of the estimated intervals, showing that the costs estimation is accurate and reasonable. In Figure 3 the fractional error of the first year is 8.8%, and that of the second year is 7.0%; in Figure 5 the fractional error of the first year is 5.9%, and that of the sixth year is 1.4%; in Figure 7 the fractional error of the first year is 4.4%, and that of the third year is 1.0%. All of them are below 10%, which means they are acceptable.
3. In Figure 5, routine maintenance costs of bridges and culverts show an evident increase in the fifth year, which is due to the fact that the managing agency began to update components such as bridge expansion joints. 4. In Figure 6, routine maintenance costs of tunnels show a
decrease tendency in the seventh year, which is because of the influence of high investment in the last year. 5. In Figure 7, routine maintenance costs of traffic facility
show a waving tendency, which is also the result of high investment in the adjacent year.
6. Due to the fact that cost proportions are greatly influenced by costs of each structure, it makes no sense to analyze them in figures, which are not presented in this paper but data shows that real routine maintenance costs proportions are within the predicted intervals.
6. Conclusion
In this paper, through the analysis and research of the existing prediction of Expressway routine maintenance quantity and cost method at home and abroad, to establish a rapid estimation method of expressway maintenance cost. This paper uses the improved Bootstrap method for deep excavation of expressway maintenance engineering historical data. The interval of Expressway in Shaanxi Province, different structures of annual repair project cost interval and different structure maintenance engineering cost accounting for the total proportion of the entire highway maintenance cost. These structures include subgrade, pavement, bridges and culverts, tunnels and traffic facilities. This method makes the estimation of expressway maintenance cost more scientific and precise. The engineering examples show that this method for the estimation of expressway maintenance cost is reasonable.
Acknowledgements
This research was supported by the Fundamental Research Funds for the Central Universities (no.300102218112), Shaanxi Provincial Communications Group Corporation (no.16-16k) and Transportation Research Project of Shaanxi Provincial Transport Department (no.16-34k). The authors are grateful for the assistance provided by branch staffs of Shaanxi Provincial Communications Group Corporation in obtaining the data used in this research.
References
[1] Zhen Feng, Jiang Hongyan. Cost Analysis and Prediction for Maintenance Projects [J]. Journal of Highway and Transporttation Research and Development. 2010, 8 (4):1-4. [2] Cui Ruichao. Application Research of Henan expressway
pavement maintenance rate [D]. Beijing University of Technology Master ′s degree thesis, 2008.
[3] Ma Fujun. The highway curing management and construction unit model and its norm cost control in market-oriented mode [D]. Shangdong University Master ′s degree thesis, 2008. [4] Pan Fang. Study on the quota budget and reasonable cost of
Asphalt Pavement Highway Project routine maintenance in Chongqing [D]. Chang ̓An University Master ′s degree thesis, 2010.
[5] Qi Yunsheng. Study on the Budget Quota and Expenses Standard of Highway daily Maintenance and Engineering [D]. Chang ̓An University Master ′s degree thesis, 2010.
[6] Teng Weiling, Yao Yuling. Expressway minor maintenance amount predication based on neural network [J]. Journal of Chang ̓an University (Natural Science Edition), 2012, 32 (6):23-27.
[7] Yu meter [2006] 330 number. Interim Provisions on the Expenses Standard of Highway Maintenance Engineering in Henan Province. Henan Provincial Department of Transportation, 2006.
[8] Kong Xiangjie, Cui Yaping. Analysis on Maintenance Capital Chaeacteristics of the Expre-ssway in Beijing [J]. Journal of Highway and Transporttation Research and Development. 2008, 25 (4):322-325.
[9] Hagood, M. (2014). “Highway Rountine Maintenance Cost Estimation for Nevada.” Ph.D. Thesis, University of Nevada, Las Vegas, Nevada.
[10] Gibby, R., Kitamura, R., Zhao, H. (1990) Evaluation of truck Impacts on Pavement Maintenance Costs. Transportation Research Record. 1262, 48-56.
[11] Volovski M. (2011). Econometric Models for Pavement Routine Maintenance Expenditure. Mid-Continent Transportation Research Symposium, Ames, Iowa. Purdue University, West Lafayette, Indiana.
[12] Sebaaly, P. E., Venukanthen, S., Siddharthan, R., Hand, A., and Epps, J. (2000). Development of Pavement Network Optimization System. Research Report No. 1198-1, Report to Nevada Department of Transportation, Carson City, NV.
[13] Zhang Xiaoguang etc. Shannxi Statistical Yearbook [M]. China Statistics Press. 2000-201-5.
[14] Fei Yetai. Theory of Error and Data Processing [M]. China Machine Press. 2010.
[15] Meng Xiaofeng and CiXiang. Big Data Management: Concepts, Techniques and Challenges [J]. Journal of Computer Research and Development. 2013, 50 (1):146-156.
[16] Liu Jian. An Improvement to the resampling procedure of Bootstrap Method [J]. Mathema-tical Theory and Applications. 2006, 26 (1):2-4.
[17] Zhang Ping. Statistical Analysis Based on Bootstrap Method [J]. Journal of Yibin University. 2011, 11 (12):1-2.
[18] Dong Cheng, Liu Wen-jie, Zhou Lun, Zhang Rui-lei, Kan Qian-hua, Leng Wu-ming, Evaluation on Fatigue Life of Expressway Asphalt Pavement Based on Tire-Pavement-Subgrade Coupling Model, American Journal of Civil Engineering. Vol. 5, No. 6, 2017, pp. 400-407. [19] Ahmed Yousry Akal, Ahmed Ebrahim Abu El-Maaty, Fuzzy
Assessment of Factors Influencing Quality Level of Highway Projects, International Journal of Management and Fuzzy Systems. Vol. 2, No. 2, 2016, pp. 6-14.
[20] Congliang. Research on Estimation Model of Highway Asphalt Pavement Maintenance Cost Based on Target Maintenance Cycle. Master dissertation, Dept. of Transport Engineering, Chongqing Jiaotong University, Chongqing. W. (2016). [21] Jahanbakhsh, S., Gao, L. and Zhang. Estimating Spatial
Dependence Associated with Deterioration Process of Road Network. 95th Annual Meeting Compendium of Papers, Transportation Research Board. Washington, DC. Z. (2016). [22] Qiu. Quantitative research and statistical analysis, Chongqing
University Press, Chongqing, H. (2015).
Biography
Shi Xiaoli, Ph.D., associated professor, masters' supervisor at the school of Highway, Chang'an University, with research focus on road economy and management
Wang Feng, senior engineer, assistant general manager, Shaanxi Provincial Communication Construction, with research focus on highway maintenance