VOLUME 16 ISSUE 2 (2018), Page 99 - 108
HOUSING AND TRANSPORT EXPENDITURE:
AN ASSESSMENT OF LOCATION HOUSING AFFORDABILITY
M. Azren Hassan1, Hazlina Hamdan2, Jamalunlaili Abdullah3,& Yusfida Ayu Abdullah4
1,2,3,4Faculty of Architecture, Planning and Surveying
UNIVERSITI TEKNOLOGI MARA MALAYSIA
Abstract
In every country, the ability to own a house is vital for the housing market. During the past five years, housing prices in the urban area in Malaysia are becoming severely unaffordable. Housing affordability ensures that housing provided is affordable for every income groups, especially the low and middle income group. The measurement of housing affordability uses household income and housing cost but disregards transportation expenditure which is a substantial amount of household expenditure. Location of housing influences transportation expenditure. The research determines the Location Housing Affordability for the low and middle income group in an urban area. This study quantitatively examines Putra Height as one of the mature residential neighbourhoods in Selangor as well as due to the availability of public transit in the area. Housing affordability and transportation affordability create an integrated Location Housing Affordability Index. Data analysis utilizes the measurement of Location Housing Affordability Index. The findings showed that Location Housing Affordability Index recognizes location as influential factor to housing affordability of 179 respondents from low and middle income group. The findings also suggested that the houses in the urban area were seriously unaffordable for the low and middle income groups. The contribution of the research is the emphasis on location as a part of housing affordability measurement.
INTRODUCTION
The condition of socioeconomic stability and development in a country concern the housing market. Therefore, the ability to own a house is very crucial. The fundamental economic and social needs for everyone is the right to appropriate housing yet affordable and appropriate needs (Drudy, 2007; Osman, Yusof, Shuid, & Abdullah, 2017). Comfortable housing will contribute to health and well-being. Therefore, owning a home is the dream of every individual. Finding affordable, secure and adequate housing in term of location is one of the biggest problems of Malaysian households today.
Housing within an urban area is more expensive as compared to housing in a rural area, added further there were few differences in the locations of greatest housing affordability between housing tenures, and this proven with the spatial mismatch of location and affordable houses (Dodson, 2005; Khazanah Research Institute, 2015; Osman et al., 2017) Housing prices are also heavily dependent on location since there is a relation to the role of location in the housing market (Guan, 2012; Lipman, 2006) Therefore, location does have an influence not just on housing expenditure but also towards on-going transportation expenditure, in particular, the distance between residential neighbourhoods and employment centres (Lipman, 2006; Mattingly & Morrissey, 2014).
There are many types of research on housing affordability conducted in Malaysia which focus on socio demographic such as low-income group and also on youth. Nevertheless, none of those research has made a comparison between two income groups (Zyed, 2014; Bujang, Zarin, & Jumadi, 2010; Mahmud & Hussein, 200; Sani, 2013; Sani, 2007). To make a comparison between two income groups are very crucial to identifying housing affordability of an urban area. This research focuses on location housing affordability within an urban area in Selangor. With this comparison of the two income level groups, the finding from the research will be more fitting and easily relates to location housing affordability. To achieve that, this research will evaluate housing and transportation expenditures based on questionnaire survey.
The targeted population is the urban dweller in a mature residential area of Selangor, consisting of the middle and low income groups. The research aims to assess housing and transportation expenditure using Location Housing Affordability in an urban area of Selangor (Jain & Brecher, 2014). Three research questions were posed as the objectives of this research, (1) How does affordability differ when transportation expenditure is part of affordability index? (2) How do household housing and transportation expenditure vary for the low and middle income group in an urban area? (3) Is urban housing area in Selangor be unaffordable?
groups in an urban area based on Location Housing Affordability Index. At the same time, the result would show that location does matter for affordable housing.
HOUSING EXPENDITURE AND LOCATION
In terms of monetary, housing expenditure is a large amount of the household budget. The low-income group, however, have extra strain on a budget for others essential expenditures such as food, transportation, healthcare and education. Households were paying more than half of their income on housing expenditure usually spend substantially less than other families on essential expenses such as food, clothing, and health care (Streimikiene, 2015). As the size of the family increases, these difficulties tend to worsen. If the provision and conditions of low-cost and middle-low-cost housing are good on the one hand, the high housing expenditure on the other side constitutes a major concern for households.
Hence the housing stress will formulate and hinder the relations between the household members and damper the development of the children in term of the children education and health (Zainal, Kaur, Ahmad, & Khalili, 2012). It agreed in the past that location of the low and middle-income group has fewer amenities compare to other income groups, due to their ability to spend more on great amenities (Bieri, 2013). Therefore housing affordability can impend the households’ physical well-being and economic security. The provision of adequate and affordable housing is essential in a growing economic nation and also part of thequality of life.
The important aspect of provision is how affordable housing is to the people? Housing prices were also heavily dependent on location. For example in the State of Selangor, the state as moderately unaffordable because the research had included rural areas such as Kuala Selangor, Hulu Selangor, Kuala Langat and Sabak Bernam, where the housing price is lower as compared to urban areas of Selangor, Petaling Jaya, Subang Jaya and Shah Alam (KRI, 2015, Osman et al., 2017). Evidently, there is an issue of housing affordability in the urban area, and spatial geographical location does play as part of housing affordability. Finding affordable, secure and adequate housing in term of location is one of the biggest problems of low and middle-income households’ today especially in urban area.
HOUSING AFFORDABILITY CONCEPT & MEASUREMENT
However, housing affordability lacks a precise definition as affordability is not a natural characteristic of housing but rather a relationship between income and relative prices (Stone, 2006). From various perspectives and contexts, the term of housing affordability is the ability of an average household’s willingness to own and sustain an average home (housing-related costs) without being financially distressed after the purchase as well as retaining a socioeconomic stability.
The various definitions and concepts of housing affordability led to different approaches towards measuring housing affordability such as house price to income ratio, residual income after housing costs, and purchase and repayment affordability (Stone, 2006; Tawil, Shuhaida, Hamzah, Che-Ani, & Tahir, 2015; Gann, & Hill, 2009). There is lack of agreement on the correct or precise measurement of housing affordability. In most countries including Malaysia, commonly used measurement of housing affordability is housing expenditure-to-income ratio.The distinction between of affordable and unaffordable relies on the allocated 30% of the income that is if the house costs more than 30% of income considered as unaffordable and vice versa (Hulchanski, 1995).
The indicator measurement for housing expenditure-to income ratio has several limitations. One of the critics for this indicator is it’s incompetence to distinguish housing quality. High housing prices should offer better features. Whereas low housing price offer unfavourable features such as an unsafe building structure and unfavorable location (Stone, 2006; Bogdan & Can, 1997). Nevertheless, a higher housing expenditure along with high interest would burden household income. However, the housing expenditure-to income ratio indicator can be used to identify the low and middle income groups’ financial problem in relation to housing affordability.
In recent years, there is a new indicator on housing affordability which includes transportation expenditure (Litman, 2014; Sabri, Ludin, Johar, 2013; Yusoff, Adnan, & Rasam, 2014). Housing and transportation are the two largest expenses for most households. Together, they account for more than half of household spending(Jewkes & Delgadillo, 2010).The transportation expenditure measures the geographical and transportation factor of housing affordability. The three most important variables to determine transportation expenditure are vehicle ownership, vehicle usage and public transit. The increase of vehicle ownership is the result of shortage in public transportation to access employment and services especially in urban area. Therefore a significant amount of income has to be spent for transportation expenditure.
affordable life, both housing and transportation expenditure must be under 45 % of total income. The 45 % mark will be the affordability measurement for the Location Housing Affordability (Litman, 2014).
RESEARCH METHODOLOGY
Study area
Selangor is selected as a case study due to its dense population in Malaysia. Together with the accessibility of highways and public transports, good infrastructure and high standard of living, Selangor appears to be the most developed state in Malaysia.
One of the prominent residential areas in Selangor is Putra Height. Putra Height has different ranges of houses that suit with low and middle income groups. Therefore, the people living in the residential area are within the targeted income group. Putra Heights is chosen as a case study due to the availability and accessibility to public transportation. The recent opening of the extended LRT lines to Putra Heights indicates that the residential area is very convenient for public transit users. The connection of highways and main roads surrounding Putra Heights has made the location one of the best residential areas to live in.
Data Collection
This research uses quantitative method based on the housing affordability survey. Questionnaire survey was conducted using questionnaire form due to the sensitivity of respondents’ financial information. Randomly, 179 respondents were selected and interviewed within the study area. The questions include respondents’ income range which are (i) the low income group (81 respondents) and (ii) the middle income group (98 respondents). The structure of the questions is divided into three main variables involving location housing affordability, housing expenditure and transportation expenditure. Finally, the measurement of location housing affordability was made to identify housing affordability among the low income and middle income groups in the urban area.
Household Income, Housing & Transportation Expenditure
In this research, household income is divided into the low income group and middle income group. The income range for the low income group or the B40 is less than RM2, 537, and the income range for the middle income group or the M40 range from RM3, 860 to RM8, 319.26. The median value has been used to measure the household income rather than mean value because the median value eludes the skewing of data by outlier (see Table 1).
represent the variables. Transportation expenditure is divided into three variables which are vehicle ownership, vehicle usage and public transit.
Vehicle ownership is determined by the number of the vehicle, monthly payment of the vehicles, and the annual amount of insurance and tax. Vehicle usage is based on the average annual kilometre travel in Selangor which is 28,576 km together with the distance of the respondents travelling to work(Shabadin, Megat Johari, & Mohamed Jamil, 2014). Hence allowing calculation of the amount of fuel used. Apart from that, vehicle usage is also based on the monthly amount of toll and parking fees together with repair cost and maintenance. Public transit will be the total amount of monthly expenses on public transport as the main transportation. Adding up all the variables will then give the mean transportation expenditure.
Table 1: Elements and variables of location housing affordability
Measure Variables
Median household income Total household income
Mean housing expenditure Monthly mortgage payment + total utilities
payment
Mean transportation expenditure Vehicle ownership + vehicle usage + public transit
The method to compute a simplified location housing affordability is as per equation below:
LHA is Location Housing Affordability. Where mHi is the median of household income, µHe is the mean housing expenditure for the household, and
µTc is the transportation expenditure. The equation to compute for µHe and µTc
is as per below:
µHe : Mp + Ub µTc: Vo + Vu + Pt
Mp is the monthly mortgage payment, Ub is the total monthly amount of utility bills, Vo is the vehicle ownership, Vu is the vehicle usage, and Pt is the public transit. Affordability categories is based on the result of the location housing affordability index as shown in table 2.
Table 2: Affordability categories
Rating LHA Result
Affordable > 0.55
Seriously unaffordable 0.39 – 0.25
Severely unaffordable < 0.24
Source: Litman, (2014)
DATA ANALYSIS AND RESULT
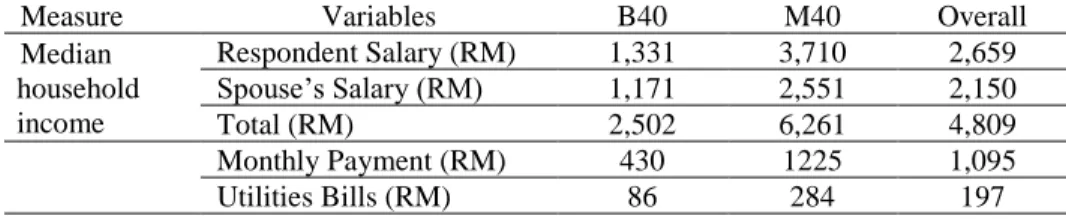
The data analysis was divided into three parts which are (i) the low income group (B40), (ii) the middle income group (M40) and (iii) both income groups representing the residents of Putra Height. The median household income for the low income group was RM2,502, and for the middle income group was RM6,261. Transportation expenditure does have an influence towards housing affordability (Table 3). Based on the location housing affordability index, the result showed that the low transportation expenditure for overall respondents were RM2,299 (48% of overall median household income). However none of the respondents used the public transit as their main transportation even though Putra Height had the connectivity of two LRT lines. The LRT station built after Putra Height was known as a prominent residential area not as Transit Oriented Development (TOD). Most of the residents used their own vehicles resulting to high transportation expenditure.
In terms of value, middle income has higher mean transportation expenditure, and the mean household expenditure than the low-income group is because the middle-income group have the ability to spend more. For example on the utility bills, the middle-income group have to installed internet connection and satellite television. Most of the middle-income group own more than one vehicle due to working households that require vehicles to travel to work.
There was a slight difference between the low and the middle income groups in terms of the housing and transportation expenditure. The result of location housing affordability for the low income group was 0.30, and the middle income group was 0.34. Despite the difference of 0.04, the area is still unaffordable. Both low income group and middle income group struggled on housing affordability along with the rapidly increasing cost of living in the urban area.
The overall location housing affordability result was 0.25. The result revealed and agreed with a recent research mentioning that urban area in Selangor is seriously unaffordable.The importance of transportation should be seriously considered by the policy makers together with locality and affordable housing.
Table 3: Location affordability result by income group in Putra Height
Measure Variables B40 M40 Overall
Median household income
Respondent Salary (RM) 1,331 3,710 2,659
Spouse’s Salary (RM) 1,171 2,551 2,150
Total (RM) 2,502 6,261 4,809
Mean household expenditure
Total (RM)
516 1509 1,292
Mean transportation expenditure
Vehicles Ownership (RM) 393 1580 1,368
Vehicles Usage (RM) 833 1,035 931
Public Transit (RM) 0 0 0
Total (RM) 1,226 2,615 2,299
LHA Result 0.30 0.34 0.25
CONCLUSION
There appeared to be flaws for the current and conceptual measurement of housing affordability due to the exclusion of transportation expenditure. Location housing affordability in this research has shown that location has an influence towards housing affordability. The findings show that the urban areas are becoming seriously unaffordable. This research agrees that housing affordability in urban area especially in Selangor is seriously unaffordable. A simplified computation of Location Housing Affordability index used for the measurement of the locality is proven to be more precise as it takes into account the location of the housing areas. Location Housing Affordability index shift the vague definition of affordability to integrate the transportation expenditures. The Location Housing Affordability Index should be considered as an indicator for quality of life assessment as the measurement is inclusive of transportation expenditure. Housing affordability can impend the households’ physical well-being and economic security. Policy makers should be mindful of the importance of transportation, locality and affordable housing towards better quality of life of the citizens.
Providing affordable housing especially for low and middle income groups especially in the urban areas improve quality of life. Moreover, the term ‘location’ should be a part of the definition of affordable housing as it influences household expenditure. Further studies should be carried out on location housing affordability with other socio-demographic groups such as medium-income group, youth civil servant, and elderly. The findings would provide better understanding on the issues of housing affordability in Malaysia.
REFERENCES
Bujang, A. A., Zarin, H. A., & Jumadi, N. (2010). The relationship between demographic factors & housing affordability. Malaysian Journal of Real Estate, 5(1), 49-58. Bieri, D. S. (2013). Housing Affordability. In A. Michalos (Ed.), Encyclopedia of quality
of life research. New York/Heidelberg: Springer Verlag.
Chowdhury, M. Z. S. (2013). The housing affordability problems of the middle & low income groups in Dhaka: A policy environment analysis (Thesis). University of Hong Kong, Hong Kong.
Dodson, J. (2005). Is there a spatial mismatch between housing affordability &
employment opportunity in Melbourne? AHURI Final Report No. 80, Australian
Housing and Urban Research Institute Limited, Melbourne. Retrieved from https://www.ahuri.edu.au/research/final-reports/80.
Drudy, P. J. (2007). Housing in Ireland: Philosophy, affordability & access. Journal of the Statistical & Social Inquiry Society of Ireland, XXXVI, 84-125.
Gann, Q. & Hill, R. J. (2009). Measuring housing affordability: Looking beyond the median. Journal of Housing Economics, 18(2), 115-125.
Guan, M. (2012). How to affect housing values: Location, affordability, & amenity.
African Journal of Business Management, 6(16), 5593-5598.
Hulchanski, J. D. (1995). The concept of housing affordability: six contemporary uses of the housing expenditure to income ratio. Housing Studies, 10(4), 471-491. Jain, R. & Brecher, C. (2014). Housing affordability versus location affordability: The
rent’s too damn high! But the Metrocard is a pretty good deal. Retrieved from https://trid.trb.org/view/1321381
Jewkes, M. D., & Delgadillo, L. M. (2010). Weaknesses of housing affordability indices used by practitioners. Journal of Financial Counseling and Planning, 21(1). Retrieved from https://papers.ssrn.com/sol3/papers.cfm?abstract_id=2222052 Khazanah Research Institute [KRI] (2015). Making housing affordable. Kuala Lumpur:
Author.
Lipman, B. J. (2006). A heavy load: The combined housing & transportation burdens of
working families. Retrieved from
http://www.reconnectingamerica.org/resource-center/books-and- reports/2006/a-heavy-load-the-combined-housing-and-transportation-burdens-of-working-families/
Litman, T. (2014). Transportation affordability: Evaluation and improvement strategies. Victoria Transport Policy Institute.
Mahmud, R., &Hussein, K. (2001). Kajian ke atas keupayaan membeli rumah bagi golongan sederhana di kawasan Johor Bahru (Unpublished project report). Universiti Teknologi Malaysia, Malaysia.
Mallach, A. F. (2009). The case for affordable housing. Planning, 75(3), 31-36.
Mattingly, K., & Morrissey, J. (2014). Housing & transport expenditure: Socio-spatial indicators of affordability in Auckland. Cities, 38, 69-83.
Mostafa, A., Wong, F. K. W., & Hui, C. M. E. (2006). Relationship between housing affordability & economic development in mainland China - Case of Shanghai.
Osman, M. M., Yusof, S. W. M., Shuid, S., & Abdullah, M. F. (2017d). Housing affordability index for districts in Perak. Advanced Science Letters, 23(7), 6049-6052.
Quiqley, J. M. & Raphael, S. (2004). Is Housing Unaffordable? Why Isn’t It More Affordable? Journal of Economic Perspectives 18, 191-214.
Sani, N. M. (2013). Residual Income Measure of housing Affordability. International Journal of Advances in Engineering & Technology, 5(2), 1-8.
Sani, N. M. (2007). Kemampuan pemilikan rumah kos rendah di Kuala Lumpur (Doctoral dissertation). Universiti Sains Malaysia, Malaysia.
Stone, M. E. (2006). What is housing affordability? The case for the residual income approach. Housing Policy Debate, 17, 151-184.
Swartz, R. & Miller, B. (2002). Welfare reform & housing. In I. V. Sawhill, R. K. Weaver, R. Haskins, & A. Kane (Eds.), Welfare reform & beyond: The future of the safety net (pp. 197-204). Washington D.C: Brookings Institution Press.
Shabadin, A., Megat Johari, N., & Mohamed Jamil, H. (2014). Car annual vehicle kilometer travelled estimated from car manufacturer data – an improved method.
Pertanika, 25(1), 171-180.
Streimikiene, D. (2015). Quality of life and housing. International Journal of Information and Education Technology, 5(2), 140-145.
Sabri, S., Ludin, A. N. M., & Johar, F. (2013). Assesment of neightbourhood affordability based on housing & transportation costs in Kuala Lumpur, Malaysia. Planning Malaysia, 2, 75-100.
Tawil, N. M., Shuhaida, M. S., Hamzah, N., Che-Ani, A. I., & Tahir, M. M. (2015). Housing affordability in two university towns in Selangor, Malaysia. Recent Research in Chemistry, Biology, Environment & Culture.
Whitehead, C. M. E. (1991). From need to affordability: An analysis of UK housing objectives. Urban Studies, 28, 871-887.
Yusoff, Z. M., Adnan, N. A., & Rasam, R. A. (2014, August). [H+T] Affordability Index for Low-Cost Housing Location-Distribution Procedure. In Arte-Polis 5 Intl Conference – Reflections on Creativity: Public Engagement and the Making of Place. August 8-9, 2014, Bandung, Indonesia.
Zainal, N. R., Kaur, G., Ahmad, N. A., & Khalili, J. M. (2012). Housing Conditions and Quality of Life of the Urban Poor in Malaysia. Procedia - Social and Behavioral Sciences, 50, 827-838.