FUNCTIONAL 3-D CELLULOSE & NITROCELLULOSE PAPER-BASED, MULITPLEX DIAGNOSTIC PLATFORMS WITHOUT
COUPLING AGENTS
A Thesis presented to
the Faculty of California Polytechnic State University, San Luis Obispo
In Partial Fulfillment
of the Requirements for the Degree Master of Science in Biomedical Engineering
by
ii © 2013
iii
COMMITTEE MEMBERSHIP
TITLE: Functional 3-D Cellulose & Nitrocellulose Paper-Based, Multiplex Diagnostic Platforms Without Coupling Agents
AUTHOR: Mackenzie Elizabeth Tageson
DATE SUBMITTED: December 2013
COMMITTEE CHAIR: David Clague, PhD
Associate Professor, Biomedical Engineering California Polytechnic State University COMMITTEE MEMBER: Robert Crockett, PhD
Director, General Engineering Program
California Polytechnic State University COMMITTEE MEMBER: Richard Savage, PhD
Director of Graduate Education
iv
ABSTRACT
Functional 3-D Cellulose & Nitrocellulose Paper-Based, Multiplex Diagnostic Platforms Without Coupling Agents
Mackenzie Elizabeth Tageson
The purpose of this thesis was to demonstrate device functionality of 3-D paper-based, multiplex platforms, µPADs, without the use of coupling agents between layers. Previously, these platforms were fabricated with double-sided tape and cellulose powder to try to augment proper fluid routing, but difficulties with this method occurred. An acrylic housing unit with strategically placed pressure tabs was designed to aid horizontal and vertical fluid routing through the platform, thus eliminating the inconsistencies associated with coupling agents. Channel characterization studies, a COMSOLTM simulation, and development time studies were performed to aid device design and demonstrate device functionality.
The implementation of this µPAD platform as a diagnostic instrument was validated via lateral flow immunoassays utilizing both biotinylated antibodies and biotinylated aptamers as capture reagents. Successful detection of the target analyte, IgE, as well as successful fluid routing through multiple layers of membrane was
demonstrated by immunoassays performed on 3-D, multiplex platforms. Another
v
ACKNOWLEDGMENTS
I would like to thank my thesis advisor, Dr. David Clague, for his support and guidance to make this thesis the best that it could be. His belief in my ability to
successfully complete this project was unwavering which helped push me through times of self-doubt. I would also like to thank Dr. Robert Crockett and Dr. Richard Savage for taking the time and effort to review my thesis submission and for serving on my thesis committee.
To the biofluidics group in the Biomedical Engineering Department, thank you for all your help and support: Sarah Klemm, thank you for the housing design research you performed; it was a vital aspect to the progression of my thesis. Karina Moraes, thank you for always being there to trouble-shoot COMSOL with me and for all the encouragement and support you gave to me throughout this experience. I greatly appreciate all that you did. Katherine Clayton and Jennifer Ward, thank you for laying down an amazing foundation from which I was able to launch my thesis.
vi
TABLE OF CONTENTS
LIST OF TABLES ... viii
LIST OF FIGURES ... ix
LIST OF EQUATIONS ... xvi
CHAPTERS I INTRODUCTION ... 1
Thesis Project Goal and Specific Aims ... 1
Motivation ... 3
Paper-Based Microfluidic Diagnostic Devices ... 4
Background: Paper-Based Lateral Flow Assay ... 5
Fabrication of Fluid Routing Channels in Nitrocellulose Membranes ... 9
Immunoassays ... 18
Project Specific Immunoassay ... 22
II MATERIALS AND METHODS ... 24
Multiplex Platform ... 24
Channel Characterization: Channel Widths ... 24
Positive Pressure Application ... 27
Single-Channel, Multi-Layered Platforms ... 29
Conjugate Pad Characterization ... 30
Single-Channel, Multi-Layer Platform: Functional Dye Test ... 31
3-D Multiplex Platforms ... 34
Multiplex Platform: Membrane Designs ... 34
Housing Unit Designs ... 40
Housing Unit Design: COMSOLTM Model ... 44
Development Time Tests: Multiplex Platform ... 46
Biochemistry ... 47
Aptamer vs Antibody Capture Reagents ... 47
Solution and Membrane Preparations ... 48
Immunoassay Experiments ... 51
Data Acquisition and Analysis... 53
III RESULTS ... 55
Multiplex Platform Design ... 55
Channel Characterization: Channel Widths ... 55
Positive Pressure Application ... 55
Single-Channel, Multi-Layer Platforms ... 57
Conjugate Pad Characterization ... 57
Single Channel, Multi-layer Platform: Functional Dye Test ... 57
3-D Multiplex Platforms ... 59
Housing Unit Design: COMSOLTM Modeling Results: ... 59
Development Time Tests: Multiplex Platforms ... 65
Biochemistry ... 73
Immunoassay Experiments ... 73
IV DISCUSSION ... 76
Multiplex Platform Design ... 76
Channel Characterization: Channel Widths ... 76
vii
Single-Channel, Multi-Layer Platforms ... 79
Conjugate Pad Characterization ... 79
Single Channel, Multi-Layer Platform: Functional Dye Test ... 80
3-D Multiplex Platforms ... 81
Housing Unit Design: COMSOLTM Simulations ... 81
Development Time Tests: Multiplex Platforms ... 83
Biochemistry ... 86
Immunoassay Experiments ... 86
V CONCLUSIONS ... 89
VI FUTURE WORK... 91
REFERENCES ... 94
APPENDICES ... 97
APPENDIX A: Dimensions of Membrane Design 5, Housing Unit Design 2 AutoCAD Templates ... 97
Membrane Design 5: Layer Dimensions ... 97
Housing Unit Design 2: Part Dimensions... 100
APPENDIX B: Statistical Analysis ... 102
Statistical Analysis Figures and Plots ... 104
Channel Characterization Anova and Box Plot: ... 104
Positive Pressure Application ANOVA and Tukey HSD plot: ... 105
Platform Development Times ANOVA and Box Plot: ... 106
Final Platform Channel Development Times ANOVA and Tukey HSD Plot .... 107
Fluorescent Intensity T-Test Results: Raw Output ... 110
APPENDIX C: Functional Dye Test and Development Time Test Figures ... 111
Channel Characterization Study Images and Raw Data Tables ... 111
Positive Pressure Application Study Images and Raw Data Table ... 114
Single-Channel, Multi-Layer Platform: Functional Dye Test Images ... 116
APPENDIX D: Fluorescent and White Light Images of Detection Zones ... 117
APPENDIX E: Biotinylated Anti-IgE Antibody and IgE Aptamer Dilution Calculations... 122
Biotinylated Anti-IgE Antibody Dilutions ... 122
Biotinylated IgE Aptamer Dilutions ... 122
viii
LIST OF TABLES
Table I: Fabrication Comparisons [6] ... 17
Table II: COMSOLTM Material Properties ... 45
Table III: COMSOLTM Boundary Loads ... 45
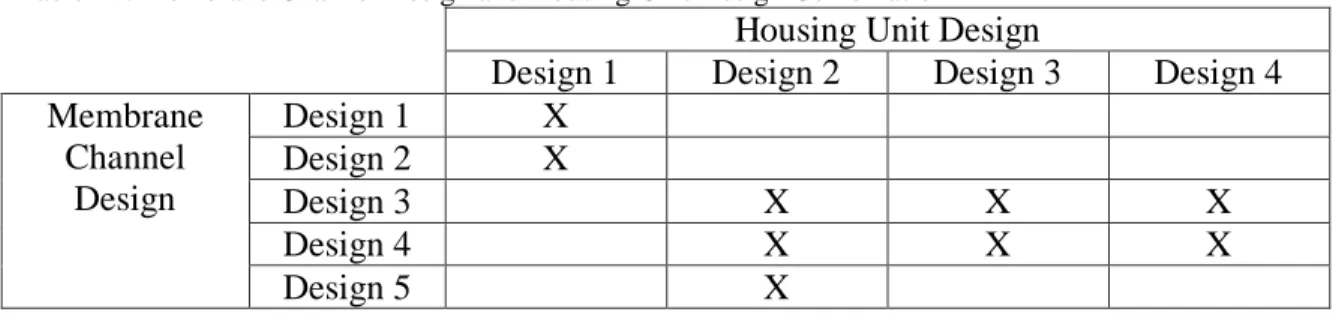
Table IV: Membrane Channel Design and Housing Unit Design Combination ... 47
Table V: Immunoassay Reagent Combinations. ... 52
Table VI: Channel Characterization Fluid Velocities ... 55
Table VII: Velocities Obtained During the Positive Pressure Study ... 56
Table VIII: Summary of COMSOL Modeling Results... 65
Table IX: Development Time Results of Membrane Design 1in Housing Design 1 ... 65
Table X: Development Time Results of Membrane Design 2 in Housing Design 1 ... 66
Table XI: Results of Membrane Design 3 or 4 in Housing Design 2, 3, & 4 ... 68
Table XII: Development Time Results of Membrane Design 4 in Housing Design 2 ... 69
Table XIII: Development Time Results of Membrane Design 5 in Housing Design 2 .... 71
Table XIV: Immunoassay Results: Antibody vs Aptamer Capture Reagents ... 73
Table XV: Statistical Analysis of Mean Fluorescent Intensity Results ... 75
Table XVI: Channel Characterization Dye Test 1 Results ... 112
Table XVII: Channel Characterization Dye Test 2 Results ... 112
Table XVIII: Channel Characterization Dye Test 3 Results ... 112
Table XIX: Channel Characterization Dye Test 4 Results ... 112
Table XX: Channel Characterization Dye Test Average Velocities ... 113
ix
LIST OF FIGURES
Figure 1: Lateral Flow Assay Device [9]. ... 7
Figure 2: Photolithography Fabrication Method [6]. ... 10
Figure 3: Switch implemented in an etched µPAD [11]. ... 12
Figure 4: Cutting Fabrication Method [7]. ... 12
Figure 5: Inkjet Etching Fabrication Methods [12]. ... 14
Figure 6: Wax Printing Fabrication Method [13]. ... 15
Figure 7: Fabrication Method Summary. A) Photolithography, B) Plotting, C) Ink-jet Printing, D) Plasma Etching, E) Cutting, and F) Wax Printing fabrication techniques [6]. ... 16
Figure 8: Sandwich ELISA [14]. ... 19
Figure 9: Competitive ELISA [14]. ... 20
Figure 10: Colloidal Gold Nanoparticles as Detector Label in Colorimetric Assay [16]. ... 20
Figure 11: AutoCADTM Template for Channel Characterization ... 25
Figure 12: XEROX Color Cube 8570 Wax Printer ... 26
Figure 13: Clarkson Digital, Ceramic Top Hot Plate. ... 26
Figure 14: Red Dye ... 27
Figure 15: AutoCADTM Template for Positive Pressure Application Study ... 28
Figure 16: AutoCADTM Template for the fluid routing layer and conjugate pad layer, with five conjugate pad geometries (left). The fluid routing layer and conjugate pad layer are placed on top of each other for conjugate pad characterization (right). ... 30
x
Figure 18: AutoCADTM Template of Single-Channel, Multi-Layer Platform ... 33
Figure 19: AutoCADTM Templates of Membrane Layer Designs 1-5. Design 1 (top left), Design 2 (top middle), Design 3 (top right), Design 4 (bottom left), Design 5 (bottom right). ... 35
Figure 20: Step 1 of assembly protocol showing the placement of the sample input layer. ... 36
Figure 21: Step 2 of assembly protocol showing the placement of the absorbent pad. .... 36
Figure 22: Step 3 of assembly protocol showing the placement of the isolation layer. ... 37
Figure 23: Step 4 of assembly protocol showing the placement of the fluid routing layer... 37
Figure 24: Step 5 of assembly protocol showing the placement of the conjugate pad. .... 38
Figure 25: Step 6 in assembly protocol showing the placement of the detection layer. ... 38
Figure 26: Step 7 in assembly protocol showing the placement of the housing unit cover ... 39
Figure 27: Step 8 in assembly protocol showing how to secure the housing unit with nuts and bolts. ... 39
Figure 28: Housing Design 1 ... 41
Figure 29: Housing Design 2 ... 41
Figure 30: Housing Design 3 ... 42
Figure 31: Housing Design 4 ... 42
Figure 32: AutoCADTM Template for Four Housing Designs ... 43 Figure 33: Platform for Immunoasssay. Numbers 1-4 on the left denote channel
xi
conjugate pad (L = Low = 2ug/mL, H = High = 22ug/mL, and
C = Control = 0 ug/mL ... 53
Figure 34: Conjugate Pad Characterization Results ... 57
Figure 35: Single-Channel, Multi-Layer Platform Results ... 58
Figure 36: Simulation 1: Total Displacement and Contact Pressure Surface Plots ... 59
Figure 37: Simulation 1: Contact Pressure Line Plot... 60
Figure 38: Simulation 2: Total Displacement and Contact Pressure Surface Plots ... 61
Figure 39: Simulation 2: Contact Pressure Line Plot... 62
Figure 40: Simulation 3: Total Displacement and Contact Pressure Surface Plots ... 63
Figure 41: Simulation 3: Contact Pressure Line Plot... 64
Figure 42: Development Time Results for Membrane Design 1 in Housing Design 1. Chip 1 (top left), Chip 2 (top right), and AutoCADTM template for the chip layers (middle bottom). ... 66
Figure 43: Development Time Results for Membrane Design 2 in Housing Design 1. Chip 1 (top left), Chip 2 (top right), Chip 3 (bottom left), and AutoCAD template for the chip layers (bottom right). ... 67
xii
Figure 45: Development Time Results for Membrane Design 4 in
Housing Design 2. Housing 2, Chip 1 (top left), Housing 2, Chip 2 (top right),
AutoCAD template for the chip layers (bottom). ... 70
Figure 46: Development Time Results for Membrane Design 5 in Housing Design 2. Chip 1 (top left), Chip 2 (top right), Chip 3 (middle left), Chip 4 (middle right), Chip 5 (bottom left), AutoCad template for the chip layers (bottom right). ... 72
Figure 47: Dimensions of the Sample Input Layer in inches... 97
Figure 48: Dimensions of the Absorbent Pad in inches ... 97
Figure 49: Dimensions of the Isolation Layer in inches ... 98
Figure 50: Dimensions of the Fluid Routing Layer in inches ... 98
Figure 51: Dimensions of the Conjugate Pad in inches ... 99
Figure 52: Dimensions of the Detection Layer in inches ... 99
Figure 53: Dimensions of a part of the Top Half of the Housing Unit in inches... 100
Figure 54: Dimensions of a part of the Top Half of the Housing Unit in inches... 100
Figure 55: Dimensions of a part of the Bottom Half of the Housing Unit in inches ... 101
Figure 56: Dimensions of a part of the Bottom Half of the Housing Unit in inches ... 101
Figure 57: Channel Characterization study ANOVA Table ... 104
Figure 58: Channel Characterization Study Box Plot. This box plot shows the velocities through the different channel widths. ... 104
Figure 59: Positive Pressure Application Study ANOVA Results. ... 105
xiii
Figure 61: Chip Development Time ANOVA Table for functional dye tests on final platform design. ... 106 Figure 62: Chip Development Time Study Box Plot. This is the box plot for the
functional dye tests on final platform design. ... 106 Figure 63: Channel Development Time ANOVA Table for functional dye tests on final platform ... 107 Figure 64: Channel 1 Development Time Tukey HSD Plot for Statistical Difference .. 107 Figure 65: Channel 2 Development Time Tukey HSD Plot for Statistical Difference .. 108 Figure 66: Channel 3 Development Time Tukey HSD Plot for Statistical Difference .. 108 Figure 67: Channel 4 Development Time Tukey HSD Plot for Statistical Difference .. 109 Figure 68: Channel Characterization Results. Images of membranes from the
channel characterization functional dye tests. Test 1 = top left; Test 2 = top right;
Test 3 = bottom left; Test 4 = bottom right. ... 111 Figure 69: Positive Pressure Application Study Results. This is an image of the
membrane from the positive pressure application functional dye test. The top ten channels were subjected to positive pressure. The bottom ten channels weren’t
subjected to pressure ... 114 Figure 70: Unsuccessful Functional Dye Tests on Single-Channel, Multi-Layer
Platforms. These are images of single-channel, multi-layer platforms that were
unable to route fluid through the entire chip. ... 116 Figure 71: Successful Functional Dye Tests on Single-Channel, Multi-Layer
xiv
Right images show the absorbent pads ... 116 Figure 72: Fluorescent and White Light Images of Assay 1 Results under 20X
objective. Top Left: Fluorescent image of antibody capture agent detection zone. Top Right: Fluorescent image of control detection zone. Bottom: White light image of detection zone. ... 117 Figure 73: White Light Image and Fluorescent Image of Channel 2, Detection
Zone 1 of Assay 2 under 4X objective. The capture reagent in the detection
zones was biotinylated aptamer. ... 118 Figure 74:White Light Image and Fluorescent Image of Channel 3, Detection
Zone 1 of Assay 2 under 4X objective. The capture reagent in the detection
zones was biotinylated aptamer. ... 118 Figure 75: White Light Image and Fluorescent Image of Channel 3, Detection
Zone 2 of Assay 2 under 4X objective. The capture reagent in the detection
zones was biotinylated antibody. ... 119 Figure 76: White Light Image and Fluorescent Image of Channel 4, Detection
Zone 1of Assay 2 under 4X objective. The capture reagent in the control zones
was biotinylated aptamer. ... 119 Figure 77: White Light Image and Fluorescent Image of Channel 4, Detection
Zone 2 of Assay 2 under 4X objective. The capture reagent in the control zones
was biotinylated antibody. ... 120 Figure 78: White Light Image and Fluorescent Image of Channel 3, Detection
Zone 1 of Assay 5 under 4X objective. The capture reagent in the detection zones
xv
Figure 79: White Light Image and Fluorescent Image of Channel 3, Detection Zone 2 of Assay 5 under 4X objective. The capture reagent in the detection zones
was biotinylated antibody. ... 121 Figure 80: White Light Image and Fluorescent Image of Channel 4, Detection
Zone 1 of Assay 5 under 4X objective. The capture reagent in the control zones
was biotinylated antibody. ... 121 Figure 81: White Light Image and Fluorescent Image of Channel 4, Detection
Zone 2 of Assay 5 under 4X objective. The capture reagent in the control zones
xvi
LIST OF EQUATIONS
𝐿= (𝛾𝐷𝑡/4ƞ)12, 1 ... 15
𝑣= 𝑟2(𝑃𝐴+ 𝑃𝐶)8𝜇𝑙, 2 ... 78
1
I INTRODUCTION
Thesis Project Goal and Specific Aims
Microfluidic paper-based analytical devices, µPADs, are becoming forerunners for Point of Care diagnostic devices in low resource environs. In order for proper disease diagnosis, cost-efficient technologies need to be produced that are not only easily manufactured, distributed, and stored, but can accurately diagnose diseases [1, 6]. This research project was performed to demonstrate the functionality of 3-D µPAD platforms, utilizing antibody and DNA aptamer capture reagents, without using coupling agents between device layers.
3-D µPAD platforms have a significant advantage over conventional lateral flow assays owing to their adaptability to permit multiple detection sites on a single device [1]. This advantage has the promise of enabling time efficient and cost effective testing for multiple disease markers. Additionally, because distinct, individual “micro-channels” can be patterned in 3-D µPADs, these devices have the potential to be designed to prevent sample cross-contamination while processing a sample with multiple targets, therefore ensuring more precise disease diagnosis [1].
2
were too long to allow for rapid diagnosis. Thus, by designing a new instantiation of a paper-based, multiplex platform for target detection, i.e., no coupling agents and new capture reagents, important steps were taken toward creating a cost-efficient, robust and accurate diagnostic instrument.
The primary research goal was to demonstrate effectual fabrication of 3-D, multiplex paper-based microfluidic diagnostic platforms that perform as designed without coupling agents between membrane layers. In order to obtain this goal, the specific aims of this thesis were the following:
Specific Aim 1: Develop a 3-D µPAD in cellulose/nitrocellulose membranes utilizing AutoCADTM for membrane design and wax printing for fluid routing channel fabrication
Specific Aim 2: Develop a housing unit with key pressure points to augment fluid routing in 3-dimensions utilizing experimental results and a
COMSOLTM Multiphysics model to aid the design process
Specific Aim 3: Validate device performance via multiplex, lateral flow immunoassays utilizing both Biotinylated Antibody and DNA Aptamer capture reagents, and show that Biotinylated DNA Aptamers are viable alternatives to Biotinylated Antibodies in multiplex, lateral flow
immunoassays
3
Motivation
Advancements in low cost diagnostic devices are crucial to providing effective health care worldwide. An article by the World Health Organization (WHO), the United Nation’s regulatory body for worldwide health, reported 10 million women and children in developing countries die from preventable and treatable disease each year [2]. In 2008, a study of the top ten leading causes of death in middle and low income countries was performed and the following four infectious diseases were listed; lower respiratory infections (7%), diarrhoeal diseases (5%), HIV/AIDS (4%), and tuberculosis (3%), all which can be treated or controlled with proper diagnosis [3]. In addition to these cited infectious diseases, cholera and meningococcal meningitis are two prevalent infectious diseases that account for many deaths worldwide every year. In 2010, 317,534 cases of cholera were reported worldwide and the number of resulting deaths was 7,543; a 52% increase when compared to statistics from 2009 [4]. As for meningococcal meningitis, in 14 African countries there were 22,831 reported cases in 2010 that resulted in 2,415 deaths [5]. These statistics help demonstrate the prevalence of infectious diseases
worldwide especially in middle to low-income countries where proper healthcare isn’t as widely available to the entire population. In addition, this shows the need for rapid, low-cost diagnostic devices for low income and resource environs, because the faster a disease can be properly diagnosed, the faster the proper treatment can be administered. As a result, the survival rate will increase.
4
devices. ASSURED stands for affordable, sensitive, specific, user-friendly, rapid and robust, equipment free, and deliverable [6]. In order for diagnostic devices to be
successfully implemented in developing countries, they must fulfill the previously listed ASSURED requirements.
Paper-Based Microfluidic Diagnostic Devices
Paper-based microfluidic diagnostic devices satisfy all the criteria to be an ASSURED diagnostic device and have been used in the past to diagnose diseases. In 1957, the first paper-based immunoassay was made that could detect the presence of glucose in urine and was commercially available by 1960 [7]. Even though advancements in immunology were being established in the early 1900s, it wasn’t until the 1950s that the interactions between antigens and antibodies, how the human body detects diseases for the immune system response, was fully understood [8]. Once these advancements were made, in 1982, a paper-based immunoassay was developed that used immune-recognition to detect specific bioanalytes [7]. One of the most familiar applications for this type of immunoassay is an at-home pregnancy test. This immunoassay tests for the presence of the pregnancy hormone, human chorionic gonadotropin, in urine [7]. In an assay, if this hormone is present, it will bind to an antibody locally immobilized in a detection region on the assay membrane. After a sufficient amount of conjugated, reporter labeled, analyte accumulates at the detection region, a visual color change reports the presence of the hormone, thus indicating pregnancy [7].
5
single platform. However, in order to realize the benefits of utilizing 3-D, multiplex platforms, it is important to understand the fundamentals of paper-based lateral flow assays.
In the basic paper-based lateral flow assay, such as a pregnancy test, the assay platform consists of four specialized forms of “paper-like” materials. These materials include a sample pad, conjugate pad, an assay membrane and an absorbent pad. The sample pad is specially treated to enable “sample preparation”; the conjugate pad stores dry reagents, that when resolubilized, bind to the target analyte in the fluid sample; the assay membrane has a detection stripe and a control stripe; the detection stripe captures the labeled analyte and the control stripe captures excess conjugate reagent; and finally, the absorbent pad provides additional void volume to ensure that the sample flows past the detection and control stripes. All of these components are held together with key pressure points in a polymer-based housing unit. The following section describes the function of each component.
Background: Paper-Based Lateral Flow Assay
6
distribution of the sample onto the conjugate pad. Other important functions of the sample pad include increasing the sample’s viscosity, increasing the sample’s ability to solubilize detector reagents, preventing non-specific binding of conjugates and analytes to downstream agents, and finally modifying the chemical nature of the sample in order to make it compatible with the immunocomplex (analyte/antibody complex) formation of the specific immunoassay being performed [9].
Generally, the two different materials used for the sample pad are woven meshes and cellulose filters [9]. Woven meshes are implemented because they evenly distribute the sample to the conjugate pad, have good tensile strength when compared to its thickness, and are fairly easy to handle after being wetted. One disadvantage of woven meshes is that they have small bed volumes; this means they retain very low volumes of the sample fluid [9]. On the other hand, cellulose filters are thick, weak, and relatively difficult to handle after wetting. But cellulose filters have a generous bed volume and are inexpensive; making them desirable and consequently more commonly used than woven meshes [9].
7
Figure 1: Lateral Flow Assay Device [9].
The conjugate pad is the reservoir for detector reagents, usually an antibody conjugated with colloidal gold, which is further explained in a later section. As the sample contacts the conjugate pad, it resolubilizes the detector reagents and carries them to the detection membrane. The conjugate pad must ensure that the sample and detector reagents are uniformly distributed to the detection membrane [9]. Conjugate pads are made from non-woven filters, which are fabricated by compressing pre-spun fibers of plastic, glass, or cellulose into thin porous films [9].
Now the sample and detection reagents enter the detection membrane, usually a nitrocellulose membrane. This membrane is the most important component in a lateral flow assay platform because it ultimately determines the development time of the assay [9]. The development time is highly dependent on the capillary flow rate of the fluid sample through the detection membrane [9]. In turn, the capillary flow rate influences reagent deposition, assay specificity, assay sensitivity, and test line consistency, which all affect the result of an immunoassay [9].
8
stripe. This is also known as a sandwich assay which is further explained in a later
section. At the test stripe, a reporter, the labeled detector antibody, accumulates providing a signal to the user of the assay’s results. Downstream of the detection stripe is the
control stripe. The purpose of the control stripe is to ensure the assay is functioning properly. Even if the target analyte isn’t present in the fluid sample and the detection stripe doesn’t devleop, the control stripe will still display a signal to the user, indicating that the assay ran correctly and that the result is negative. The capture reagent on the control stripe is usually an antibody that will bind to the Fc region of the reporter antibody.
After the detection membrane, an absorbent pad can be incorporated in order to increase the overall volume of sample that can pass through the membrane over the detection region. Without an absorbent pad, the total sample volume is limited to the overall bed volume of the membrane [9]. Like conjugate pads, the absorbent pad is typically made from cellulose filters, but other absorbent materials can be used [9]. Depending on the application, an absorbent pad may or may not be incorporated.
9
not use a housing unit [1, 6]. They used photolithography to create hydrophobic barriers in the membrane, which resulted in hydrophilic microfluidic channels through the membrane [1, 6]. This hydrophobic barrier fabrication process, as well as a variety of other fabrication processes, is further discussed in the following section. In this design, the separate layers of membrane were held together by double-sided tape, but the
thickness of the tape created gaps between the membrane layers [1, 6]. In order to bridge this gap, a paste made from cellulose powder was used [1, 6].
Even though successful 3-dimensional fluid routing was achieved by Whitesides et al., Jennifer Ward showed that using double-sided tape and cellulose paste as coupling agents is “not always the most efficient and reliable” process [10]. During her study, only one chip manufactured with coupling agents successfully routed fluid in 3-dimensions [10]. Her study also found that the platform’s assembly process using coupling agents was difficult, time consuming, and would be hard to scale up for mass production [10]. Therefore, it is clear an approach to eliminate coupling agents while still enabling 3-D fluid routing would be a significant advancement. One way to accomplish this is by designing and utilizing a housing unit, like commercial lateral flow assays, with strategically designed pressure tabs.
Fabrication of Fluid Routing Channels in Nitrocellulose Membranes
10
Photolithography, as shown in Figure 2, was the initial fabrication method used to produce µPADs in a study by Whitesides et al., pioneers in the paper microfluidic
diagnostic field, in 2010 [6].
Photolithography consists of impregnating a nitrocellulose membrane with the photoresist, SU-8, and selectively polymerizing the photoresist through UV exposure. Polymerizing photoresist creates hydrophobic barriers throughout the entire thickness of the nitrocellulose membrane [6]. After UV exposure, unpolymerized photoresist was washed from the nitrocellulose membrane by organic solvents [6]. However, these organic solvents are not ideal because they can leave behind unwanted chemicals and hydrophobic residues in the hydrophilic channels, which have the ability to affect capillary fluid flow through the channels [1].
Otherwise, photolithography creates very sharp and distinct borders between the hydrophobic barriers and hydrophilic channels, but the fact that organic solvents are used in the process is a major disadvantage. Another major disadvantage of conventional
11
photoresist is it is less flexible than the paper it is being used on. This means that the paper device can be damaged more easily when exposed to tensile, compressive, and bending forces [11].
Another fabrication technique used to produce hydrophilic channels in paper membranes is plasma etching. Li et al. used plasma etching to create hydrophobic barriers in Whatman chromatography paper in order to match the flexibility of the paper [11]. The cellulose based chromatography paper was hydrophobized using an alkyl ketene dimer (AKD) heptane solution. The filter paper was dipped into the AKD-heptane solution and then immediately heated at 100 °C for 45 minutes to allow the AKD to cure [11]. The hydrophobicity of the filter paper was determined through contact angle testing. Using water, the contact angle was found to be between 110 and125°, meaning the AKD saturated filter paper had been successfully hydrophobized [11]. Next, patterned stainless steel masks were clamped to the chromatography paper and the paper was treated with plasma [11]. The regions of hydrophobic chromatography paper exposed during plasma treatment became strongly wettable creating hydrophilic channels in the membrane [11].
This form of plasma treatment does not affect the color of the filter paper, therefore it is compatible with colorimetric assays [11]. Also, different functional elements such as switches, filters, and separators can be incorporated into the device. Switches can be used to connect or disconnect specific microfluidic channels. Once the switch has been activated, channels are connected, and fluid flow through the channel is established, either filtration of solid particles in the fluid sample or separation of
12
Figure 3 depicts a design for a simple switch, where blue represents hypdrophobized membrane and white represents hydrophilic membrane [11].
Even though plasma etching is reproducible, prevents damage to the filter paper by matching its flexibility, and is compatible with colorimetric assays, it also involves the use of organic solvents which is not ideal and can cause the confounding effects described above.
In a study by Fenton et al. in 2009, cutting was used to fabricate µPADs through a computer-controlled X-Y knife plotter to precisely cut patterns into nitrocellulose
membranes [7]. Three different paper-based designs were manufactured and are shown in Figure 4 [7].
13
The first design was fabricated by cutting polyester backed nitrocellulose membrane. This technique leaves the entire top surface of the nitrocellulose exposed to allow direct fluid introduction anywhere on the membrane. The second design consisted of placing polyester cover tape onto the surface of the nitrocellulose membrane and cutting both layers into the desired shape. A hole was previously cut in the cover tape layer to allow a fluid sample to be introduced to the membrane. For the third device, unbacked membrane was cut into the desired shape and placed between two layers of polyester cover tape. Inlets to the nitrocellulose membrane were either previously cut through the polyester cover tape or cut on the assembled device using the kiss cutting technique. In order to kiss cut, three sequential light cuts are performed on the polyester cover tape, ensuring only the polyester tape layer is cut leaving the nitrocellulose
membrane untouched. The kiss cut technique is also used to prevent tearing depending on the thickness and fragility of the membrane [7].
14
Inkjet-etching utilizes an inkjet printer to deposit the reagents needed to create hydrophilic channels in membranes [12]. In this fabrication process, the first step is to make the hydrophilic membrane hydrophobic. The membrane was hydrophobized by soaking it in a 1.0% wt polystyrene solution in toluene for 2 hours and allowing it to dry for 15 minutes at room temperature [12]. The hydrophilic channels were then etched in the now hydrophobic membrane by dispensing toluene from the inkjet printer. This process is described pictorially in Figure 5 [12].
On the bottom of Figure 5, the blue design is the computer template used by the printer to form the desired hydrophilic channels. The pink design is the filter paper after it has been etched with toluene by the inkjet printer. The toluene was dyed pink in order to visualize the hydrophilic channels. Wherever toluene is dispensed, it re-exposes the membrane by removing the hydrophobic polystyrene layer [12]. Even though this fabrication process utilizes a standard inkjet printer, it uses organic solvents to create the
15
hydrophobic barriers and hydrophilic channels. Organic solvents are not ideal to use for manufacturing these devices because it can affect the efficiency and accuracy of an immunoassay if not adequately removed from the device.
Wax printing is now being used, and is the method used in this thesis, to fabricate low-cost µPADs, because it is a very simple, time efficient, and cost-effective process [13]. It consists of two main steps, i) printing the channel patterns on the nitrocellulose membrane using a printer designed to print wax based ink and ii) melting the wax through the membrane to form the hydrophobic barriers through the entire thickness of the paper, as shown in Figure 6 [13].
Since paper is an anisotropic material, with more fibers aligned horizontally than vertically, the wax will spread more rapidly laterally when heated [13]. This is significant because it can affect the final dimensions of the channels; meaning the distance the wax will spread laterally during melting needs to be taken into account when designing the dimensions of the hydrophilic channels. The distance the wax will spread is described by Washburn’s equation
𝐿= (𝛾𝐷𝑡/4ƞ)1�2, 1
16
where L is the distance the wax will spread, 𝛾 is surface tension, ƞ is the viscosity of the wax, D is the average pore diameter of the membrane, and t is the time the molten wax is spreading due to capillary flow [13, 24]. Also the uneven spreading rate will make the hydrophobic barriers on the front of the paper thicker than the hydrophobic barriers on the back of the paper. This wax reflow causes the resolution of the hydrophobic barriers to be less than the resolution of the barriers produced through photolithography, but it is still adequate for diagnostic purposes [6].
Six different fabrication techniques to create hydrophilic channels in paper membranes have been thoroughly discussed. Figure 7 depicts the end-product of each fabrication technique.
Table I summarizes each method in order to clarify the issues associated with each one and to justify why wax printing was chosen.
Figure 7: Fabrication Method Summary. A) Photolithography, B) Plotting, C) Ink-jet Printing, D) Plasma Etching, E) Cutting, and F) Wax Printing fabrication
17
Table I: Fabrication Comparisons [6]
Fabrication Method Advantages Tolerances
Photolithography • Extensive variety of paper can be
patterned
• Very small channels can be made
• Hydrophilic areas are exposed to polymers/ organic solvents; could negatively affect assays
• Hydrophobic barriers are stiff
Plotting • Hydrophilic
channels not exposed to polymers/organic solvents
• Hydrophobic barriers are flexible
• Needs customized plotter
Inkjet-Etching • Used to deposit
reagents onto test zones while making hydrophilic channels
• Need customized printer
• Hydrophilic
channels exposed to polymers/organic solvents
Plasma Etching • Make many
replicates of few simple patterns
• Hydrophilic
channels exposed to polymers/organic solvents
• Metal masks need to be made for each pattern
Cutting • Hydrophilic
channels are not exposed to polymers/organic solvents
• Must be encased in tape to cut
• Can’t produce arrays of free-standing hydrophilic patterns
Wax Printing • Very fast procedure
• Uses commercially available devices • Hydrophilic channels not exposed to polymers/organic solvents
• Design of wax patterns must take into account wax reflow
18
Immunoassays
Once a µPAD is fabricated, the device needs to incorporate a method that allows multiple diseases to be detected. Colorimetric immunoassays are analytical methods used to determine the concentration of a desired analyte in a biological fluid sample by
producing a visual signal. The signal is a consequence of an analyte/labeled detector reagent immunocomplex binding to a capture reagent on the detection membrane [8]. The visual signal denoting successful detection can be accomplished by labeling detector reagents with enzymes, fluorescence, luminescence, or radioisotopes.
A widely implemented colorimetric assay is an enzyme-linked immunosorbent assay (ELISA). This type of assay utilizes an enzymatic label to produce a visual signal. There are two common ways to perform ELISAs; sandwich ELISAs and competitive ELISAs [14]. A basic sandwich ELISA starts by immobilizing a capture reagent, usually a specific antigen or antibody, in the detection zone [14]. Next, if the specific analyte is present in the sample, it will bind to the complementary capture reagent immobilized in the detection zone. An enzyme labeled conjugate detector reagent, usually an antibody, is added to detect and bind to the tethered immunocomplex. Finally, the enzyme’s substrate is added and reacts with the tethered enzyme labeled immunocomplex causing the
19
Competitive ELISAs start with an immobilized capture reagent [14]. Then the analyte in question and an enzyme labeled conjugate detector reagent are added simultaneously and compete to bind to the immobilized capture reagent. If the specific analyte is present in the sample, then it will bind to the immobilized capture reagent [14]. But if the specific analyte is not present, then the enzyme labeled detector reagent will bind [14]. When substrate is added and a color change occurs, it signifies that the specific analyte is not present in the fluid sample because the enzyme labeled conjugate antibody bound to the capture reagent. On the other hand, if there isn’t a color change, then the specified analyte was in the fluid sample and it bound to the immobilized capture reagent, thus preventing the enzyme labeled detector reagent from binding. The competitive ELISA is different than the sandwich ELISA because a positive result, color change, indicates the desired analyte is not present in the fluid, whereas a positive result for a sandwich ELISA meant the desired antibody was present. Figure 9 depicts a competitive ELISA [14].
20
The immunoassay examples described above used enzyme labeled antibodies to induce a color change when substrate was added to the labeled immunocomplex. Another signal indicator that is widely used is colloidal gold nanoparticles (Au-NPs) [15]. Au-NPs can be used for colorimetric immunoassays because they change color depending on the distance between individual Au-NP molecules, due to their surface plasmon resonance [15]. Figure 10 depicts how Au-NPs change color [16].
In Figure 10, Au-NPs aggregated because they were crosslinked with DNA [16]. When DNAse I was added, the crosslinks between the DNA and Au-NPs were cleaved and the Au-NPs moved away from each other. Once the distance between Au-NP molecules is 2.5 times the diameter of one Au-NP, the color will change to red [16]. For lateral flow immunoassays, the conjugate pad contains the Au-NP labeled antibodies. Once the Au-NP labeled detector agent binds to the analyte, they disperse and are tethered in the detection zone by the capture reagent. The dispersion and tethering of
Au-Figure 9: Competitive ELISA [14].
21
NP labeled immunocomplexes results in the production of a red signal at the detection zone, meaning positive detection has occurred [16]. According to Zhao et al, antibodies labeled with Au-NPs offer several advantages over enzyme labeled antibodies [15]. These advantages are Au-NPs are less expensive than enzymes, disposable, and can be stored for several weeks at room temperature without losing biosensing function. Also these immunoassays do not need to be completed in a lab, do not need expensive
equipment to analyze the color change, do not necessarily need highly trained personnel to perform the immunoassay, and are suitable for rapid, on site testing; the entire purpose of manufacturing paper based microfluidic diagnostic devices [6, 15].
In industry, antibodies are the most commonly implemented analyte detector and capture reagent for commercialized diagnostic platforms. Even though antibodies are successful in immunoassays such as ELISAs, they have disadvantages when used with paper-based lateral flow assays [17]. Immobilization of antibodies to the nitrocellulose membrane can cause them to become structurally unstable and can even cause
denaturation [17]. This will affect the sensitivity of the immunoassay and could lead to misdiagnosis. In order to fix these problems, aptamers can be implemented in
22
Project Specific Immunoassay
For this thesis, an immunoassay will be used that not only validates the platforms’ design but also validates the use of aptamers as viable capture reagent alternatives to antibodies. It’s important to choose an immunoassay that not only diagnoses a disease correctly but also is applicable to prevalent ailments in developing nations. As mentioned previously in this introduction, lower respiratory infections accounted for 7% of deaths in middle to low income countries in a study by WHO in 2008 [3]. This statistic shows a need for cost-efficient diagnostic devices for respiratory infections; however, due to limited resources and restrictions, live viral agents could not be used for testing in this thesis. Therefore, diagnosing bronchial asthma, another prevalent respiratory ailment in developing nations, was used to demonstrate device functionality.
According to WHO, bronchial asthma affects nearly 20% of the population in developing nations such as Kenya and countries in South America [18]. Not only is bronchial asthma a problem in developing nations, but it is also prevalent in developed nations as well; WHO states that between 100 and 150 million people worldwide are affected by bronchial asthma [18]. Even though bronchial asthma cannot be treated, it can be controlled if correctly diagnosed. Therefore, if there is a cost and time efficient way to test for this respiratory ailment then the standard of living for many can be improved.
23
an individual the severity of their asthma because the color intensity, determined by analyte concentration, can be correlated to disease severity through calibration curves.
Thus, for the purpose of this thesis, a modified sandwich immunoassay using fluorescein, FITC, labeled anti-IgE antibodies to detect human IgE serum in a fluid sample and biotinylated Anti-IgE antibody capture reagents was used to demonstrate the functionality of the diagnostic device. Even though Au-NPs are widely used for
colorimetric assays, FITC was used as the detector label because it was readily available for these experiments. For future studies, colloidal gold should be used as the detector label to allow results to be reported to the user without using microscopy instrumentation. Biotinylated Anti-IgE aptamers were also used as capture reagents in order to validate them as viable alternatives to antibodies for diagnostic purposes.
24
II MATERIALS AND METHODS
To address the goals and specific aims of this research project, devices and experimental methods were developed. More specifically, in the work presented here, the following were designed and fabricated; 3-D paper-based microfluidic devices and acrylic housing units with key pressure points to house the paper-based devices.
Additionally, experiments were designed and performed to characterize the fluid routing and assay performance of the µPADS. The following narrative explains the design process, fabrication and experimental methods used to validate the performance of 3-D, multiplex, paper-based microfluidic platforms. The design process consisted of four main stages: multiplex, paper-based platform design, housing unit design with
complementary COMSOLTM modeling, and performing immunoassay experiments on the platforms using both anti-bodies and DNA aptamers.
Multiplex Platform
The following sub-sections describe the experimental methods used for the four main design process stages listed above. These subsequent sections explain the
experimental methods used to perform a channel characterization study, a positive pressure application study, a membrane channel design study, a housing unit design study, and an immunoassay study.
Channel Characterization: Channel Widths
25
nitrocellulose membrane for the fluid routing layers, an ideal channel width for the cellulose membrane needed to be determined. Since 1.6 – 3.81 mm channels were optimal for backed nitrocellulose membrane, this range was used as a base for the cellulose membrane channel characterization study.
In order to determine the optimal fluid routing channel width for cellulose membranes, the following experiment was performed. A template of the fluid routing channels was designed using a student version of AutoCADTM. Figure 11 shows the AutoCADTM template used for the channel characterization experiment; the channel widths tested were 0.5, 1.0, 1.5, 2.0, 2.25, 2.50, and 2.75mm.
In order to create the hydrophobic barriers and the hydrophilic channels in the cellulose membrane, a wax-printing technique was implemented. The wax was printed onto the cellulose membrane using a Color Cube 8570 XEROX printer, shown in Figure 12.
26
By plotting the AutoCADTM templates to the wax printer, the channel designs were printed onto the membranes. After printing the wax on the cellulose membranes, it was melted through the entire thickness of the membrane using a Clarkson digital, ceramic top hot plate. The hot plate that was used can be seen in Figure 13.
Figure 12: XEROX Color Cube 8570 Wax Printer
27
The hot plate was warmed to 130 °C and the membrane was placed directly onto the ceramic top for 2 minutes. After 2 minutes elapsed, the wax should have penetrated to the other side of the membrane. If there were still patches of white on the back of the membrane, it was placed back onto the hot plate until the white patches filled. The membrane was then cooled for 2 minutes before testing.
A fluid sample consisting of red dye, shown in Figure 14, was used to easily visualize fluid movement through the cellulose membrane.
Using a 2-20 uL range pipette, 10 uL of red dye was placed onto the input port (left side) of each channel. The horizontal distance traveled by the red dye within a certain time limit was measured and recorded. From these distance measurements and time limits, fluid velocities were calculated and statistically analyzed using MATLAB to determine an optimal fluid routing channel width. The MATLAB code used to perform the statistical analysis can be found in Appendix B.
Positive Pressure Application
Once the optimal channel width was determined, an experiment was performed to observe how applying positive pressure to the membrane affects fluid velocity through
28
the membrane channels. This study consisted of two main parts. First, the velocities of fluid samples through 2.5 mm wide membrane channels without applying positive pressure were determined. Second, the velocities of fluid samples through 2.5 mm wide membrane channels placed under positive pressure were determined. The velocities from the two experimental groups were compared to see if they were statistically different. The membrane channel template for this experiment was designed in AutoCADTM and the drawing file can be seen in Figure 15.
The wax printing and melting protocol previously described in the channel characterization study was used to create twenty hydrophilic channels in the cellulose membrane. From the results of the channel characterization study, which are displayed in the Results section and analyzed in the Discussion section of this thesis, each channel was designed to be 2.5 mm wide. In Figure 15, the left column of ten channels was used in the study without pressure and the right column of ten channels was used in the study with positive pressure applied. The input ports were always on the left side of each channel.
29
For the first group of ten channels tested in this study, a 2-20 uL range pipette was used to load the input port of ten channels with 10 uL of red dye. Without positive
pressure being applied, the dye was allowed to travel through the membrane for 1 minute. The horizontal distance the fluid travelled through the membrane was measured and recorded. For the second part of this study, positive pressure was applied to the second set of ten channels by sandwiching the membrane between two acrylic sheets with hand clamps.
Once sandwiched with the input port outside of the acrylic in order to allow the red dye to be introduced to the membrane, a 2-20 uL range pipette was used to load 10 uL of dye onto the input port of each channel. The time it took for the dye to travel to the end of the channel, a distance of 5cm, was recorded. Fluid velocities were calculated from the data obtained from the two parts of this study. The velocities were statiscally analyzed using MATLAB to see if there was a significant difference in velocities due to positive pressure being applied to the membrane. The MATLAB code used to perform the statistical analysis can be found in Appendix B.
Single-Channel, Multi-Layered Platforms
30
consisted of an input layer, isolation layers, fluid routing layers, the conjugate layer, the detection layer, and an absorbent pad.
Conjugate Pad Characterization
The conjugate pad characterization study was performed to demonstrate vertical fluid routing through two layers of membrane and successful detector reagent
resolubilization. For this paper-based platform, the first layer was a fluid routing layer for sample introduction while the second layer was a conjugate pad containing detector reagent. For this study, red dye was used as a mock detector reagent in order to visualize fluid flow through the membrane channels. AutoCADTM was used to develop the channel and conjugate pad templates which can be seen on the left side of Figure 16.
Five different geometries for the conjugate pad were tested to qualitatively determine the best geometry for fluid routing in this layer. Since the conjugate pad is the site for reagent resolubilization, a uniform flow rate is desired as well as a slower flow rate than that of the other fluid routing channels. Having the flow rate slow down in the
1 2 3 4 5 1 2 3 4 5
Figure 16: AutoCADTM Template for the fluid routing layer and conjugate pad layer, with five conjugate pad geometries (left). The fluid routing layer and conjugate pad layer are placed on top of each other for conjugate pad characterization
31
conjugate pad will increase the time the detector reagent is in contact with the fluid thus increasing the chance of it resolubilizing and moving through the rest of the device layers successfully [9]. The wax printing and melting protocol previously described in the channel characterization study was used to create this two layer chip. Using a 2-20 uL range pipette, 10 uL of red dye was pipetted onto the center of each of the five geometries of the conjugate pad layer and dried at room temperature for 45 minutes.
Then, the conjugate pad was placed on top of the fluid routing layer, depicted on the right side of Figure 16. The combined layers were sandwiched between two acrylic sheets with the input port outside of the acrylic. This allows a fluid sample to be
introduced to the membrane. Positive pressure was then applied by clamping the acrylic plates with hand clamps. Using a 20-200 uL range pipette, 50 uL of water was introduced to the input port (left side of channels) and allowed to route through the two layers of membrane.
Single-Channel, Multi-Layer Platform: Functional Dye Test
The next step was to fabricate a 3-D paper-based platform utilizing the optimal channel geometries determined in the previous experiments. Demonstration of a fluid sample successfully routing through multiple layers of membrane using positive pressure instead of coupling agents, as well as successful resolubilization and routing of detector reagent from the conjugate pad through the remaining membrane layers of the platform, needed to be completed.
32
absorbent pad until after passing the detection zones. Then the sample pad layer, also referred to as the first fluid routing layer was introduced. The conjugate pad was placed on top of this first fluid routing layer. After the fluid sample passed through the conjugate pad it was routed to a second fluid routing layer. The detection layer, containing the detection zones, was placed on top of the second routing layer. Once the fluid passed through the detection zones, it was routed down to the absorbent pad. A pictorial representation of the multi-layer chip can be seen in Figure 17.
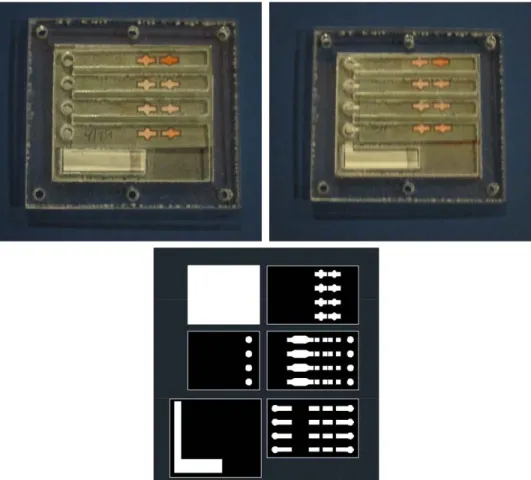
After determining the number of layers and their placement in the platform, AutoCADTM was used to design the wax printing templates, Figure 18.
33
In Figure 18, the layers, described from the bottom to the top of the image are the following: absorbent pad (white), isolation layer (black), first fluid routing layer (black), conjugate pad (red), second fluid routing layer (black), detection regions (green). There are three single-channel, multi-layer platforms in this drawing, only the middle channel was allowed to route fluid to the absorbent pad. The same wax printing and melting protocol previously described in the channel characterization study was used for the fabrication of this platform. Once the fluid routing layers were created, the platform was assembled and tested with red dye to demonstrate device functionality.
Using a 2-20 uL range pipette, 2 uL of red dye was spotted onto the conjugate pad and dried at room temperature for approximately 45 minutes. The platform was
assembled by placing the six layers of membrane on top of each other in the following order: absorbent pad, isolation layer, first fluid routing layer, conjugate pad over the middle of the channels on the first fluid routing layer, second fluid routing layer placed over the ends of the channels in the first fluid routing layer, and detection layer placed in the middle of the channels in the second fluid routing layer. Once assembled, the
Figure 18: AutoCADTM Template of Single-Channel,
34
combined layers were sandwiched between two acrylic sheets with the input ports outside of the acrylic to allow a fluid sample to be introduced to the membrane. Positive pressure was then applied by clamping the acrylic plates together.
Using a 20-200 uL range pipette, 100 uL of D.I. water was introduced to the first fluid routing layer of the platform at the sample input ports. The sample input ports were located at the left end of each channel in the first fluid routing layer. The fluid sample was allowed to route through all the layers of the platform.
3-D Multiplex Platforms
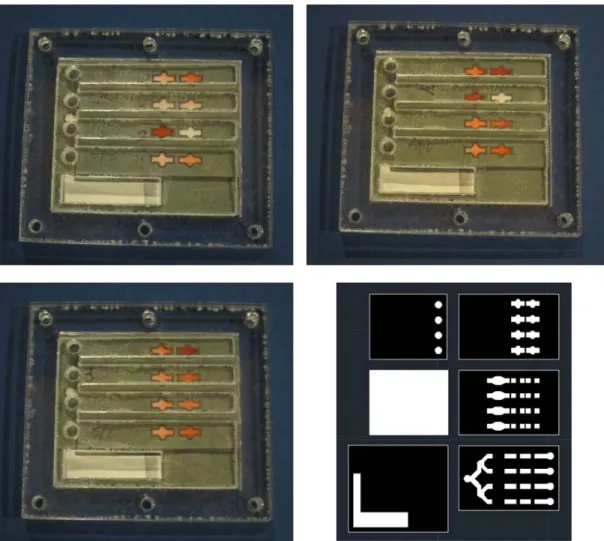
For the previous experiments, positive pressure was applied to the paper-based platforms by clamping two acrylic plates with hand clamps. In order to design the final multiplex platform, a housing unit needed to be created that could apply adequate and even pressure across the platform to allow fluid to flow through the multiple channels and layers. Not only was it important for the fluid sample to be routed throughout the device, it was important that the development time of each detection region be consistent as well. Development time was defined as the time it took a fluid sample to be introduced at the input port and routed to the end of the second detection zone of each channel in the multiplex platform. In order to test different housing unit designs, multiple 3-D multiplex platforms were designed.
Multiplex Platform: Membrane Designs
35
to route fluid to eight detection zones. As testing occurred, the channel design and number of layers incorporated were altered in order to improve fluid routing throughout the device; this resulted in the creation of five different membrane designs. The
AutoCAD templates for the five multiplex platform designs are shown in Figure 19.
The same wax printing and melting protocol previously described in the channel characterization study was used for fabricating the multiplex platform. The following directions explain the assembly process for the multiplex platforms. Membrane design 5 will be used as the explanatory example, however it is important to note that all designs were assembled using the same process.
36
Step 1: The sample input layer was placed in the recessed area of the housing unit’s bottom half, Figure 20.
Step 2: The absorbent pad was placed on the sample input layer with the upper right hand corners of the layers aligned, Figure 21.
Step 3: The isolation layer was placed over the absorbent pad. The absorbent pad and isolation layer do not cover the entire length of the platform. This prevented
Figure 20: Step 1 of assembly protocol showing the placement of the sample input
layer.
37
the fluid sample from routing directly to the absorbent pad from the input port, Figure 22.
Step 4: The fluid routing layer was placed on top of the isolation layer. This layer divides the single input channel into four fluid routing channels, Figure 23.
Figure 23: Step 3 of assembly protocol showing the placement of the isolation layer.
38
Step 5: The conjugate pad was placed on top of the fluid routing layer. The upper right hand corners of the layers were lined up to ensure proper channel alignment, Figure 24.
Step 6: The detection layer was placed on top of the conjugate pad. The upper right hand corners of the layers were lined up to ensure proper channel alignment, Figure 25.
Figure 24: Step 5 of assembly protocol showing the placement of the conjugate pad.
39
Step 7: The upper half of the housing unit was placed on top of the assembled layers, Figure 26.
Step 8: The bottom and top halves of the housing unit were secured with nuts and bolts, Figure 27.
The functions of the nuts and bolts were to keep the housing unit halves together as well as to supply the positive pressure needed to route fluid through multiple layers of membrane. The amount of positive pressure applied to the membrane is related to how
Figure 26: Step 7 in assembly protocol showing the placement of the housing unit
cover.
Figure 27: Step 8 in assembly protocol showing how to secure the housing unit with nuts and
40
tightly the nuts and bolts were fastened. It was important to determine how tight to secure the nuts and bolts to allow consistent fluid flow through the membrane. In a study
performed by Sarah Klemm, it was shown that the best development times of a single-channel, multi-layer platform were achieved when the nuts were tightened ¼ of a turn past initial contact with the surface of the housing unit’s bottom half [21]. Therefore the housing unit halves were secured by tightening the nuts ¼ of a turn past initial contact with the acrylic housing unit.
The housing units and membrane layer platforms were designed and assembled to allow a fluid sample to be routed from the input port up through the conjugate pad and then through the detection layer before being routed back down to the absorbent pad.
Housing Unit Designs
In order to determine correct placement of pressure application onto the
41
The second design had the same pressure tabs as design 1, but had twelve bolts securing the two halves of the housing unit. The twelve screws were spaced equally around the perimeter of the housing unit, Figure 29.
Figure 29: Housing Design 2
The third design had the same screw placement as the second design, but had different pressure tabs. The pressure tabs on this design fully covered the channels up until the conjugate pad. After the conjugate pad, the pressure tabs lined the outside of the channels thereby applying pressure on the membrane bordering the channels and the detection zones, Figure 30.
42
Figure 30: Housing Design 3
The fourth and final housing design had the same screw placement as the second and third designs, but had different pressure tabs. The pressure tabs on this design applied pressure onto the membrane bordering the channels throughout the entire length of the platform, Figure 31.
43
The different placements of the pressure tabs were chosen in order to determine if direct positive pressure or indirect positive pressure on the membrane channels would aid uniform flow.
The four housing units were manufactured out of 0.075” acrylic sheets. A CO2
Laser System was used to cut the acrylic into the pieces needed to construct the housing unit. AutoCADTM was used to create the design templates used by the laser cutter to create the housing unit pieces, shown in Figure 32.
The AutoCADTM templates were plotted to the laser cutter. The line color in the template was set to red because the laser cutter was programmed to make vector cuts along red lines. This is important because a vector cut tells the laser to cut through the entire thickness of the material it is cutting. The laser settings were changed to 0.075 inch, acrylic with a line weight of 0.00. The line weight is important because it signifies
44
how wide to make the cut. Since it was set to 0.00, the laser only cut once over each line creating the correct geometric dimensions.
As can be seen in the AutoCADTM drawing in Figure 32, each housing unit consisted of four different pieces. The bottom two pieces for each design were joined together with acrylic glue to create the bottom half of the housing unit. The top two pieces for each design were also joined together with acrylic glue to create the top half of the housing unit.
Housing Unit Design: COMSOLTM Model
In order to aid the housing unit design process, a computer model was created using COMSOLTM Multiphysics software. A computer model can be an efficient tool when implemented during initial design phases. Decisions about final product designs can be determined before prototypes are produced and tested, because different parameters can be applied to the model and the potential outcomes are portrayed. If a sound computational model is created, it has the potential to save time and money by eliminating potentially faulty designs earlier in the design process. For this thesis, COMSOLTM was used to help determine the number and placement of fasteners needed for the housing unit. It was important to determine the quantity and design the position of the fasteners in a way that allowed adequate application of positive pressure to the membrane layers in order to augment fluid routing and provide connectivity between layers. Eventually, this model can be improved upon to help determine an ideal pressure that will enable uniform flow through the platform and fast development times.
45
pressure tabs. The housing unit geometry, using COMSOLTM’s CAD module, consisted of the upper half of housing unit designs 1 or 2 and a layer of cellulose membrane. The size of the models was scaled to the actual size of the devices. COMSOLTM allows material properties to be assigned to the different domains, geometry components, of the model. The materials used to build the model were acrylic for the housing unit, steel for the bolts, and cellulose for the membrane. The mechanical properties of each material, needed to perform the computational analysis, can be found in Table II.
Table II: COMSOLTM Material Properties
Material Density [kg/m3] Young’s Modulus
[Pa] Poisson’s Ratio
acrylic* 1190 3.2e9 0.35
steel* 7850 205e9 0.28
cellulose 1500 2.0e9** 0.1***
*acrylic and steel properties found in COMSOL material library,** [22],*** [23]
Next, boundary conditions were assigned to the different sub-domains, or geometry surfaces. The bottom surfaces of the nuts and the cellulose membrane were assigned fixed constraints. A boundary load was assigned to the top surfaces of the bolts; this boundary load represents the bolt axial force of the fastened bolts on an assembled device. Finally a contact pair was created between the bottom face of the housing unit and the upper face of the cellulose membrane to allow contact pressure to be analyzed.
The study consisted of running three simulations. The housing design and applied boundary loads for the three simulations are summarized in Table III.
Table III: COMSOLTM Boundary Loads
Simulation # Housing Design
# : # of bolts Load [lb]
Applied Boundary Load [psi] Applied Boundary Load [Pa]
1 1 : 6 bolts 1 80.3 553312
2 2 : 12 bolts 1 80.3 553312
46
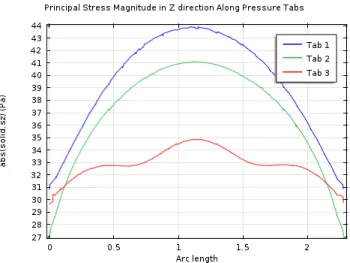
After running the simulations, total surface displacement and contact pressure surface plots were obtained. Also line plots for the principle stress magnitudes, pressures, in the z-direction along each pressure tab were obtained. The figures of these surface and line plots can be found in the results section and are further explained in the discussion section of this thesis.
Development Time Tests: Multiplex Platform
Once the housing units were created, development time tests were performed in order to determine which housing design and membrane channel design were optimal. After producing the membrane layers using the wax printing and melting protocol
described in the channel characterization study, a 2-20 uL range pipette was used to place 2 uL of red dye onto the middle of each conjugate pad and dried at room temperature for 45 minutes. After the conjugate pads dried, the 3-D multiplex platform was assembled according to the assembly protocol described in the multiplex platform design section of this thesis.
47
Table IV: Membrane Channel Design and Housing Unit Design Combination
Housing Unit Design
Design 1 Design 2 Design 3 Design 4 Membrane
Channel Design
Design 1 X
Design 2 X
Design 3 X X X
Design 4 X X X
Design 5 X
Biochemistry
In order to demonstrate the possible diagnostic capabilities of the final device, immunoassays utilizing both biotinylated antibody and aptamer capture reagents were performed on the final 3-D multiplex platform.
Aptamer vs Antibody Capture Reagents
48
the platform [9]. Dimensional drawings of membrane design 5 and housing unit design 2 can be found in Appendix A.
Solution and Membrane Preparations
For the purpose of this thesis, FITC labeled goat anti-human IgE antibodies were used to detect human plasma IgE. The capture reagents used in the antibody and aptamer immunoassays were biotinylated anti-IgE antibody and biotinylated IgE aptamers
respectively. A previous study performed in our lab found that the nitrocellulose
membranes cracked during a heat treatment phase of the capture reagent immobilization procedure [10]. In order to prevent the nitrocellulose membrane from cracking,
streptavidin was used to immobilize the biotinylated capture reagents. Streptavidin is a protein that can bind to materials at room temperature and biotinylated molecules can bind to streptavidin at room temperature [24]. This is important because it eliminates heat treatments during immobilization, thus preventing membrane cracking.
![Figure 3 depicts a design for a simple switch, where blue represents hypdrophobized membrane and white represents hydrophilic membrane [11]](https://thumb-us.123doks.com/thumbv2/123dok_us/8227848.2181054/28.918.221.751.211.448/figure-depicts-represents-hypdrophobized-membrane-represents-hydrophilic-membrane.webp)
![Figure 5: Inkjet Etching Fabrication Methods [12].](https://thumb-us.123doks.com/thumbv2/123dok_us/8227848.2181054/30.918.307.664.402.744/figure-inkjet-etching-fabrication-methods.webp)
![Figure 10: Colloidal Gold Nanoparticles as Detector Label in Colorimetric Assay [16].](https://thumb-us.123doks.com/thumbv2/123dok_us/8227848.2181054/36.918.231.763.583.757/figure-colloidal-gold-nanoparticles-detector-label-colorimetric-assay.webp)