Decoding the Regulatory Landscape of
Ageing in Musculoskeletal Engineered Tissues
Using Genome-Wide DNA Methylation and
RNASeq
Mandy Jayne Peffers1*, Katarzyna Goljanek-Whysall1, John Collins2, Yongxiang Fang3, Michael Rushton4, John Loughlin4, Carole Proctor4,5, Peter David Clegg1
1Institute of Ageing and Chronic Disease, University of Liverpool, Leahurst, Chester High Road, Neston, Wirral, UK, CH64 7TE,2Thurston Arthritis Research Centre, School Of Medicine, University of North Carolina at Chapel Hill, Chapel Hill, North Carolina, USA, 27599,3Centre for Genomic Research, Institute of Integrative Biology, Biosciences Building, Crown Street, University of Liverpool, Liverpool, UK, L69 7ZB,
4Musculoskeletal Research Group, Institute of Cellular Medicine, Newcastle University, Newcastle upon Tyne, UK, NE2 4HH,5Newcastle University Institute for Ageing, Newcastle University, Campus for Ageing and Vitality, Newcastle upon Tyne, UK, NE4 5PL
Abstract
Mesenchymal stem cells (MSC) are capable of multipotent differentiation into connective tissues and as such are an attractive source for autologous cell-based regenerative medi-cine and tissue engineering. Epigenetic mechanisms, like DNA methylation, contribute to the changes in gene expression in ageing. However there was a lack of sufficient knowl-edge of the role that differential methylation plays during chondrogenic, osteogenic and tenogenic differentiation from ageing MSCs. This study undertook genome level determina-tion of the effects of DNA methyladetermina-tion on expression in engineered tissues from chronologi-cally aged MSCs. We compiled unique DNA methylation signatures from chondrogenic, osteogenic, and tenogenic engineered tissues derived from young; n = 4 (21.8 years±2.4 SD) and old; n = 4 (65.5 years±8.3SD) human MSCs donors using the Illumina Human-Methylation 450 Beadchip arrays and compared these to gene expression by RNA sequencing. Unique and common signatures of global DNA methylation were identified. There were 201, 67 and 32 chondrogenic, osteogenic and tenogenic age-related DE pro-tein-coding genes respectively. Findings inferred the nature of the transcript networks was predominantly for‘cell death and survival’,‘cell morphology’, and‘cell growth and prolifera-tion’. Further studies are required to validate if this gene expression effect translates to cell events. Alternative splicing (AS) was dysregulated in ageing with 119, 21 and 9 differential splicing events identified in chondrogenic, osteogenic and tenogenic respectively, and enrichment in genes associated principally with metabolic processes. Gene ontology analy-sis of differentially methylated loci indicated age-related enrichment for all engineered tissue types in‘skeletal system morphogenesis’,‘regulation of cell proliferation’and‘regulation of transcription’suggesting that dynamic epigenetic modifications may occur in genes associ-ated with shared and distinct pathways dependent upon engineered tissue type. An altered a11111
OPEN ACCESS
Citation:Peffers MJ, Goljanek-Whysall K, Collins J, Fang Y, Rushton M, Loughlin J, et al. (2016) Decoding the Regulatory Landscape of Ageing in Musculoskeletal Engineered Tissues Using Genome-Wide DNA Methylation and RNASeq. PLoS ONE 11 (8): e0160517. doi:10.1371/journal.pone.0160517
Editor:Stan Gronthos, The University of Adelaide, AUSTRALIA
Received:April 22, 2016
Accepted:July 20, 2016
Published:August 17, 2016
Copyright:© 2016 Peffers et al. This is an open access article distributed under the terms of the
Creative Commons Attribution License, which permits unrestricted use, distribution, and reproduction in any medium, provided the original author and source are credited.
Data Availability Statement:Sequence data have been submitted to National Centre for Biotechnology Information Gene Expression Omnibus (NCBI GEO) under Array Express accession number E-MTAB-3427.
Funding:This work was supported by the Wellcome Trustwww.welccometrust.ac.uk(WT088557MA) to MJP, Medical Research Council (MRC) and Arthritis Research UK as part of the MRC-Arthritis Research UK Centre for Integrated research into
phenotype in engineered tissues was observed with ageing at numerous levels. These changes represent novel insights into the ageing process, with implications for stem cell therapies in older patients. In addition we have identified a number of tissue-dependant pathways, which warrant further studies.
Introduction
The limited ability of articular cartilage, bone and tendon to regenerate has prompted the development of cell-based tissue engineering techniques. One cell therapy option is mesenchy-mal stem cells (MSC); a heterogeneous population of multi-potent cells with the ability to dif-ferentiation into tissues including cartilage, bone and tendon, thus accommodating tissue repair and homeostasis. The principles of tissue engineering involve a multifarious interaction of factors, and knowledge of the extent MSC phenotype and differentiation capacity alter with ageing is limited. Subsequently, any loss in functionality with age would have profound conse-quences for the maintenance of tissue viability and the quality of tissues. MSCs have been uti-lised in clinical trials of cell therapies for cartilage repair and osteoarthritis (reviewed [1]), bone fracture treatment [2] and in a limited number of tendon therapies [3]. However, the therapeu-tic efficiency of MSCs for clinical applications remains limited, possibly due to the attenuation of their regenerative potential in aged patients with chronic diseases.
Advancing age is a prominent risk factor that is closely linked with the onset and progres-sion of diseases such as osteoarthritis, osteoporosis and tendinopathy. Understanding the influ-ence that ageing has on chondrogenic, osteogenic and tenogenic progenitor cells such as MSCs is important in determining how these processes affect their capacity to differentiate into func-tional chondrocytes, osteoblasts and tenocytes for use in therapeutic applications. A model using MSCs derived from young and old donors to musculoskeletal engineered tissues could aid in our understanding of musculoskeletal ageing.
To understand the underlying mechanisms that are responsible for age-related changes in musculoskeletal engineered tissues, a number of studies have been undertaken on ageing MSCs (reviewed [4]), as well as the differentiation potential of tissue engineered cartilage [5] and bone [6], though no studies have addressed these questions in tendon.
There are a few studies investigating the effect of chronological age of donor MSC on engi-neered tissues, some with conflicting findings. One study found a reduction in glycosaminogly-cans in chondrogenesis with age [7] whereas another experiment using a wider donor age-range found no change [8]. Contrasting results of the chondrogenic differentiation potential of adult MSCs has been described with one study reporting age independence [9], whilst another demonstrated a negative correlation with advancing age in male but not female donors [10]. A study demonstrated that foetal and adult MSCs are differentially regulated by transforming growth factor-βstimuli to activate the onset of chondrogenesis, suggesting that discrete age-related mechanisms direct chondrogenic regulation following development and postnatal mat-uration [11].
Age-related changes in osteogenesis have been more widely studied. Osteogenic progenitors in MSCs derived from rat bone marrow demonstrated an age-related decline. In addition MSCs from young rats had a significantly greater bone formation capabilityin vivocompared with aged rats [12]. The osteogenic potential of MSCs is independent of advancing age in adult human donors [13]. However, a decline in the osteogenic precursor population, due to acceler-ated senescence and lower rate of population doublings in MSCs isolacceler-ated from older donors role in study design, data collection and analysis,
decision to publish, or preparation of the manuscript.
suggests a reduction in osteoblast formation. This may contribute to the age-related reduction in bone formation in the elderly [14]. In age-related studies of osteogenic differentiation one group identified an increase in alkaline phosphatase with age [15] whilst another demonstrated a decrease [16]. It is thought these discrepancies could be due to the heterogeneous population which is propagated within and amongst donor populations.
Few studies have investigated the effects of ageing MSCs on tendon tissue engineering. However, one study on human tendon stem cells from aged tendons described reduced prolif-eration capacity and premature entry into senescence [17]. A recent study in rat tendon-derived stem cells from older donors demonstrated earlier entry into senescence which was postulated to be due to a reduction in the levels of miRNA-135a, a ROCK-1 targeting micro-RNA (miR) that blocks entry into senescence pathways. This may be due to a reduction in miR-135a, which binds to ROCK-1 and inhibits entry into senescence in young tendon. Thus a decrease in miR-135a in older tendon may be the cause of reduced stem cell proliferation, self-renewal and tenogenic differentiation [18].
The advent of global DNA methylation arrays and RNASeq studies have made it possible to explore gene methylation and/or expression during cell development [19], tissue differentiation [20], disease [21] and ageing [22,23]. In addition, the global relationship between gene methyl-ation and expression can now be investigated in ageing [24]. Whilst global methylmethyl-ation and RNASeq are powerful tools to study methylation variation and transcription changes, no joint analysis with these two types of data have been reported in tissue engineering. Tissue engineer-ing aims to develop biomimetic tissues that recapitulate biological, structural and functional characteristics of native tissue. Thus age-related changes have potential implications for the tis-sue engineering strategies used for enhancing musculoskeletal repair. In this study we evaluated and compared the methylome and transcriptome of chondrogenic, osteogenic and tenogenic engineered tissues derived from young and old human bone marrow derived MSCs in order to determine similar and distinct changes with ageing. In doing so we have identified areas for future research to improve functionality of ageing MSC derived engineered tissues.
Materials and Methods
All chemicals are supplied by Sigma unless stated otherwise.
Cell Culture and Differentiation
Human MSCs from young; n = 4 (21.8years±2.4SD) and old; n = 4 (65.5years±8.3SD) donors (Stem Cell Technologies, Grenoble, France and Promocell, Heidelberg, Germany), grown to passage 4 and each donor each differentiated into chondrogenic [25], osteogenic [26] and teno-genic [27] tissues as previously described and used in all subsequent experiments [28]. All tis-sue culture was undertaken in 5% oxygen and tistis-sues harvested at 21 days (osteogenic) and 28 days (chondrogenic and tenogenic). All cells were purchased and thus ethical approval was not required.
Validation of differentiation
paraformaldehyde, longitudinally embedded in paraffin and 4μm sectioned on polylysine slides. Staining was undertaken with Masson’s Trichrome [30].
Transmission electron microscopy (TEM) of tendon tissues were performed by fixation in 2.5% glutaraldehyde in 0.1M sodium cacodylate buffer followed for 8 hours, followed by buffer washing procedure and second fixation and contrast stain with 0.1% osmium tetroxide for 90 minutes. Samples were stained with 8% uranyl acetate in 0.69% maleic acid for 90 minutes, dehydrated in ascending ethanol concentrations and embedded in epoxy resin. 60–90 nm sec-tions were cut with a Reichert- Jung Ultracut on an ultramicrotome using a diamond knife, mounted on 200 mesh copper grids and stained with‘Reynold’s Lead citrate’stain for 4 min-utes. Images were viewed in Philips EM208S Transmission Electron Microscope at 80k.
RNA was extracted from all assays and converted to cDNA to analyse lineage-specific gene expression markers using qRT-PCR relative to GAPDH [22]. All primer sequences are inS1 file.
RNA isolation, library preparation for RNASeq and small RNASeq and
sequencing
Total RNA was isolated using TRIzol (Invitrogen™Life Technologies, Carlsbad, USA) [31] and purified using RNeasy spin columns with on-column DNase treatment (Qiagen, Crawley, UK). Sequencing used the Illumina HiSeq 2000 (Illumina, San Diego, USA) at 2 × 100-base pair (bp) paired-end sequencing with v3 chemistry for RNASeq. Multiplexed size selected small RNA library pools were sequenced on one lane of the Illumina HiSeq 2500 (Illumina, San Diego, USA) at 1x50 bp sequencing. Details are inS2 fileand [24].
RNA Data processing
The RNASeq data was processed as previously described [22,24]. Concise details are inS2 file. Data was assessed using pairwise comparisons, correlation heatmaps and PCA plots and outli-ers removed accordingly. For RNASeq and smallSeq differentially expressed genes (DEGs) and transcripts were extracted by applying the threshold of false discovery rate (FDR) adjusted p-values<0.05, generated using the Benjamini and Hochberg approach [32] and a 1.4 log2fold
change (Log2FC). Sequence data have been submitted to National Centre for Biotechnology
Information Gene Expression Omnibus (NCBI GEO) under Array Express accession number E-MTAB-3427.
Genomic DNA isolation, bisulphite treatment and methylation profiling
Genomic DNA was extracted using the SureSelect gDNA Extraction Kit (Agilent, Santa Clara, USA) according to manufacturer’s instructions, 500 ng of genomic DNA was then bisulphite converted using the EZ-96 DNA Methylation Kit (Zymo Research, Irvine, USA). DNA methyl-ation profiling of the samples was carried out by Cambridge Genomic Services (Cambridge, UK), using the Illumina Infinium HumanMethylation450 Beadchip array (Illumina, Inc., San Diego, USA).Methylation data processing
differential methylation was defined as Benjamini—Hochberg corrected P value [32]<0.01 or
<0.05 (differentially methylated loci (DML) and gene/CpG island/promoter respectively) and a mean methylation difference (Δ βscore)0.15 (15%), as previously reported [34].
Functional analysis of transcriptomic and methylation data
To determine gene ontology, functional analyses, networks, canonical pathways and protein-protein interactions of age-related differentially expressed genes and methylated genes we per-formed analyses using Panther Classification System [35] and the functional analysis and clus-tering tool from the Database for Annotation, Visualisation, and Integrated Discovery (DAVID bioinformatics resources 6.7) [36] (using expressed genes as a reference), Ingenuity Pathway Analysis (IPA) [37]. Targetscan v6.2 was used to identify potential miR [38].
Relative gene expression using real-time polymerase chain reaction
(
qRT-PCR)
qRT-PCR was undertaken on engineered tissues from similarly sourced MSCs at P4 from an independent cohort from those used for the RNA-Seq analysis young; n = 3 (22.2years±2.3SD) and old; n = 3 (64.8years±6.6SD). Primers were either validated in previous publications [23, 39] and supplied by Eurogentec (Seraing, Belgium) or designed and validated commercially (Primer Design, Southampton, UK). Steady-state transcript abundance of potential endoge-nous control genes was measured in the RNA-Seq data. Assays for four genes—Glutaraldehyde dehydrogenase (GAPDH), ribosomal protein 13 (RPS8), ribosomal protein 13 (RPS13), and ribosomal protein 16 (RPS16) were selected as potential reference genes as their expression was unaltered. Stability of this panel of genes was assessed by applying a gene stability algorithm [40]. RPS8 was selected as the most stable endogenous control gene. For miRs cDNA synthesis was performed using 100 ng RNA and miRscript RT kit II (Qiagen, Crawley, UK) according to the manufacturer’s protocol. qRT-PCR analysis was performed using miRScript SybrGreen Mastermix (Qiagen, Crawley, UK) using Rnu-6 as the endogenous control. Relative expression levels were calculated by using the 2−ΔCt method [40]. Data were analysed statistically using GraphPad Prism 6 (GraphPad Software, San Diego, CA, USA) following normality testing using a Mann-Whitney test at a 0.05 level of significance.
Results
Characterisation of engineered tissues
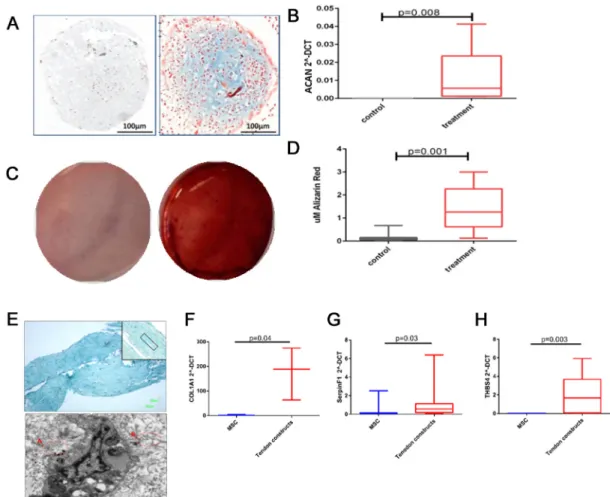
To evaluate chondrogenesis markers of chondrocytes were assessed; Alcian Blue staining for glycosaminoglycans and aggrecan gene expression. There was an increase in Alcian Blue stain-ing and aggrecan (ACAN) expression (Fig 1A and 1B). Osteogenesis was evaluated with Aliza-rin Red staining. There was a significant increase in staining with AlizaAliza-rin Red both visually and using quantitative analysis (Fig 1C and 1D) demonstrating osteogenesis. Tenogenic differ-entiation was evaluated histologically using Masson’s Trichrome staining indicating areas of organised and disorganised collagen fibril formation within the tissues which were confirmed with TEM and gene expression of COL1A1 (Fig 1E and 1F), Serpin peptidase inhibitor F (SER-PINF1) (Fig 1G) and thrombospondin 4 (THBS4) (Fig 1H) [41]. There were no age-related dif-ferences in the differentiation markers measured (data not shown).
Overview of RNASeq and smallSeq data
assessment one young and one old sample from chondrogenic were classed as outliers and removed from subsequent data analysis. Mapping results are summarised in theS3 file. Of the 63,152 human genes, between 39.9% and 47% had at least one read aligned [42]. This is similar to the output of other RNA-Seq studies [43]
In the smallSeq data an average of 12.2 million 50bp single-end reads was generated. This represented an average of 44% of reads mapped. Many of the 4206 human small RNAs were mapped with at least one read; 21.5–38.5% within all samples. Mapping results are summarised inS4 fileand are similar to other small RNASeq studies [44,45]. Reads were used to estimate Fig 1. Histochemical and gene expression analysis of chondrogenic, osteogenic and tenogenic lineage differentiation for MSCs.Images are representative of all experiments. a; MSC pellets cultured in control or chondrogenic media were fixed and stained with Alcian Blue (scale bar 100μm, young donor shown) b;. Gene expression of aggrecan following chondrogenic differentiation, young and old donors combined. Data are represented as 2^-DCT compared with GAPDH. Box and whisker plots represent the median and 25–75 percentiles. Statistical evaluation was undertaken using Mann Whitney-U test (n = 6). c; Osteogenic differentiation from MSCs was confirmed with Alizarin Red S staining at day 21 to visualize mineralized bone matrix following extraction of the calcified mineral from the stained monolayer at low pH (young donor shown). d; Box and whisker plot showing quantitative results of Alizarin red staining of all donors, statistical significance Mann-Whitney-U test p<0.001 (n = 12). e; Histology images of a tendon engineered tissue (young donor shown) made from MSCs stained with Masson’s Trichrome to identify collagenous matrix. Image was captured at x4 magnification and x10 magnification inset (upper image); scale bar is 100μm. Example of more organised areas of collagen is marked on the inset image. Lower image depicts ultrastructural analysis using scanning transmission electron microscopy. The presence of aligned
extracellular collagen fibrils (A) and less organised collagen (B) are inset in red; scale bar is 1μm. Tenogenic differentiation was also evaluated with using gene expression of f; COL1A1, g; SERPINF1 and h; THBS4. Data from all donors are represented as 2^-DCT compared with GAPDH. Statistical evaluation was undertaken using Mann Whitney-U test (n = 8).
small RNA transcript expression of all samples using FPKM in order to identify the most abun-dant miRs and small nucleolar RNAs (snoRNAs).S5 filedemonstrates the expression levels of the entire data set and highlights the top 10 highly expressed small RNAs genes within each class.
Identification of differentially expressed genes and differentially spliced
genes using RNASeq
For RNASeq a principal component analysis (PCA) plot (Fig 2A) of log2gene expression data
identified age-related biological variation within all engineered tissue groups. Hierarchical clus-tering using a sample to sample distance matrix identified clusclus-tering principally by engineered tissue type (Fig 2B).
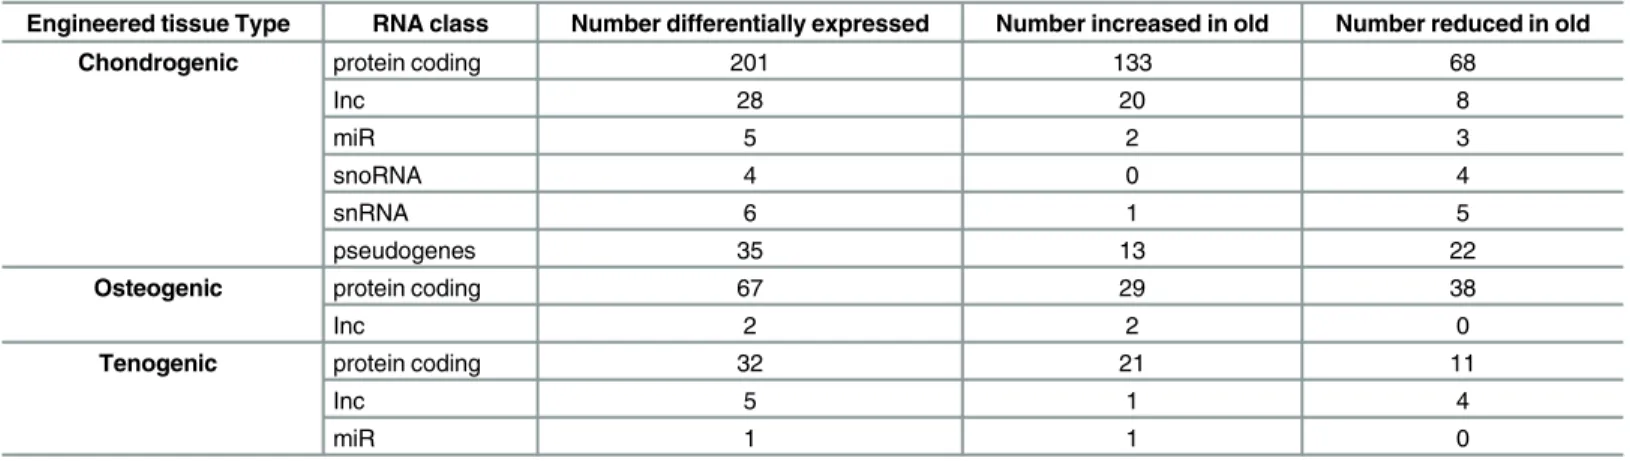
Sets of age-related differentially expressed (DE) genes were identified including protein-coding RNA, long non-protein-coding RNA (lnc), small nucleolar RNA (snoRNA), small nuclear RNA (snRNA), pseudogenes and miRs (Table 1) (±1.4 log2 fold change, FDR<0.05). There were 201, 67 and 32 chondrogenic, osteogenic and tenogenic age-related DE protein-coding genes respectively (Fig 2C).Table 2represents the top 10 most differentially expressed up and down chondrogenic, osteogenic and tenogenic tissues. All DE genes are inS6 file.S7 filecontains FPKM values for all samples,S8 filecontains the MA plots for RNASeq and smallSeq.
In total 94190±3005 chondrogenic, 116105 ±3008 osteogenic, and 113075±5346 tenogenic isoforms were detected (mean±standard deviation)). No isoforms were differentially expressed. However, using Cuffdiff to calculate changes in the relative splice abundances by quantifying the square root of the Jensen-Shannon divergence on primary transcripts with at least two iso-forms, identified 119, 21 and 9 differential splicing events in chondrogenic, osteogenic and tenogenic tissues respectively (alternative splicing (AS)) (S9 file). These included small nucleo-lar RNAs, long non-coding RNAs and pseudogenes.
For the smallSeq PCA of log2gene expression data indicated the age-effect was weak (Fig
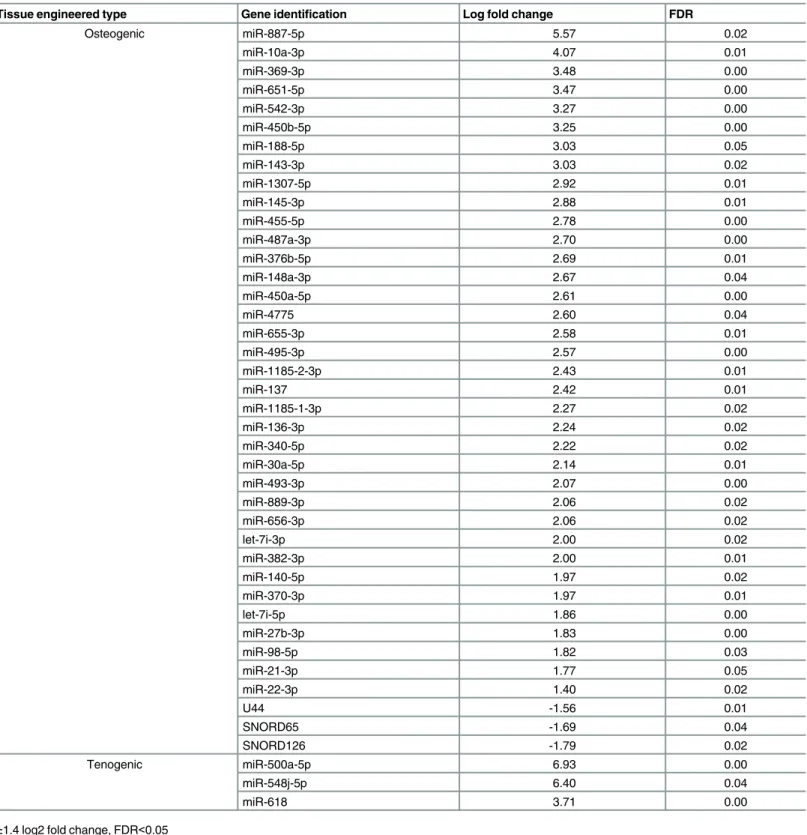
2D and 2E). The greatest variability was due to engineered tissue type. There were no age-related DE small RNAs in chondrogenic tissues. In osteogenic tissues, there were 36 DE miRs (all reduced were derived from old MSCs) and three DE snoRNAs and in tenogenic engineered tissues three miRs were DE (Fig 2F,Table 3). The donor age-associated DE of several miRs in the osteogenic and tenogenic tissues was validated using qPCR (Table 4). Validated miRs were chosen based on our own and published data with regards to the relevance to the osteogenic-and tenogenic-related processes.
Reproducibility of RNASeq results with an independent platform is high [22,23]. Neverthe-less we selected genes (mRNA and miRNA) DE and assessed their expression levels with qRT-PCR analyses for each engineered tissue type. There was good correlation between the deep sequencing analyses and qRT-PCR results (Table 5) reflecting the accuracy and reliability of deep sequencing analyses.
Gene ontology (GO) and IPA analysis of DEGs and AS genes
For each engineered tissue type age-related DEGs (adjusted P<0.05 and 1.4 log2fold change)
were analysed in DAVID. Significant annotations included shared terms‘glycoprotein’and
‘extracellular matrix’(ECM) for chondrogenic and osteogenic. In addition the terms‘growth factor’and‘secreted’were identified for chondrogenic and osteogenic respectively. For teno-genic‘developmental protein’and‘homeobox’were significantly enriched. The DEGs were next input into IPA. This inferred the nature of the engineered tissue protein-coding transcript networks was predominantly for the functions‘cell death and survival’,‘cell morphology’, and
sets are shown inTable 6. The top networks identified for each engineered tissue type were
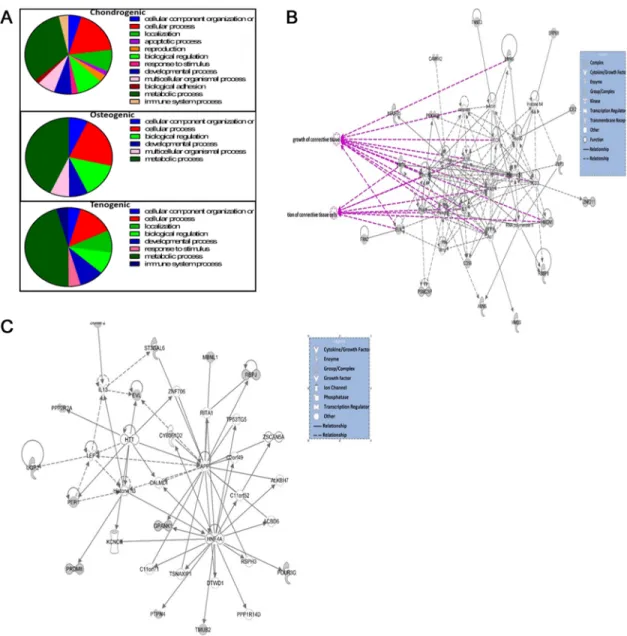
‘developmental disorders, hereditary disorders and metabolic disease’for chondrogenic (Fig 3A);‘cellular growth and proliferation, cell development’and‘morphology’for osteogenic (Fig 3B); and‘embryonic and organismal development’for tenogenic (Fig 3C).
GO analyses using PANTHER indicated enrichment in genes associated principally with metabolic processes in all engineered tissue type genes undergoing AS (Fig 4A). The chondro-genic and tenochondro-genic AS gene sets was then analysed with IPA. For chondrochondro-genic tissues the top Fig 2. (A) A PCA plot of RNASeq data revealed the greatest variability in RNASeq data was tissue type. (B) Correlation heatmap of RNASeq data from chondrogenic (chondro), osteogenic (osteo) and tenogenic (tendon) engineered tissues derived from young and old MSCs. Samples from same tissue are more closely correlated than sample from different tissue. (C) Venn diagram showing the DE genes from RNASeq for chondrogenic, osteogenic tenogenic engineered tissues (D) PCA plot of small RNASeq data. (E) Correlation heatmap of age-related DE small RNAs in chondrogenic (logFCchondro_Y vs O), osteogenic (logFCosteo_YvsO) and tenogenic (logFCtendon_YvsO) engineered tissues using small RNASeq. (F) Venn diagram depicting DE transcripts from RNASeq from differential splicing analysis for chondrogenic, osteogenic tenogenic engineered tissues. Hierarchical clustering of the samples revealed significant age-related changes in expression in osteogenic and tenogenic but not chondrogenic engineered tissues. Analysis was undertaken using the filters±1.4 log2 fold change, FDR<0.05.
pathways identified included cell death and survival (p = -2.96E-02- 5.42E-05), cellular com-promise (p = 2.54E-02-5.42E-05), organismal survival (p = 2.96E-02-5.35E-04) and tissue development (p = 2.54E-02-6.04E-04). The top network identified was cell death, survival, cel-lular compromise, connective tissue disorders with a score of 40.Fig 4Bshows this network with some significant functions overlaid; connective tissue (p = 2.48E-08) and proliferation of connective tissue (p = 6.77E-07). For tenogenic top pathways identified included carbohydrate metabolism (p = 1.73E-02-7.29E-04), lipid metabolism (p = 2.95E-02-7.29E-04), cellular func-tion and maintenance (p = 3.65E02-7.29E-04) and connective tissue development and funcfunc-tion (p = 3.3E-02-7.29E-04). The principal network involved cell to cell signalling and interaction, cell morphology, function and maintenance (score 36) (Fig 4C).
Gene pairing analysis of DE miRs and DE RNAs
The expression patterns of DE miRs and mRNA were further analysed using IPA by investigat-ing opposite fold-change direction (up/down or down/up), followinvestigat-ing the canonical miR-mRNA target expression paradigm with moderate to high confidence. Potentially relevant miR-mRNA signatures involved in the age-related changes were identified; 16 for osteogenic and one for tenogenic (S10 file). Using PANTHER the mRNA in which related miRs were identified in osteogenic tissues were enriched in the cellular components ECM (52% of genes) and enriched for the functions‘binding (44%).
Comparison of the DNA methylome in ageing MSCs
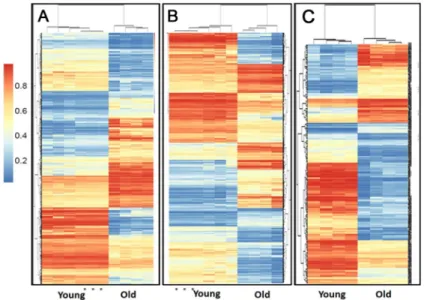
Unsupervised hierarchical clustering revealed that young and old samples are distinguished by their DNA methylome in all engineered tissue types (Fig 5). Technical triplicate replicates were included for a single donor for chondrogenic and osteogenic young donors and correlation was excellent. Significant age-related differentially methylated loci (DML), both tissue specific and common CpGs, were identified in all engineered tissue types (Table 7).S11 filecontains all DML for each engineered tissue type andS12 fileidentifies these at the site, promoter, gene and CpG island level. In all engineered tissue groups and regions hypomethylation in old sam-ples was dominant.
Gene ontology analysis of genes containing DML indicated age-related enrichment for all engineered tissue types in skeletal system morphogenesis, regulation of cell proliferation and regulation of transcription.
Table 1. Differentially expressed RNAs in chondrogenic, osteogenic and tenogenic engineered tissues based on RNA class (±1.4 log2 fold change, FDR<0.05).
Engineered tissue Type RNA class Number differentially expressed Number increased in old Number reduced in old
Chondrogenic protein coding 201 133 68
Inc 28 20 8
miR 5 2 3
snoRNA 4 0 4
snRNA 6 1 5
pseudogenes 35 13 22
Osteogenic protein coding 67 29 38
Inc 2 2 0
Tenogenic protein coding 32 21 11
Inc 5 1 4
miR 1 1 0
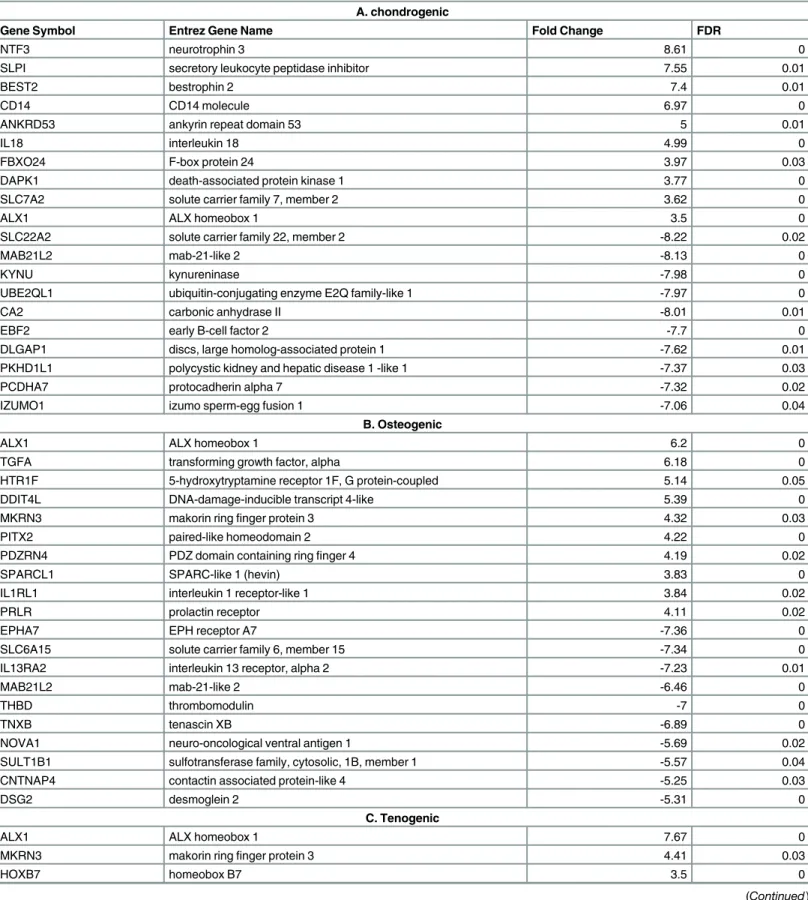
Table 2. Protein-coding genes with the highest and lowest fold changes for each engineered tissue type.A; chondrogenic, B; osteogenic, C: tenogenic.
A. chondrogenic
Gene Symbol Entrez Gene Name Fold Change FDR
NTF3 neurotrophin 3 8.61 0
SLPI secretory leukocyte peptidase inhibitor 7.55 0.01
BEST2 bestrophin 2 7.4 0.01
CD14 CD14 molecule 6.97 0
ANKRD53 ankyrin repeat domain 53 5 0.01
IL18 interleukin 18 4.99 0
FBXO24 F-box protein 24 3.97 0.03
DAPK1 death-associated protein kinase 1 3.77 0
SLC7A2 solute carrier family 7, member 2 3.62 0
ALX1 ALX homeobox 1 3.5 0
SLC22A2 solute carrier family 22, member 2 -8.22 0.02
MAB21L2 mab-21-like 2 -8.13 0
KYNU kynureninase -7.98 0
UBE2QL1 ubiquitin-conjugating enzyme E2Q family-like 1 -7.97 0
CA2 carbonic anhydrase II -8.01 0.01
EBF2 early B-cell factor 2 -7.7 0
DLGAP1 discs, large homolog-associated protein 1 -7.62 0.01
PKHD1L1 polycystic kidney and hepatic disease 1 -like 1 -7.37 0.03
PCDHA7 protocadherin alpha 7 -7.32 0.02
IZUMO1 izumo sperm-egg fusion 1 -7.06 0.04
B. Osteogenic
ALX1 ALX homeobox 1 6.2 0
TGFA transforming growth factor, alpha 6.18 0
HTR1F 5-hydroxytryptamine receptor 1F, G protein-coupled 5.14 0.05
DDIT4L DNA-damage-inducible transcript 4-like 5.39 0
MKRN3 makorin ringfinger protein 3 4.32 0.03
PITX2 paired-like homeodomain 2 4.22 0
PDZRN4 PDZ domain containing ringfinger 4 4.19 0.02
SPARCL1 SPARC-like 1 (hevin) 3.83 0
IL1RL1 interleukin 1 receptor-like 1 3.84 0.02
PRLR prolactin receptor 4.11 0.02
EPHA7 EPH receptor A7 -7.36 0
SLC6A15 solute carrier family 6, member 15 -7.34 0
IL13RA2 interleukin 13 receptor, alpha 2 -7.23 0.01
MAB21L2 mab-21-like 2 -6.46 0
THBD thrombomodulin -7 0
TNXB tenascin XB -6.89 0
NOVA1 neuro-oncological ventral antigen 1 -5.69 0.02
SULT1B1 sulfotransferase family, cytosolic, 1B, member 1 -5.57 0.04
CNTNAP4 contactin associated protein-like 4 -5.25 0.03
DSG2 desmoglein 2 -5.31 0
C. Tenogenic
ALX1 ALX homeobox 1 7.67 0
MKRN3 makorin ringfinger protein 3 4.41 0.03
HOXB7 homeobox B7 3.5 0
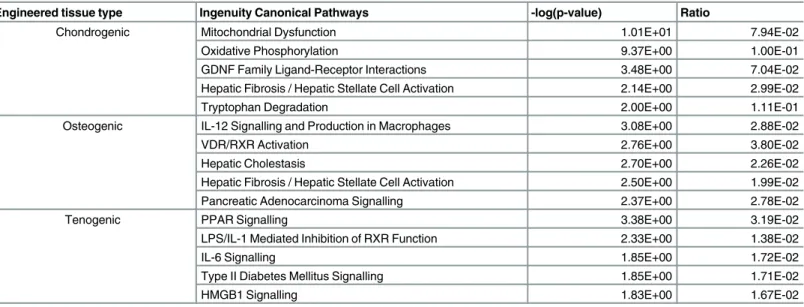
To identify the canonical pathways, biological function, and networks that were affected by the differentially methylated genes, we used IPA analysis. Results suggest that dynamic epige-netic modifications may occur in genes associated with a number of shared and distinct path-ways dependent upon engineered tissue type. The top 10 genes with increased and decreased methylation levels based on Beta values (methylation difference) are listed inTable 8.
Canonical pathways were analysed based on the ratio of input genes to the total number of reference genes in the corresponding pathways in the IPA knowledge bases. Fisher’s exact test was employed to calculate the P values to determine significant associations between the DM genes and the canonical pathways. The top five canonical pathways for each engineered tissue type are inTable 9. Then we used IPA comparison analysis to visualise downstream effects analysis results across each engineered tissue type simultaneously. This identified diseases and biological functions predicted to increase or decrease related to age-affected DML through functional scores (Fig 6A). Interestingly in all engineered tissue types the function‘ differentia-tion of cells’was activated (Fig 6B) whereas the‘cell survival’network was only affected in chondrogenic and osteogenic tissues. The network‘congenital anomalies of the musculoskele-tal system’was activated in tenogenic but inhibited in chondrogenic and osteogenic. The most significant network for each engineered tissue was‘skeletal and muscular development and function’.
Next we wanted to determine to what degree the age-related gene expression differences among engineered tissue types are affected by epigenetic changes. The methylation of gene pro-moters and/or enhancers is known to correlate with decreased gene expression, contrastingly methylation within non-enhancer regions of the gene body correlates with increased gene expression [46]. Therefore for chondrogenic, osteogenic and tenogenic tissues we compared DEGs from RNASeq with location of DMLs and found 10, 13 and 4 genes identified in both data sets for comparison (Table 10).
Table 2.(Continued)
HOXB6 homeobox B6 3.24 0.02
PITX2 paired-like homeodomain 2 3.31 0.01
PLAT plasminogen activator, tissue 2.68 0.02
TNIK TRAF2 and NCK interacting kinase 2.32 0
HOXA3 homeobox A3 2.41 0.01
AHDC1 AT hook, DNA binding motif, containing 1 1.72 0.03
ZNF462 zincfinger protein 462 1.64 0
MAB21L2 mab-21-like 2 -6.85 0
NPTX1 neuronal pentraxin I -6.79 0.03
THEGL theg spermatid protein-like -6.54 0
SRRM3 serine/arginine repetitive matrix 3 -5.07 0.01
MCF2L MCF.2 cell line derived transforming sequence -5.03 0.01
GPM6B glycoprotein M6B -4.89 0.03
SYT16 synaptotagmin XVI -4.88 0.04
ELFN2 III domain containing 2 -4.76 0
HS3ST2 heparan sulfate 3-O-sulfotransferase 2 -4.75 0
EPHA7 EPH receptor A7 -4.18 0.03
Log2 fold-change and false discovery rate (FDR) (adjusted P value) were determined in edgeR. A logarithm to the base 2 of 8 is a linear fold-change of 3. Shown are the 10 genes with highest and lowest expression in tissues derived from young compared to old MSCs. Negative LFC is higher in old.
Table 3. Age-related differentially expressed small RNAs in osteogenic and tenogenic engineered tissues.
Tissue engineered type Gene identification Log fold change FDR
Osteogenic miR-887-5p 5.57 0.02
miR-10a-3p 4.07 0.01
miR-369-3p 3.48 0.00
miR-651-5p 3.47 0.00
miR-542-3p 3.27 0.00
miR-450b-5p 3.25 0.00
miR-188-5p 3.03 0.05
miR-143-3p 3.03 0.02
miR-1307-5p 2.92 0.01
miR-145-3p 2.88 0.01
miR-455-5p 2.78 0.00
miR-487a-3p 2.70 0.00
miR-376b-5p 2.69 0.01
miR-148a-3p 2.67 0.04
miR-450a-5p 2.61 0.00
miR-4775 2.60 0.04
miR-655-3p 2.58 0.01
miR-495-3p 2.57 0.00
miR-1185-2-3p 2.43 0.01
miR-137 2.42 0.01
miR-1185-1-3p 2.27 0.02
miR-136-3p 2.24 0.02
miR-340-5p 2.22 0.02
miR-30a-5p 2.14 0.01
miR-493-3p 2.07 0.00
miR-889-3p 2.06 0.02
miR-656-3p 2.06 0.02
let-7i-3p 2.00 0.02
miR-382-3p 2.00 0.01
miR-140-5p 1.97 0.02
miR-370-3p 1.97 0.01
let-7i-5p 1.86 0.00
miR-27b-3p 1.83 0.00
miR-98-5p 1.82 0.03
miR-21-3p 1.77 0.05
miR-22-3p 1.40 0.02
U44 -1.56 0.01
SNORD65 -1.69 0.04
SNORD126 -1.79 0.02
Tenogenic miR-500a-5p 6.93 0.00
miR-548j-5p 6.40 0.04
miR-618 3.71 0.00
±1.4 log2 fold change, FDR<0.05
Discussion
Adult MSCs are an appealing source for cell-based treatment for musculoskeletal diseases and injury [47]. Our previous work in bone-marrow-derived MSCs using a systems biology approach demonstrated an altered phenotype in MSC ageing at a number of levels, implicating roles for inflammageing and mitochondrial ageing [48]. The changes identified represented novel insights into the ageing process, with implications for stem cell therapies in older patients.
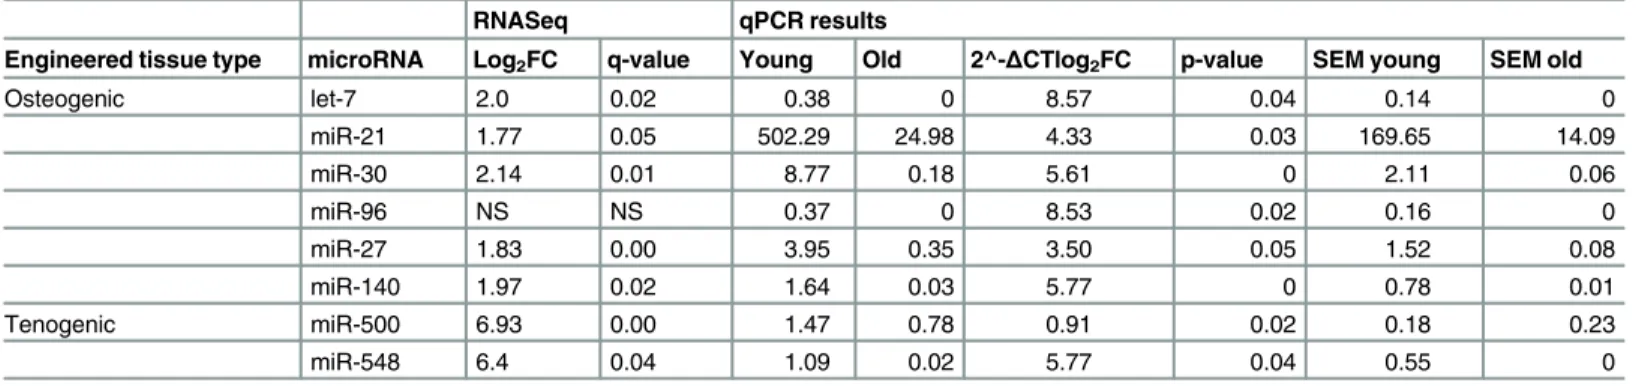
Table 4. The differential expression of several miRs was validated using qPCR.
RNASeq qPCR results
Engineered tissue type microRNA Log2FC q-value Young Old 2^-ΔCTlog2FC p-value SEM young SEM old
Osteogenic let-7 2.0 0.02 0.38 0 8.57 0.04 0.14 0
miR-21 1.77 0.05 502.29 24.98 4.33 0.03 169.65 14.09
miR-30 2.14 0.01 8.77 0.18 5.61 0 2.11 0.06
miR-96 NS NS 0.37 0 8.53 0.02 0.16 0
miR-27 1.83 0.00 3.95 0.35 3.50 0.05 1.52 0.08
miR-140 1.97 0.02 1.64 0.03 5.77 0 0.78 0.01
Tenogenic miR-500 6.93 0.00 1.47 0.78 0.91 0.02 0.18 0.23
miR-548 6.4 0.04 1.09 0.02 5.77 0.04 0.55 0
Relative expression levels were calculated by using the 2−ΔCt method. Log2 fold-change of 2-ΔCt values are shown for comparison. NS; not significant
doi:10.1371/journal.pone.0160517.t004
Table 5. Real-time polymerase chain reaction analysis of selected genes for each engineered tissue type revealed good correlation with RNA-Seq results.
Engineered tissue type Gene RNA-Seq Results RT-PCR Results
Age 2^-ΔCTlog2FC p-value
Differential expression Significant Log2FC q-value Young Old
Chondrogenic ALX1 lower old 3.53 0.01 0.11±0.05 0.63±0.48 -2.52 0.3
COL2A1 higher old -6.74 0.01 0.02±0.01 0.2±0.02 -3.30 0.01
ACAN NS NA NA 0.01±0.00 0.06±0.03 -2.58 0.1
MAB21L2 higher old -3.84 0 0.01±0.00 0.47±0.33 -5.55 0.02
MMP16 higher old -2.82 0.02 0.00±0.00 0.52±0.51 -9.02 0.05
Osteogenic ALX1 lower old 6.26 0 0.01±0.04 0.4±0.06 -5.32 0.02
HOXB6 3.38 0.03 0.14±0.01 0.02±0.01 2.81 0.06
HOXB7 3.28 0 0.31±0.16 0.03±0.02 3.37 0.05
PITX2 4.6 0 0.03±0.01 0.01±0.00 1.58 0.03
TGFA 5.64 0 0.42±0.28 0.02±0.01 4.39 0.03
Tenogenic ALX1 lower old 7.6 0 164.67±29.02 0.26±0.11 9.31 0.02
HOXB6 3.66 0.02 53.04±9.00 0.18±0.10 8.20 0.04
HOXB7 3.77 0 55.2±10.1 0.25±0.10 7.79 0.02
PITX2 3.51 0.01 22.68±2.85 0.32±0.12 6.15 0.04
Values for quantitative real-time polymerase chain reaction (qRT-PCR) are the mean±standard error of relative expression levels normalised to expression of RPS8 (to two decimal places). Statistical significance was tested by using Mann-Whitney U test. q RT-PCR results are expressed as 2-ΔCt. Log2 fold-change of 2-ΔCt values are shown for comparison. ALX1; ALX homeobox 1, ACAN, aggrecan; COL2A1, collagen type 2 alpha 1; HOXB6; homeobox B6, HOXB7; homeobox B7, MAB21L2; MAB21-like 2, PITX2; paired-like homeodomain transcription factor 2, MMP16, matrix metalloproteinase 16; TGFA; transforming growth factor alpha. NS; not significant.
Tissue engineering aims to develop biomimetic tissues that recapitulate biological, structural and functional characteristics of native tissue. However there is sparse global information avail-able on the effect of donor age on engineered musculoskeletal tissues at the transcriptome and methylome level. Age-related changes have potential implications for the tissue-engineering strategies used for enhancing musculoskeletal repair. Furthermore the study of musculoskeletal ageing in bone, cartilage and tendon are usually undertaken in seclusion and it is frequently dif-ficult to attain aged matched tissue samples in humans. Therefore we propose our approach as a potential model of musculoskeletal ageing that could be probed further to identify factors that may aid in recapitulation of a younger tissue phenotype.
It is known that the site of MSC extraction can affect cell behaviour [49] we therefore used MSCs derived from alveolar bone. Additionally, as low oxygen tension improves MSC vitality and metabolic state in culture [50] all MSCs and then subsequently tissues were cultured in 5% oxygen tension. Standard methods of engineered tissue characterisation were undertaken fol-lowing chondrogenic and osteogenic differentiation.
Transcriptome profiling is a key method for functional characterization of cells and tissues. However one challenge of this study was the integration of the different types of data. We used gene ontology, network analysis and annotated of the pathways identified. However, due to limited information on the donors we were unable to integrate key environmental factors such as nutrition and other lifestyle features which can alter molecular measurements. Other poten-tial limitations of the study include small sample size and significance threshold filtering which can affect the subsequent pathway/network analysis.
Epigenetic processes have been implicated in age-related musculoskeletal diseases such as osteoarthritis [21] and osteoporosis (reviewed [51]). This study identified a number of epige-netic molecular classes including small non-coding RNAs; small nucleolar RNAs, small cajal body RNA (scaRNAs), miRs and lncRNAs.
Our study found weak age-related effects on expression at the miR level with no DE small RNAs in chondrogenic engineered tissues. The low mapping in chondrogenic samples implies Table 6. The top canonical pathways.Pathways from the IPA knowledge base that involve DE (adjusted P<0.05 and 1.4 log2fold change) protein coding genes differentially expressed in tissues derived from young compared to old MSCs; chondrogenic, tenogenic and osteogenic.
Engineered tissue type Ingenuity Canonical Pathways -log(p-value) Ratio
Chondrogenic Mitochondrial Dysfunction 1.01E+01 7.94E-02
Oxidative Phosphorylation 9.37E+00 1.00E-01
GDNF Family Ligand-Receptor Interactions 3.48E+00 7.04E-02
Hepatic Fibrosis / Hepatic Stellate Cell Activation 2.14E+00 2.99E-02
Tryptophan Degradation 2.00E+00 1.11E-01
Osteogenic IL-12 Signalling and Production in Macrophages 3.08E+00 2.88E-02
VDR/RXR Activation 2.76E+00 3.80E-02
Hepatic Cholestasis 2.70E+00 2.26E-02
Hepatic Fibrosis / Hepatic Stellate Cell Activation 2.50E+00 1.99E-02
Pancreatic Adenocarcinoma Signalling 2.37E+00 2.78E-02
Tenogenic PPAR Signalling 3.38E+00 3.19E-02
LPS/IL-1 Mediated Inhibition of RXR Function 2.33E+00 1.38E-02
IL-6 Signalling 1.85E+00 1.72E-02
Type II Diabetes Mellitus Signalling 1.85E+00 1.71E-02
HMGB1 Signalling 1.83E+00 1.67E-02
The -log(p-values) were calculated by Fisher's exact test right-tailed.
that RNA populations or fragments other than the targeted small RNA were the input material into the library prep workflows. Further investigation did indeed demonstrate that the low centage of alignments to the small RNA reference dataset corresponds to a high mapping per-centage to rRNA in chondrogenic samples. However the perper-centage of mapping to rRNA for old and young samples was similar resulting in a lower sequencing depth which may reduce the statistical power in differential expression analysis. This effect was roughly similar for the Fig 3. Top scoring networks.Networks derived from the DE genes with age-related different abundance identified the top network for each chondrogenic, osteogenic and tenogenic tissues with scores of 44, 41, and 42 respectively. These related to developmental disorders, hereditary disorders and metabolic disease for chondrogenic (A), cellular growth and proliferation, cell development and morphology for osteogenic (B) and embryonic and organismal development for tenogenic (C). Green nodes, increased expression in old; red nodes, lower expression in old; white nodes, genes not differentially expressed with age. Intensity of colour is related to higher fold-change. Legend to the main features in the networks is shown. Significant functions related to chondrogenic included mitochondrial disorders (p = 5.2e-29) and mitochondrial respiratory chain deficiency (p = 1.6e-17), for osteogenic include differentiation of cells (p = 4.5e-5) and for tenogenic include differentiation of connective tissue cells (p = 9.5e-5). These are highlighted in purple.
two sample groups. Therefore, the count values are usable values, though the statistical power may be weaker due to lower sequencing depth. Compared to tenogenic and osteogenic, no DE miRNA detected from chondrogenic tissue is best explained by either no existence of DE miRNA, or existing DE miRNA was not detected due to lack enough statistical power.
Among the miR expression of which was differentially expressed in the osteogenic tissues from adult and old donors, miRs with known function in bone biology were validated: let-7 [52], miR-21 [53], miR-30 [54], miR-96 [55], miR-27 [56], and miR-140 [57]. Interestingly, among predicted targets of these miRs are genes and proteins regulated in MSC from adult and Fig 4. Bioinformatics analysis of AS in engineered tissues.A. Pie charts depicting biological process gene ontology of DE genes in ageing using PANTHER. Genes were demonstrated as DE with±1.4 log2 fold change, FDR<0.05. B. The top scoring IPA derived network for significant AS genes in chondrogenic tissues. This related to’cell death and survival, cellular compromise and connective tissue disorders’. Significant functions related to the network are overlaid; growth of connective tissue (p = 2.48E-08) and proliferation of connective tissue (p = 6.77E-07). C. The top scoring IPA derived network for significant AS genes in tenogenic tissues was‘cell to cell signalling and interaction, cell morphology, function and maintenance’. Key to the main features in the networks is shown. Grey nodes were those identified as significant from the AS gene dataset, white nodes genes not in dataset.
old donors as shown. For example, MMP16, predicted target of miRs miR-27, miR-30 and miR-140, is an important protein regulating bone homeostasis through regulating osteocyte differentiation [58]. Other genes of interest, predicted to be target of more than one of the vali-dated miRs, include members of the ADAMTS family, key to cartilage and bone homeostasis [59], interleukin 18 with important role in bone metabolism [60]. Several genes with a not yet established function in MSC or bone biology, however reported to be expressed in these cells or tissues have also been characterised as DE in this study and are predicted target genes of miRs here validated, for example desmoglein 2 [61].
Fig 5. Heatmap showing the unsupervised clustering of the DMLs between the young (n = 4) and old (n = 4) chondrogenic (A), osteogenic (B) and tenogenic (B) engineered tissues.For chondrogenic young and osteogenic young a sample was run in triplicate technical replicates. DMLs were defined as at least a 10% difference in methylation between the two groups, and an FDR-corrected P value of<0.05. The dendogram at the top shows the clustering of the samples and the dendogram to the side show clustering of the loci. The methylation scale is shown at the left of the heatmap (1 = 100% methylation, 0 = no methylation).
doi:10.1371/journal.pone.0160517.g005
Table 7. Number of age-related differentially methylated loci (DML), genes, CpG islands and promoters.
Engineered tissue type Region Total number DE Number hypomethylated in old Number hypermethylated in old
Chondrogenic DML 609 402 207
Gene 12 7 5
CpG Island 58 43 15
Promoter 17 12 5
Osteogenic DML 507 367 140
Gene 11 8 3
CpG Island 38 32 6
Promoter 15 12 3
Tenogenic DML 157 122 45
Gene 1 0 1
CpG Island 314 300 14
Promoter 30 27 3
Significance was defined as Benjamini—Hochberg corrected P value<0.01 (DML) or<0.05 (gene, CpG island, promoter) and a mean methylation difference (Δ βscore)0.15.
Table 8. Top 10 annotated genes with increased and decreased methylation.
Engineered tissue type Symbol Gene Name Beta Location Type(s)
chondrogenic HOXA5 homeobox A5 -0.67 Nucleus transcription regulator
HAND2 heart and neural crest derivatives expressed 2 -0.66 Nucleus transcription regulator
mir-548 microRNA 548c -0.63 Cytoplasm microRNA
SMTNL1 smoothelin-like 1 -0.60 Cytoplasm other
LAMA1 laminin, alpha 1 -0.60 Extracellular Space other
SHANK2 SH3 and multiple ankyrin repeat domains 2 -0.58 Plasma Membrane other
EMX2 empty spiracles homeobox 2 -0.57 Nucleus transcription regulator
GAPT GRB2-binding adaptor protein, transmembrane -0.57 Other other
USP28 ubiquitin specific peptidase 28 -0.57 Nucleus peptidase
SAMD12 sterile alpha motif domain containing 12 -0.53 Other other SLC12A7 solute carrier family 12, member 7 0.64 Plasma Membrane transporter
LRBA LPS-responsive vesicle trafficking 0.64 Cytoplasm other
HOXB4 homeobox B4 0.68 Nucleus transcription regulator
RUNX3 runt-related transcription factor 3 0.70 Nucleus transcription regulator
PITX2 paired-like homeodomain 2 0.71 Nucleus transcription regulator
HOXA11-AS HOXA11 antisense RNA 0.72 Other other
mir-10 microRNA 100 0.73 Other microRNA
HOXB7 homeobox B7 0.74 Nucleus transcription regulator
EMX2OS EMX2 opposite strand/antisense RNA 0.76 Other other
TBX15 T-box 15 0.91 Nucleus transcription regulator
osteogenic HOXA5 homeobox A5 -0.77 Nucleus transcription regulator
HOXA2 homeobox A2 -0.76 Nucleus transcription regulator
LAMA1 laminin, alpha 1 -0.69 Extracellular Space other
PARP4 poly (ADP-ribose) polymerase family, member 4 -0.67 Cytoplasm enzyme
SIX2 SIX homeobox 2 -0.65 Nucleus transcription regulator
PRRX1 paired related homeobox 1 -0.62 Nucleus transcription regulator
CPNE4 copine IV -0.62 Cytoplasm other
GAPT GRB2-binding adaptor protein, transmembrane -0.62 Other other
MIR548F5 microRNA 548c -0.61 Cytoplasm microRNA
USP28 ubiquitin specific peptidase 28 -0.58 Nucleus peptidase
BMX BMX non-receptor tyrosine kinase 0.57 Cytoplasm kinase
DMRT2 doublesex and mab-3 related transcription factor 2 0.57 Nucleus other
TBX18 T-box 18 0.58 Nucleus transcription regulator
EPB41L5 erythrocyte membrane protein band 4.1 like 5 0.60 Plasma Membrane other SLC12A7 solute carrier family 12, member 7 0.61 Plasma Membrane transporter
HOXB7 homeobox B7 0.67 Nucleus transcription regulator
HOXA11AS HOXA11 antisense RNA 0.68 Other other
MIR10A microRNA 100 0.71 Other microRNA
EMX2OS EMX2 opposite strand/antisense RNA 0.78 Other other
PITX2 paired-like homeodomain 2 0.86 Nucleus transcription regulator
TBX15 T-box 15 0.89 Nucleus transcription regulator
tenogenic HOXA5 homeobox A5 -0.74 Nucleus transcription regulator
LAMA1 laminin, alpha 1 -0.69 Extracellular Space other
HOXA3 homeobox A3 -0.69 Nucleus transcription regulator
PARP4 poly (ADP-ribose) polymerase family, member 4 -0.65 Cytoplasm enzyme
PRRX1 paired related homeobox 1 -0.59 Nucleus transcription regulator
CPNE4 copine IV -0.57 Cytoplasm other
Interestingly, the expression of all miRs in the osteogenic tissues was downregulated in tis-sues from older donors. This may be due to defective miRNA biogenesis machinery [62] or decreased ability of the MSCs from older donors to undergo the osteogenic differentiation path-way [63]. Interestingly, the lower levels of expression of the enzyme associated with miR pro-duction, Dicer, in MSCs have been associated with their decreased differentiation potential [62].
We have also validated DE of miRs: miR-500 and miR-548j in the tenogenic tissues from young and older donors. It has been shown that miRs may play a role in tendon homeostasis [64,65], however little is still understood about the role of miRs in tenogenic differentiation or tendon homeostasis. Based on target prediction databases), miRs: mir-500 and miR-548j may be regulating processes associated with matrix remodelling which are important in both tendon Table 8.(Continued)
Engineered tissue type Symbol Gene Name Beta Location Type(s)
HOXB2 homeobox B2 -0.50 Nucleus transcription regulator
EMX2 empty spiracles homeobox 2 -0.49 Nucleus transcription regulator
PHACTR1 phosphatase and actin regulator 1 -0.46 Cytoplasm other GRIK3 glutamate receptor, ionotropic, kainate 3 -0.45 Plasma Membrane ion channel KHDRBS3 KH domain containing, signal transduction associated 3 0.55 Nucleus other
BMX BMX non-receptor tyrosine kinase 0.55 Cytoplasm kinase
HOXB4 homeobox B4 0.56 Nucleus transcription regulator
RUNX3 runt-related transcription factor 3 0.60 Nucleus transcription regulator
TBX5 T-box 5 0.63 Nucleus transcription regulator
LRBA LPS-responsive vesicle trafficking 0.72 Cytoplasm other
mir-10 microRNA 100 0.72 Other microRNA
EMX2OS EMX2 opposite strand/antisense RNA 0.78 Other other
PITX2 paired-like homeodomain 2 0.80 Nucleus transcription regulator
TBX15 T-box 15 0.89 Nucleus transcription regulator
doi:10.1371/journal.pone.0160517.t008
Table 9. The five significant canonical pathways related to changes in the methylation patterns for each tissues type. The log (p-value) of each path-way was determined using Fisher’s exact test. The ratios were calculated as the number of input molecules mapped to a specific pathway divided by the total number of molecules in the given pathway.
Engineered tissue Type Ingenuity Canonical Pathways -log(p-value) Ratio
Chondrogenic Hepatic Fibrosis 5.62E+00 8.96E-02
mTOR Signalling 4.61E+00 8.25E-02
Tight Junction Signalling 4.19E+00 8.38E-02
Chronic Myeloid Leukemia Signalling 4.03E+00 1.08E-01
IL-9 Signalling 3.80E+00 1.76E-01
Osteogenic AMPK Signaling 3.49E+00 6.63E-02
Neuropathic Pain Signalling In Dorsal Horn Neurons 3.40E+00 8.65E-02
VEGF Family Ligand-Receptor Interactions 2.73E+00 8.54E-02
Glutamate Receptor Signalling 2.61E+00 9.38E-02
Human Embryonic Stem Cell Pluripotency 2.51E+00 6.47E-02
Tenogenic TGFB Signalling 3.30E+00 4.60E-02
Chronic Myeloid Leukemia Signalling 3.20E+00 4.30E-02
Antiproliferative Role of TOB in T Cell Signalling 2.27E+00 7.69E-02
Factors Promoting Cardiogenesis 2.16E+00 3.26E-02
Hepatic Fibrosis 1.99E+00 1.99E-02
formation and maintenance, as well as healing. Interestingly, miR-548j is predicted to target peroxisome proliferator-activated receptor gamma (PPARG), a gene differentially expressed in tenogenic tissues from young and older MSCs donors. PPARG has been shown to be involved in tendon healing [66] further indicating the potential involvement of miR-548j in tendon repair.
To summarise, we have validated DE of miRs and their predicted target genes in the osteo-genic and tenoosteo-genic tissues from young and older donors that may be associated with the decreased function of MSC from older donors and of relevance to MSC-based therapies.
LncRNAs play important roles in age-related diseases. Evidence is emerging that lncRNAs affect the molecular processes that underlie age-associated phenotypes. LncRNAs modulate gene expression patterns at the transcriptional, post-transcriptional and post-translational Fig 6. Diseases and biological functions identified from the sets of DM loci input into IPA for chondrogenic, osteogenic and tenogenic engineered tissues.A. Heatmap of the top 20 diseases and biological functions identified using IPA comparison analysis with significant activation z scores (infers the activation state of regulation). Scale relates to activation Z scores were green is a positive activation z-score (activated) and red is a negative score (inhibited). B. A cell differentiation network was identified in all engineered tissue types. The network shown includes DM genes identified in tenogenic tissues. C. The network ‘congenital anomaly of the musculoskeletal system’was activated in tenogenic tissues. In networks red genes relates to those hypomethylated and green hypermethylated in tissues derived from older MSCs.
level. They affect many cellular processes relevant to ageing biology such as proliferation, dif-ferentiation and senescence (reviewed [67]). We identified a catalogue of lncRNAs for further work to define their roles in musculoskeletal ageing as although studies suggest the majority are functional only a few established biological relevance [68]. In tenogenic tissues we identi-fied XIST as having a reduced expression in older tissues. XIST, responsible for imprinting con-trols epigenetic changes through DNA methylation and declines in senescence; though its function in this is unknown [69].
In transcriptomic studies we used gene ontology and network analysis tools to study path-ways affected by MSC donor age. However, there are a few interesting findings for the some Table 10. Summary of genes and DML correlating relationships for chondrogenic, osteogenic and tenogenic engineered tissues.
Engineered tissue type
Gene ID DML (B
value) Methylation status in old Log2fold change (RNASeq) Gene expression status in old
Location of methylation Promoter/ enhancer/ body Data correlation
Chondrogenic FAM134B 0.3 hypomethylated -2.6 higher old Body;TSS200;5UTR body, enhancer
yes
H19 0.2 hypomethylated -6.8 higher old Body body no
HOXB7 0.7 hypomethylated 3.3 lower old Body body yes
IRS2 0.4 hypomethylated 2.0 lower old Body body yes
KYNU 0.1 hypomethylated -8.0 higher old Body body no
LRCH2 -0.2 hypermethylated -3.2 higher old Body body yes
MAB21L2 0.3 hypomethylated -8.1 higher old Body;1stExon;5UTR body, promoter
yes
MAPK10 0.4 hypomethylated -2.9 higher old 5UTR;1stExon promoter yes
MYO7A 0.3 hypomethylated -3.0 higher old TSS200;TSS200;
TSS200
enhancer yes
TMEM186 0.3 hypomethylated 1.9 lower old 3UTR body yes
Osteogenic MAB21L2 0.4 hypomethylated -7.0 higher old Body;3UTR body no
TNXB 0.4 hypomethylated -6.9 higher old Body body no
WISP2 0.1 hypomethylated -3.1 higher old TSS200 enhancer yes
NTNG1 -0.1 hypermethylated -2.6 higher old Body body yes
TBX18 0.6 hypomethylated -1.8 higher old Body body no
MACROD2 0.2 hypomethylated 2.6 lower old Body;TSS1500 body,
promoter
yes
ITIH5 0.1 hypomethylated 3.0 lower old Body body yes
KIAA1244 -0.4 hypermethylated 3.2 lower old enhancer enhancer yes
HOXB7 0.7 hypomethylated 3.3 lower old Body body yes
HOXB6 0.5 hypomethylated 3.4 lower old TSS1500 promoter no
OCA2 -0.6 hypermethylated 3.8 lower old enhancer enhancer yes
PITX2 0.9 hypomethylated 4.6 lower old Body; TS1500 body,
enhancer
yes
MKRN3 -0.3 hypermethylated 4.7 lower old TSS200; 5UTR promoter yes
Tenogenic HOXA3 -0.7 hypermethylated 2.1 higher old 5UTR;TSS1500 promoter no
HOXB6 0.5 hypomethylated 3.7 higher old TSS1500 promoter yes
MAB21L2 0.3 hypomethylated -6.8 lower old Body;5UTR,
TSS1500
body, enhancer
no
PITX2 0.8 hypomethylated 3.5 higher old Body;5UTR,
TSS1500
body, enhancer
yes
The 3'UTR is encompassed in the gene body. The promoter is classified as the 5'UTR up to 1500bp upstream of the start codon. TSS; transcription start site, enhancer; where probes are within identified enhancer regions.
individual genes. Chondrogenic tissues were the most affected engineered tissue type with age demonstrated by the number of DEGs, whilst tenogenic were the least age-affected engineered tissue. Whilst principally large‘omics’datasets are analysed using network analysis to under-stand the overall effects of expression changes in the tissue, there were a number of interesting findings at the individual gene level that warrant discussion. In chondrogenic tissues the most DE gene was neurotrophin-3 (NTF3); highly expressed in young. This was not reflected in DML across the gene. NTF3 is an important gene in arthritic processes within the joint [70], produced by inflammatory cells of the nervous system as well as connective tissue [71], with survival-promoting and trophic effects on chondrocytes [72]. There is also a down-regulation of NTF expression in chondrocytes in arthritis [73]. Age-related changes in mouse brain have also been reported [74]. In osteogenic and tenogenic tissues ALX homeobox-1 had the most reduced expression in old similar to ageing MSCs [48]. It is important in skeletal development and we previously demonstrated an increased expression in old tendon [23]. Along with Homeobox (Hox) B7 (lower in old) and Mab-21-like 2 (higher in old) it was DE in all engi-neered tissue types and ageing MSCs [48]. HOX genes have been implicated in ageing of tissues [75] including tendon [23]. Furthermore HOX genes are required for tissue appropriate regen-eration [76] and may be involved in the timing of ageing [49]. HOX-mediated transcriptional memory may reduce stem cell-mediated tissue regeneration [77]. Therefore this has special rel-evance to tissue engineering and musculoskeletal repair in ageing marking them as an interest-ing gene for further work in tissue engineerinterest-ing usinterest-ing MSCs.
Pathway analysis identified similar age-related changes at the molecular and cellular func-tion level from input DE genes for the funcfunc-tions‘cell death and survival’,‘cell morphology’, and‘cell growth and proliferation’. This suggests that although the DEG may be different between engineered tissue types the age-related pathways involved at this level are similar. Interestingly in ageing MSCs we demonstrated age-related changes in gene profiles included differences in cell proliferation, signalling, function and maintenance suggesting an age-related loss in MSCs ability to respond to biological cues [48]. Thus these changes seem to have impacted on all classes of engineered tissues.
signal transduction which could have significant consequences for the synthesis and degrada-tion of cartilage matrix components [82]. Peroxisome proliferator-activated receptor signalling (PPAR) are key regulators in various age-related processes related to oxidative stress and energy metabolism. PPAR signalling was the dominant pathway in tenogenic tissues. As PPAR signalling has roles in cell proliferation, differentiation and tissue remodelling [83], and these pathways were also identified through a network of DE genes, this could have detrimental effects on engineered tendon from older MSCs. Furthermore PPAR signalling affects the impairment in mitochondrial biogenesis demonstrated in OA chondrocytes [84].
For osteogenic tissues age-related changes in genes involved in VDR/RXR (vitamin D recep-tor (VDR)-9-cis-retinoic acid receprecep-tor (RXR)) were identified. The classical actions of vitamin D3 are through this signalling pathway facilitating transcription of genes important in bone for the expression of several proteins including osteopontin [85] and in osteoblasts transcription of nuclear factor-kappaB ligand (RANK-L); important for the activation and differentiation of the osteoclasts [86]. A change in VDR expression with ageing has been reported in rat bone [87] and a reduction in ageing mice osteoblasts [88]. A significant effect on cell differentiation and survival is evident following a reduction in VDR activity in bone. Furthermore a decrease in VDR may be partially responsible for increased levels of apoptosis in ageing osteoblasts [88], together with reduction in bone mineralization proteins; osteopontin and osteocalcin [89]. In osteogenesis from ageing MSCs there are alterations in osteocalcin expression with negative effects on proliferation and differentiation capacity of BMSCs in culture [6]. Another study demonstrated osteogenic potential of ageing MSCs was reduced as measured by Alizarin Red staining (which stains calcium deposits) [90]. Together these findings suggest that the reduced osteogenic potential of ageing MSCs could in part be due to a dysregulation of VDR/RXR sig-nalling. The most significant canonical pathways related to changes in the methylation patterns for osteogenic tissues was active AMP-activated protein kinase (AMPK) signalling. AMPK is highly affected by age and may be a crucial cell signalling pathway that regulates cell function. Age related decline in AMPK plays a key role in the observed loss of function, disordered bio-energetics and metabolism observed in ageing cells and likely contributes to age related disease [91]. Indeed OA chondrocytes are deficient in the metabolic biosensors active AMPK [84].
In tissues derived from ageing MSCs we identified changes in expression level and differ-ences in the relative balance of splice products. AS; the production of multiple mRNA isoforms from a single gene due to alternative choice of exons or splice sites during pre-mRNA splicing is a major source of protein diversity for higher organisms, and is frequently regulated in a tis-sue-specific manner. It is estimated that up to 90 percent of human genes have multiple iso-forms [94]. Splice variants from the same gene can produce proteins with discrete properties and diverse (including antagonistic) functions. Furthermore, a number of genetic mutations involved in human disease have been mapped to changes in splicing signals or sequences that regulate splicing. Thus, an understanding of changes in splicing patterns is critical to a compre-hensive understanding of biological regulation and disease mechanisms. There is a growing interest in the role of AS in normal tissues [95], development [96] and disease (reviewed [97]), but little is known on its role in MSC ageing and tissue engineering. Changes in AS may have a major impact on cell survival [98] and post-translational modifications [99].
Our study demonstrated that donor MSC age has an effect on splicing events in all engi-neered tissue types, similar to an ageing study in peripheral blood leukocytes [100], suggesting that modification of mRNA processing may be a feature of human ageing. GO ontology dem-onstrated enrichment in genes associated principally with metabolic processes in genes under-going AS in all engineered tissue types. AS in metabolic processes is a frequent phenomenon in diseases such as cancer [101] but also in ageing brain [102] and MSCs [48]. Further analysis of the tenogenic AS genes identified carbohydrate and lipid metabolism as significant metabolic pathways affected in ageing. In tenogenic tissuesthe principal network identified in IPA was cell signalling, interaction function and maintenance. This suggests that similar to some cancer cells [98] in tendon tissues derived from ageing MSCs there may be expression of isoforms that alter cell survival. We have previously observed an age-associated disruption to the balance of alternatively expressed isoforms for selected genes in tendon ageing [23]. In AS affected genes for chondrogenic tissues with age were related to cell death and survival, and growth and pro-liferation of connective tissue. Interestingly a recent study found pyruvate dehydrogenase kinase isoform 2-mediated alternative splicing switches hypoxia-inducible death protein from cell death to cell survival in cancer cells [103].
Though there was little overlap between DEG and DML those that were displayed a good correlation of DNA methylation with differentially expressed genes (promoter increased meth-ylation; reduced gene expression, gene body increased methmeth-ylation; increased gene expression). There are a number of possibilities as to why correlation between gene expression and DML was poor. DNA methylation is stable so the methylation changes evident may be associated with ancestral gene expression differences. For instance in the study we differentiated MSCs for 21–28 days. There may have been a gene expression changes between day 0 and 7 accompa-nied by a methylation change. The gene expression could then return back to basal day 0 levels at day 28 when gene expression was measured, but the methylation change remains. Thus a DNA methylation change may not be accompanied by gene expression change as although gene expression did alter, it is not different at the time points measured. Another possibility is that gene enhancers can be located within the gene body of a different gene. Thus a DML within the gene body of gene A may actually be within the enhancer of gene B and so the DML may be associated with a change in gene B but not gene A in which we assessed the effect of the DML on gene A. Finally gene body methylation can be associated with alternative splicing and transcription from alternative/cryptic transcription start site. These may not be have been detected in our RNASeq analysis.
DMLs, both tissue specific and common were identified in all tissue types. DNA methylation also has a role in genomic imprinting (the epigenetic occurrence by which certain genes are expressed in a parent-of-origin-given manner) by regulating the differential expression of maternal and paternal imprinted genes. It is also important in DNA damage/repair and geno-mic instability [105]. Furthermore a number of disease have been associated with aberrant DNA methylation (reviewed [106]). Thus alterations in methylation in engineered tissues may have further consequences than gene expression changes alone. For instance altered methyla-tion may affect the DNA damage response resulting in senescence and apoptosis [107]. Further work is required to decipher the impact of the DNA methylation changes evident in this study on DNA damage and genomic instability in musculoskeletal engineered tissues with ageing.
Methylation has dual and opposing roles in the gene expression regulation. In promoter regions DNA methylation is correlated with transcriptional repression, while in gene bodies it is generally associated with high expression levels [49]. This paradox emphasizes the diverse involvement of methylation in specific genomic and cellular contexts. We described common age-related pathways from DML of skeletal system morphogenesis, regulation of transcription regulation (both principally due to DML in HOX genes) and cell proliferation (also identified in RNASeq data).
The network‘skeletal and muscular development and function’significant in all tissues due to DMLs was principally due to the enrichment of homeotic or HOX genes, similar to studies in ageing MSCs [24,49]. HOX gene expression is tightly regulated temporally during vertebrate development. An association between HOX genes and longevity has been previously proposed [108]. HOXB7 (chondrogenic), HOXB6 and HOXB7 (osteogenic) and HOXA3 and HOXB6 (tenogenic) were also DEGs in the RNASeq study. However, for HOXB7 (osteogenic) and HOXA3 (tenogenic) DEG did not correlate with DML position. Despite this, the dysregulation of HOX genes at the mRNA and epigenetic level consolidate their role in both MSC ageing and in engineered tissues from ageing MSCs.
An interesting signature of age-related DML was that between 40% (chondrogenic and oste-ogenic) and 50% (tenoste-ogenic) of the top 20 most DML for each engineered tissue type were transcription factors. DML not only transcriptionally regulates gene expression but in ageing we identified significant regulation of the transcription factors. In our study of ageing tendon we identified an overrepresentation of DE transcription factors in ageing tendon [23] suggest-ing they may have a pivotal role in tendon agesuggest-ing and tissue engineered tendon. Conversely in our cartilage ageing study there were few age-related DE transcription factors. Furthermore many age-related DML identified in all engineered tissue types resulted in‘differentiation of cells’being highlighted. Site specific CpG site methylation changes can affect MSC chondro-genic differentiation [109] whilst alterations in MSC potential have been previously noted [110]. However‘cell survival’networks relating to DML were affected in chondrogenic and osteogenic tissues only suggesting distinct age-related methylation patterns between tissue types with potential distinct consequences to engineered tissues.
can contribute to the ageing process through influencing DNA repair and transcriptional regu-lation of ageing processes (reviewed [112]).
Conclusion
Context-dependent DNA methylation plays a critical role in regulating gene transcription, thereby serving as an important epigenetic marker or regulator in many biological activities. Taken together our RNASeq and DNA methylation results in engineered tissues suggest an age-related loss in the differentiated cells ability to respond to biological cues. Age-related cel-lular dysfunctions have been hypothesized to results in musculoskeletal age-related diseases such as OA, osteoporosis and tendinopathy. These results have significant implications for therapeutic cell source decisions (autologous or allogeneic) revealing the necessity of approaches to improve functionality of ageing MSCs.
Supporting Information
S1 File. Table of primer sequences. (DOCX)
S2 File. Supplementary methods. (DOCX)
S3 File. RNASeq reads summary table. (XLSX)
S4 File. SmallRNASeq reads summary table. (XLS)
S5 File. Table of top 10 expressed snoRNAs and microRNAs using FPKM. (XLSX)
S6 File. Age-related differentially expressed genes fromtissues (±1.4 log2 fold change, FDR<0.05) for each tissues type.
(XLSX)
S7 File. RNASeq data including FPKM. (XLSX)
S8 File. MA plots RNASeq and smallSeq. (DOCX)
S9 File. Tables for each tissue type containing genes in which there was a significant differ-ence in splicing events.
(XLSX)
S10 File. MicroRNA-mRNA expression pairing using differentially expressed miRs and mRNA.
(DOCX)
S11 File. Tables for each engineered tissue type of differentially methylated loci (with FDR<0.05 and 10% mean methylation difference).
(XLSX)