Application of HPI (Heavy Metal Pollution Index) and Correlation
Coefficient For The Assessment Of Ground Water Quality Near Ash
Ponds Of Thermal Power Plants
Allian Majhi1,*, Subhra Keshari Biswal11
Department of Chemistry,
Indira Gandhi instituteofTechnology,Sarang,Denkanal,Odisha,India [email protected], [email protected]
ABSTRACT:
The objective of the study is to divulge the yearly variation of underground water with the heavy metals like Pb,As,Cd,Se Cr contamination. Heavy metal pollution Index (HPI) is defined as a rating reflecting the composite influence of dissolved heavy metals.HPI is calculated from the point of view of the suitability of ground water for human consumption with respect to metals contamination. The present study is limited to analysis of heavy metals concentration in ground water and heavy metal pollution index and correlation between them is calculated.
KEY WORDS: Heavy metal pollution index (HPI) ,Correlation Coefficient, Heavy Metals ,Angul-Talcher industrial area, Ash ponds
INTRODUCTION:
Water is a most important source for the existence of mankind. Peoples around the world are using ground water as a source of drinking water and even today large population of the world depends on ground water i.e. wells ,tube wells for their survival [1].The ground water values not only depends on the availability but also on the good quality i.e. useable for drinking, domestic and irrigation purpose. The over exploitation of ground water resource and discharge of untreated effluent induces the degradation of water quality [2].Heavy metal contamination in ground water is documented as severe environmental pollution and therefore the study of this problem has become important. The heavy metals enter into the water system through cesspits and flowing water through steams. Heavy metals from industrial wastes are the major sources for pollution. Anthropogenic activities like industrial wastes, agricultural wastes, domestic wastes and the mining operation releases heavy metal s into environment [3, 4]. Heavy metals are serious pollutants because of their toxicity, persistence and
non degradability in the environment [5-8] . Some of the metals are useful for metabolic activity of organism, but there is a narrow gap between their essentiality and their toxicity.
MATERIALS AND METHODS:
STUDY AREA:
Angul–Talcher is highly developed industrial belt in ODISHA. The study area (Angul-Talcher region) is bounded by latitudes 20° 37’ N to 21° 10’ N and longitudes 84°53’ E to 85° 28’ E and situated at an average height of 139 m above mean sea level. The river catchment is characterized by Precambrian granites, gneisses and schist’sof Eastern Ghats with local intrusive and volcanic lithologies; lime stone, sand stone and shales of the Gondwanas[9,10,11] .The area comes under sub tropic monsoon climate with an average annual rainfall of 1370 mm. The temperature varies from 20.9° C to 46° C. At present, it accommodates several large and medium scale industries such as NALCO Smelter and its Captive Power Plant (CPP-960MW), Talcher Super Thermal Power Station, NTPC (TSTPS-3000MW), Talcher Thermal Power Station, KANIHA (TTP-460MW), Ferro alloys industries and various coal mines. These industrial activities affect various components of ecology and the environment and impart heavy metal contamination in the ground water.
FIELD SAMPLING:
DECEMBER) (FIG-1) from 2010-2015. Criteria for selection of sampling station were based on the locations of industrial units and land use pattern to quantify heavy metal concentration. Four sites were selected near the ash ponds of each industry i.e. NTPC, TTPS and NALCO.In the month of May the water level of the dug well is stood at about 15 meters and in November it stood at about 20 meters in almost all the wells under study. The samples
taken from 10 to 15 cm below the water surface using acid washed polyethylene container to avoid unpredictable changes in characteristic as per standard procedures [12]. Samples were collected in May- June each year for summer season, and in November- December each year samples were collected for winter season. Care was taken to collect subsequent samples from same location in both the seasons.
FIGURE-1 SKETCH OF THE STUDY AREA
Sl.No Sampling Point Sl.No Sampling Point
1 Santhapada(NE of TTPS Ash Pond) 7 Township(SW of Nalco Ash Pond)
2 Gurujanguli(SW of TTPS Ash Pond) 8 Kubodanbar (W of Nalco Ash Pond) 3 Anandbazar(W of TTPS Ash Pond ) 9 Takua (NE of NTPC Kaniha Ash Pond) 4 TTPS Colony(W of TTPS Ash Pond) 10 Mashannara(W of Nalco Ash Pond ) 5 Tanjalal (NE of Nalco Ash Pond ) 11 Kaniha I (SE of Nalco Ash Pond) 6 Balaramprasad(SE of Nalco Ash Pond ) 12 Kaniha II (SE of Nalco Ash Pond)
LABORATORY METHODS
Water samples were collected from all the respective sampling stations around the ash ponds of the industries. The collected samples were filtered (Whatman no. 42) and preserved with 6N of HNO3, HCl, and HCLO4for further analysis [12]. Concentrations of heavy metals like Pb, As, Cr, Cd and Se in water samples after HClO4,HNO3and HCl digestion were determined with an atomic absorption spectrometer (Model: Perkin ELMER: 303). Average values of three replicates were taken for each season determination. The average concentration value of both the seasons of each year was considered for analysis.
RESULT DISSUSSION:
TABLE -1 Average Heavy Metal Concentration near TTPS Ash Pond (all valves are in ppb)
Year Pb As Cr Cd Se
2010 11.8 10.015 2.475 1.32 2.4
2011 12.1 10.45 4.57 1.34 2.6
2012 12.7 13 4.84 1.41 3.2
2013 17.92 15.15 5.45 1.7 3.6
2014 18.24 15.5 5.95 2.1 4.6
2015 19.25 17 7.8 2.2 4.9
Mean 15.335 13.51917 5.180833 1.678333 3.55
Median 15.31 14.075 5.145 1.555 3.4
variance of sample 12.07063 8.133604 3.066984 0.153057 1.055
std deviation of sample 3.474281 2.851947 1.751281 0.391225 1.027132
Figure-2 VARIATION OF HEAVY METALS NEAR TTPS ASH POND
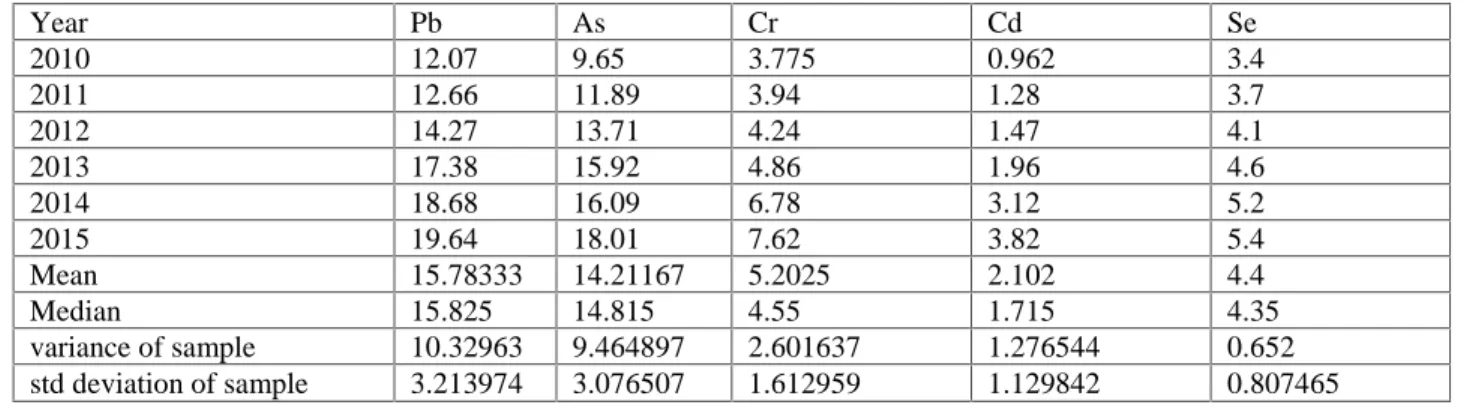
TABLE -2 Average Heavy Metal Concentration near NALCO CPP Ash Pond (all valves are in ppb)
Year Pb As Cr Cd Se
2010 12.07 9.65 3.775 0.962 3.4
2011 12.66 11.89 3.94 1.28 3.7
2012 14.27 13.71 4.24 1.47 4.1
2013 17.38 15.92 4.86 1.96 4.6
2014 18.68 16.09 6.78 3.12 5.2
2015 19.64 18.01 7.62 3.82 5.4
Mean 15.78333 14.21167 5.2025 2.102 4.4
Median 15.825 14.815 4.55 1.715 4.35
variance of sample 10.32963 9.464897 2.601637 1.276544 0.652
std deviation of sample 3.213974 3.076507 1.612959 1.129842 0.807465
0 5 10 15 20 25
1 2 3 4 5 6
CO
N
CE
N
TR
AT
IO
N
IN
p
pb
YEAR
Figure-3 VARIATION OF HEAVY METALS NEAR NALCO CPP ASH POND TABLE:3Average Heavy Metal Concentration near NTPC Kaniha Ash Pond (all valves are in ppb)
Year Pb As Cr Cd Se
2010 40.65 12.25 3.675 1.627 5
2011 42.86 13.65 3.98 1.78 5.7
2012 45.98 14.95 4.41 1.84 7.28
2013 58.14 16.49 5.56 2.28 7.64
2014 60.12 17.57 5.88 2.42 8.2
2015 61.83 18.2 6.32 2.95 9.1
Mean 51.59667 15.51833 4.970833 2.1495 7.153333
Median 52.06 15.72 4.985 2.06 7.46
variance of sample 89.57787 5.368097 1.193884 0.247266 2.377387
std deviation of sample 9.464558 2.316915 1.09265 0.497258 1.541878
FIGURE-4 VARIATION OF HEAVY METALS NEAR NTPC KANIHA ASH POND
It is observed that in the trend of six years of constant study it was found that there is an increasing trend in the concentration of the different heavy metals i.e. Pb ,As, Cr, Cd , Se but is within the permissible limit as prescribed by ISI. In area 1 i.e. at area around that
ash pond near TTPS Thermal Pb , As, Cr , Cd and Se has a mean concentration of 15.34 ppb ,13.52 ppb ,5.18 ppb ,1.68 ppb , and 3.55 ppb respectively. In area 2 i.e. at area around the ash pond near NALCO CPP Pb , As, Cr , Cd and Se has a mean 0
5 10 15 20 25
1 2 3 4 5 6
CO
N
CE
N
TR
AT
IO
N
IN
p
pb
YEAR
Pb As Cr Cd Se
0 10 20 30 40 50 60 70
1 2 3 4 5 6
CO
N
CE
N
TR
AT
IO
N
IN
p
pb
YEAR
Pb As
Cr Cd
concentration of 15.78 ppb ,14.21 ppb ,5.20ppb ,2.10 ppb , and 4.35 ppb respectively. In area 2 i.e at area around the ash pond near NTPC Kaniha Pb , As, Cr , Cd and Se has a mean concentration of 51.60 ppb 15.52 ppb ,4.97 ppb ,2.15ppb , and &7.15ppb respectively. The increasing trend may be attributed mainly due to increase in industrial activities in these power plants. Further the contamination of underground water is due to the seepage of the industrial waste, mining activities, organic, domestic waste and agricultural waste through soil. The increasing lead concentration may also be due to industrial waste as well as due to the less soluble minerals in natural water [17, 18]. The accumulation of chromium may be due high evaporation of surface water followed by elevated temperature [19].The concentration of cadmium may be due to the coal combustion in the power plants ,metal industry ,waste incineration[20] and also due to the domestic uses .
DATA EVALUATION: INDEXING APPROACH Heavy Metal Pollution Index:
Heavy metal pollution index (HPI) is a technique of rating that provides the composite influence of individual heavy metal on the overall quality of water. The rating is a value between zero and one, reflecting the relative importance of individual quality considerations and inversely proportional to the recommended standard (Si) for each parameter. Water quality and its suitability for drinking purpose can be examined by determining its quality index [13, 14, 15, 16]. The calculation of HPI involves the following steps
-1) The calculation of weight age of ithparameter,Wi
2) The quality rating for each of the heavy metal,Qi. 3) The summation of these sub-indices in the overall index
The weight age of ith parameter Wi = K/Si (1)
Where Wi is the unit weight age and Si the recommended standard for ith parameter, while k is the constant of proportionality.
Individual quality rating is given by the expression Qi = 100 Vi/Si (2)
Where Qi is the sub index of ith parameter, Vi is the monitored value of the ith parameter in μg/l and Si the standard or permissible limit for the ith parameter.
The Heavy Metal Index (HPI) is then calculated as follows
-HPI=∑ ( ∗ ) ∑
(3)
Where Qi is the sub index of ith parameter. Wi is the unit weight age for ith parameter, n is the number of parameters considered. The critical pollution index value is 75, above this value is not suitable for drinking purposes
In order to calculate the HPI of the water, the mean concentration value of the selected metals (Pb, Cd,As,Cr,Se) have been taken into account details the calculations of HPI with unit weightage (Wi) and standard permissible value (Si) as obtained in the presented study in Table 4,5,6.The HPI was calculated using Indian standard and the following data was observed for the three area of study for each year.
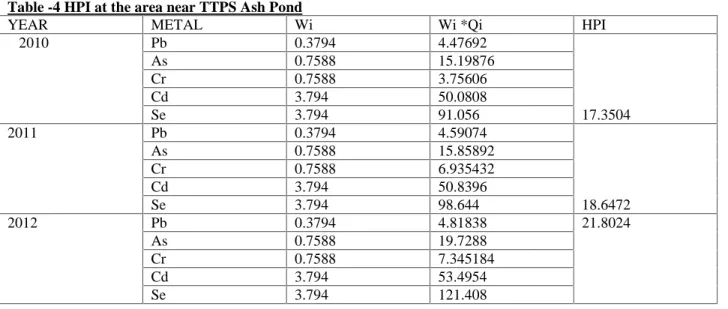
Table -4 HPI at the area near TTPS Ash Pond
YEAR METAL Wi Wi *Qi HPI
2010 Pb 0.3794 4.47692
17.3504
As 0.7588 15.19876
Cr 0.7588 3.75606
Cd 3.794 50.0808
Se 3.794 91.056
2011 Pb 0.3794 4.59074
18.6472
As 0.7588 15.85892
Cr 0.7588 6.935432
Cd 3.794 50.8396
Se 3.794 98.644
2012 Pb 0.3794 4.81838 21.8024
As 0.7588 19.7288
Cr 0.7588 7.345184
Cd 3.794 53.4954
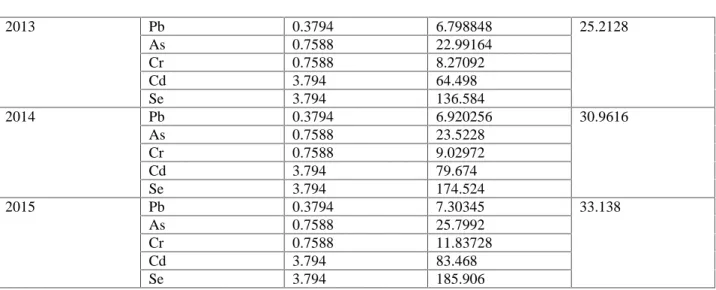
2013 Pb 0.3794 6.798848 25.2128
As 0.7588 22.99164
Cr 0.7588 8.27092
Cd 3.794 64.498
Se 3.794 136.584
2014 Pb 0.3794 6.920256 30.9616
As 0.7588 23.5228
Cr 0.7588 9.02972
Cd 3.794 79.674
Se 3.794 174.524
2015 Pb 0.3794 7.30345 33.138
As 0.7588 25.7992
Cr 0.7588 11.83728
Cd 3.794 83.468
Se 3.794 185.906
In this area it was found that each year the concentration of the heavy metal is increasing and it is observed that the water quality for drinking is getting degradedeach year but yet it’s safe to use.
Table -5 HPI at the area near NALCO CPP Ash Pond
YEAR METAL Wi Wi *Qi HPI
2010 Pb 0.3794 4.579358
20.0788
As 0.7588 14.64484
Cr 0.7588 5.72894
Cd 3.794 36.49828
Se 3.794 128.996
2011 Pb 0.3794 5.414038
22.9592
As 0.7588 18.04426
Cr 0.7588 5.979344
Cd 3.794 48.5632
Se 3.794 140.378
2012 Pb 0.3794 5.414038
25.7228
As 0.7588 20.8063
Cr 0.7588 6.434624
Cd 3.794 55.7718
Se 3.794 155.554
2013 Pb 0.3794 6.593972
30.26
As 0.7588 24.16019
Cr 0.7588 7.375536
Cd 3.794 74.3624
Se 3.794 174.524
2014 Pb 0.3794 7.087192 37.6864
As 0.7588 24.41818
Cr 0.7588 118.3728
Cd 3.794 118.3728
Se 3.794 197.288
2015 Pb 0.3794 7.451416 41.7664
As 0.7588 27.3319
Cr 0.7588 11.56411
Cd 3.794 144.9308
In this area it was found that the water quality is good but if the pollution continues in this rate then the water quality will become poor
Table -6 HPI at the area near NTPC Kaniha Ash Pond
YEAR METAL Wi Wi *Qi HPI
2010 Pb 0.3794 15.42261
30.682
As 0.7588 18.5906
Cr 0.7588 5.57718
Cd 3.794 61.72838
Se 3.794 189.7
2011 Pb 0.3794 16.26108
34.4552
As 0.7588 20.71524
Cr 0.7588 6.040048
Cd 3.794 67.5332
Se 3.794 216.258
2012 Pb 0.3794 17.44481 41.4168
As 0.7588 22.68812
Cr 0.7588 6.692616
Cd 3.794 69.8096
Se 3.794 276.2032
2013 Pb 0.3794 22.05832 45.5336
As 0.7588 25.02522
Cr 0.7588 8.437856
Cd 3.794 86.5032
Se 3.794 289.8616
2014 Pb 0.3794 22.80953 48.6368
As 0.7588 26.66423
Cr 0.7588 8.923488
Cd 3.794 91.8148
Se 3.794 311.108
2015 Pb 0.3794 23.4583 54.5964
As 0.7588 27.62032
Cr 0.7588 9.591232
Cd 3.794 111.923
Se 3.794 345.254
In this area the water quality has already become poor as per the ISI standard. Table 7: Status categories of HPI
HPI QUALITY OF WATER
0-25 Very good
26-50 Good
51-75 Poor
Above 75 Very poor (unsuitable for drinking)
PEARSON CORRELATION COEFFICIENT
Where X,Y are the values whose correlation coefficient is to be calculated. X and Y are the mean value of X and Y. The correlation coefficient is a measure of linear association between two variables. Values of the correlation coefficient are always between -1 and +1.
A correlation coefficient is a statistical measure of the degree to which changes to the of one change
to the value of another. In positively correlated variables, the value increases or decreases in tandem. Correlation coefficients are expressed as values between +1 and -1. A coefficient of +1 indicates a perfectpositive correlation: A change in the value of one variable will predict a change in the same direction in the second variable. A positive correlation is a relationship between twovariablessuch that their values increase or decrease together.
The correlation between the different metals of each area was calculated using Pearson coefficient.
Table -8 Correlation Coefficient at the area near TTPS Ash Pond
Pb As Cr Cd Se
Pb 1
As 0.954365 1
Cr 0.842264 0.905498 1
Cd 0.94047 0.917729 0.86528 1
Se 0.926176 0.955015 0.908191 0.983229 1
Table -9 Correlation Coefficient at the area near NALCO CPP Ash Pond
Pb As Cr Cd Se
Pb 1
As 0.966179 1
Cr 0.927726 0.86598 1
Cd 0.942082 0.898792 0.996628 1
Se 0.990069 0.964506 0.953771 0.966559 1
Table -10 Correlation Coefficient at the area near NTPC Kaniha Ash Pond
Pb As Cr Cd Se
Pb 1
As 0.972064 1
Cr 0.994104 0.984442 1
Cd 0.936503 0.937832 0.964273 1
Se 0.926241 0.98095 0.952559 0.920258 1
FIGURE 5- CORRELATION OF HEAVY METALS NEAR TTPS ASH POND
FIGURE 6- CORRELATION OF HEAVY METALS NEAR NALCO CPP ASH POND
FIGURE 7- CORRELATION OF HEAVY METALS NEAR NTPC KANIHA ASH POND FIGURE 5- CORRELATION OF HEAVY METALS NEAR TTPS ASH POND
FIGURE 6- CORRELATION OF HEAVY METALS NEAR NALCO CPP ASH POND
FIGURE 7- CORRELATION OF HEAVY METALS NEAR NTPC KANIHA ASH POND FIGURE 5- CORRELATION OF HEAVY METALS NEAR TTPS ASH POND
FIGURE 6- CORRELATION OF HEAVY METALS NEAR NALCO CPP ASH POND
CONCLUSION:
The present study reveals that most of the water samples of ground water system at Angul –Talcher industrial area were found less polluted in heavy metal contamination profile. Samples collected from NTPC Kaniha evidence the slightly significant metal concentration in water samples .It is attributed to the concentration of various mines and associated power plants industries. The HPI is very useful tool in evaluating over all pollution of water bodies with respect to heavy metals .The HPI values of the present study indicate that the water samples from the wells and tube wells are not critically contaminated with respect to heavy metals. But the correlation is showing that increases in concentration of heavy metals are to be inter related. It is proposed that if a good correlation can be discovered then determination of few important water quality parameters along with toxic heavy metals which are highly correlated to other would provide an overall idea of water quality. Though correlation among water quality parameters have been studied by different group of worker[21,22,23] .It is still required to have similar regular investigation to provide up to date possible information from the different sources of pollution. More over metal pollution by mining and associated industrial activities is somewhat moderate because of strict implementation of clean technology and environmental measures by industries.
REFERENCES:
1. Rajankar P.N., Gulhane S.R., Tambekar D.H., Ramteke D.S, and Wate S.R., Water Quality Assessment of Ground water Resources in Nagpur Region (India) Based on WQI, E-Journal of Chemistry, 6 (3), (2009).
2. D.P.Sahu et al. Application 0f Hpi (Heavy Metal Pollution Index) for The Assessment of Ground Water Quality in Janjgir-Champa District Of Chhattisgarh State Of India International Journal of Modern Sciences and Engineering Technology (IJMSET)
Volume 2, Issue 12, 2015, pp.62-66
3. J sirajudeen, and S Arul Manikandan., Seasonal variation of heavy metal contamination of ground water in and around Uyyakondan channel Tiruchirappalli district, Tamil Nadu, pelagia research library., 3(5):1113-1119 (2012).
4. M. Chakravarty and A. Patgiri, “Metal Pollution Assessment in Sediments of the
Dikrong River, N. E. India,”Journal of Human Ecology, Vol. 27, No. 1, 2009, pp.63-67
5. S. Olivares-Rieumont, D. de la Rosa, L. Lima, D. Graham, K. Alessandro, J. Borroto, et al.,“Assessment of Heavy Metal Levels in Almendares River Sediments— Havana City, Cuba,” Water Research, Vol. 39, No. 16, 2005, pp. 3945-3953. doi:10.1016/j.watres.2005.07.011
6. I. Brunner, J. Luster, M. Günthardt-Goerg and B. Frey, “Heavy Metal Accumulation and Photostabilisation Potential of Tree Fine Roots in a Contamination Soil,” Environmental Pollution, Vol. 152, No. 3,
2008, pp. 559-568.
doi:10.1016/j.envpol.2007.07.006
7. A. Idris, M. A. H. Eltayeb, S. Potgieter-Vermaak, R. Van Grieken and J. Potgieter, “Assessment of Heavy Metals Pollution in Sudanese Harbors along the Red Sea Coast,” Microchemical Journal, Vol. 87, No. 2,
2007,
pp.104-112.doi:10.1016/j.microc.2007.06.004 8. S. Morin, T. Duong, A. Danbrin, A. Coynel,
O. Herlory, M. Baudrimont, et al., “Long-Term Survey of Heavy- Metal Pollution, Biofilm Contamination and Diatom Community Structure in the Rio Mort Watershed, South-West France,” Environmental Pollution, Vol. 151, 2008,pp. 532-542. doi:10.1016/j.envpol.2007.04.02 9. Sene-Johansen, S., (1995). Strengthening of
the state pollution control board, Orissa State. International Consultant Report, Norway.
10. Panda, U. C.; Sundaray, S. K. ; Rath, P.; Nayak, B. B.; Bhatta,D., (2006). Application of factor and cluster analysis for characterization of river and esturine water system-A case study: Mahanadi River (India). J. Hydro., 331 (3-4), 434-445 11. Sundaray, S. K.; Panda, U. C.; Nayak, B. B.;
Bhatta, D.,(2006). Multivariate statistical techniques for the evaluation of spatial and temporal variation in water quality of Mahanadi river-estuarine system (India). A case study. Environ. Geochem. Health, 28 (4), 317-330
13. Prasad B. and Kumari S., Heavy Metal Pollution Index of Ground Water of an Abandoned Open Cast Mine Filled with Fly Ash: a Case Study, Mine Water and the Environ., 27 (4), 265-267 ,(2008).
14. Reza R. and Singh G., Assessment of heavy metal contamination and its indexing approach for river water. Int.J. Environ. Sci. Tech., 7 (4), (2010).
15. Mohan S. V., Nithila P. and Reddy S. J., Estimation of heavy metal in drinking water and development of heavy metal pollution index, J. Environ. Sci. Health A., 31(2),283-289 (1996).
16. Prasad, B.; Mondal, K. K., (2008). The impact of filling an abandoned opencast mine with fly ash on ground water quality: A case study. Mine Water Environ., 27 (1), 40-45,(2008)
17. Venugopal, T.; Giridharan, L.; Jayaprakash, M.; Velmurugan, P.M., (2009a). A comprehensive geochemical evaluation of the water quality of River Adyar, India. Bull. Environ. Contam. Toxicol., 82 (2), 211-217 .
18. Venugopal, T.; Giridharan, L.; Jayaprakash, M., (2009b). Characterization and risk assessment studies of bed sediments of River Adyar-An application of speciation study. Int. J.Environ. Res., 3 (4), 581-598 . 19. Abdel Satar, A. M., (2001). Environmental
studies on the impact of the drains effluent
upon the southern sector of Lake Manzalah. Egypt. J. Aquat. Biol. Fish, 5, 17-30
20. Brian, S. C.; Bishop, M., (2009). Seasonal and spatial variation of metal loads from natural flows in the upper Tenmile Creek watershed, Montana. Mine Water Environ., 28 (3), 166-181
21. Naseema Khatoon, Altaf Husain Khan,
Masihur Rehman andVinay
Pathak,(2013)Correlation Study For the Assessment of Water Quality and Its Parameters of Ganga River, Kanpur, Uttar Pradesh, India IOSR Journal of Applied Chemistry (IOSR-JAC) e-ISSN: 2278-5736.Volume 5, Issue 3 (Sep.– Oct. 2013), PP 80-90www.iosrjournals.org
22. Onkar Singh Brraich, Sulochana Jangu (2015)Evaluation of Water Quality Pollution Indices for Heavy Metal Contamination Monitoring in the Water of Harike Wetland (Ramsar Site), India International Journal of Scientific and Research Publications, Volume 5, Issue 2, February 2015 1 ISSN 2250-3153 www.ijsrp.org