275
AUTOMATION THE WORKING PROCESS OF SPRINKLING
MACHINES - DECISIVE FACTOR TO MAXIMIZE THE BIOLOGICAL
EFFECT AND POLLUTION PREVENTION OF THE ENVIRONMENT
GLODEANU MIHNEA, VASILE CRISTIAN, ALEXANDRU TUDOR University of Craiova, Faculty of Agriculture Keywords: sprayer, displacement velocity, liquid rate
ABSTRACT
Plant protection represents one of the most important links of the technologies of agricultural crops and at the same time, a main factor in the increase of production and labor productivity.
The current orientation of the diseases, pests and weeds control to plant crops is to ensure more effective chemical treatments, in view of the
continuing growth of agricultural production and the prevention the pollution of the environment. This implies that for each applied treatment to use an appropriate quantity of phyto-pharmaceutical substance, which should be applied properly, so that the effect of the treatment must be a maximum, and its effects on the environment should be minimal.
INTRODUCTION Increasing the dose of the active
substance, or non-compliance of the rate of liquid imposed by the technical requirements may lead to an incorrect execution of a treatment, as well as the pollution beyond the torelabile limits of environment.
Having in view of these aspects it is necessary to prepare, checking and efficiency adjusting the of the sprayers (before carrying out any work to combat disease, pests or weeds), jn order to ensure superior quality indicators and to minimize the impact of the phyto-pharmaceutical substances on the environment (Glodeanu M. and collab., 2016; Naghiu Livia, 2008; Stahli W, 2003; Stahli W, Bungescu T., 2005; Vasile C. and collab, 2016).
Obtaining a Increased efficiency of chemical treatments, with minimum costs
is possible only if these are carried out with superior qualitative indices and very precise as regards ensuring the stability of the rate of solution to be administered on the treated surface (Glodeanu M. and collab., 2011; Popescu S., Ghinea T., 1986).
The stability of the liquid rate is a major requirement. One of the factors which have a decisive influence on ensuring stable liquid rates is the variation in the travel of displacement velocity of the tractor-sprayer unit (Glodeanu M, Alexandru T., 2011).
An increase of the stability index of applied rate cannot be achieved only by automating the work process of the sprayer, ensuring at the same time an optimal protection of the environment (Glodeanu M. and collab., 2011; Popescu C., 2009; Vasile C., 2015).
MATERIAL AND METHODS The primary objective of the
experimental determinations was making a comparative study on the qualitative indices obtained in the case of a work of
weeding control, using two types of sprayers:
276
classic, without automatic adjustment system) (fig. 1);
- Towed sprayer MET 1500.), intended for the management of the herbicides, fungicides and liquid fertilizers in field crops
(manufacturer: S.C.
TEHNOFAVORIT S.A. - equipped with automatic adjustment system of the liquid flow with displacement velocity, type Computer BRAVO 180) (fig. 2).
-
Fig. 1. Carried equipment for the management of the herbicides, EEP-600.
Fig. 2. Towed sprayer MET 1500 for the management of the herbicides,fungicides and liquid fertilizers in field crops.
The following preparatory operations were performed:
- working height adjustment of the boom (corresponding to the distance of 500 mm between the spraying noozles): for EEP-600, at 560 mm; for MET 1500, at 500 mm;
- spray nozzle position adjustment (on the spraying boom);
- establishing and adjusting the liquid rate: this adjustment is performed (for both sprayers) by proper adjustment of the working pressure;
277
the information provided by the slide rule Lechler, for the conditions specified above result: the value of the liquid flow per noozle is of 1,25 l/min and the necessary working pressure is 3,4 bar.
Experimental investigation of the behavior of the sprayers was based on the collection of the distributed particles on a well defined area (samples of absorbent paper having a surface S=0,16 m2), followed by the quantitative analysis of samples by weighing, data acquisition and processing in the computer system (Glodeanu M. and collab., 2011).
The experimentation of sprayers (equipped or not with the electronic adjusting system) was done after a method that consisted in determining the following indices of work (Glodeanu M. and collab., 2015; Glodeanu M. and collab., 2016):
- spray deposition on paper targets;
- the average quantity of spray deposition on samples test (gm), using the
relations: ; 0 0 1 m i i n i m g n g g g
1 0 [g]n g g i n i om
(1) where: gi is the quantity of solution distributed on asamples test, in g;
g0i - weight of samples test in initial conditions, in g;
g0m - average weigh of samples test, in initial
conditions, in g;
n - number of samples test.
- uniformity of distribution on the traveling direction (Udl) determined with
relation: [%] 100 1 ) ( 100 100 2 1
m m i n i V dl g n g g C U (2) where Cv is the coefficient of variation of the distributionuniformity on the traveling direction, in %.
- the stability of liquid rate, using the relation: 100 1 ) ( 100 1 100 2 1
m m i n i N N N n N N S [%] (3)
Measurement equipment and data acquisition includes the following
components: portable computer,
electronic balance Mettler model Pm 6000 (precision 0,1 g), collecting system for distributed particles, based on absorbent paper.
In order to achieve experimental tests are placed at ground level (horizontally and equidistant – at 2 m) the paper samples (in the range of the central section of the boom). Before placing samples for tests it will proceed to their individual weighing. The obtained values (g0i) are registered into the computer,
using a specialized software, which allows recording the measured values by cumulating (in their order of determining with the electronic balance).
After performing the tests, weighing values of the samples (gi+g0i) are
recorded and compared with the values g0i,
thereby obtaining the amount of solution collected on each sample.
In order to determine the distribution diagrams on the direction of travel of the sprayers (and to observe as compared the evolution of sprayers behavior, with and without the control system) were performed a number of four different tests, in the conditions of variable displacement velocities, specific to the work process what was analyzed: two tests were performed with EEP-600 sprayer (which is not equipped with automatic control system); one test was performed with MET 1500 sprayer (which is equipped with automatic control system).
Conditions for conducting the tests
278
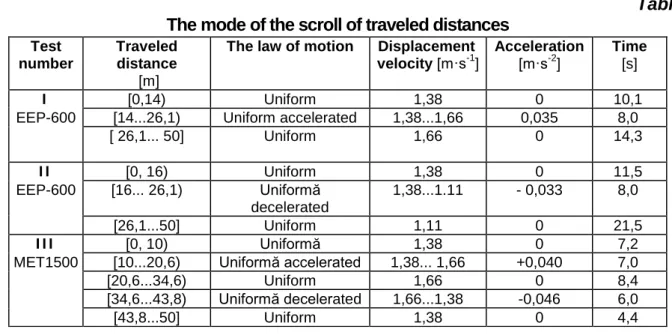
Table 1
The mode of the scroll of traveled distances Test
number
Traveled distance
[m]
The law of motion Displacement velocity [m·s-1]
Acceleration
[m·s-2
]
Time
[s]
I [0,14) Uniform 1,38 0 10,1
EEP-600 [14...26,1) Uniform accelerated 1,38...1,66 0,035 8,0
[ 26,1... 50] Uniform 1,66 0 14,3
I I [0, 16) Uniform 1,38 0 11,5
EEP-600 [16... 26,1) Uniformă decelerated
1,38...1.11 - 0,033 8,0
[26,1...50] Uniform 1,11 0 21,5
I I I [0, 10) Uniformă 1,38 0 7,2
MET1500 [10...20,6) Uniformă accelerated 1,38... 1,66 +0,040 7,0
[20,6...34,6) Uniform 1,66 0 8,4
[34,6...43,8) Uniformă decelerated 1,66...1,38 -0,046 6,0
[43,8...50] Uniform 1,38 0 4,4
RESULTS AND DISCUSIONS
The data files with the weighing values of the samples and average liquid rates ensured for the tests are presented in table 2 and 3.
Table 2
Weighing values of the samples and average liquid rates ensured for tests I and II
Number of sample
Weighing values of spray deposition per
target gi(g)
Average quantity distributed on the the working range
gm(g)
Average spray volume rate on the the working
range
Nm (l, kg/ha)
TEST 1 TEST 3 TEST 1 TEST 3 TEST 1 TEST 3
1 4,6 4,6 0...14 m
4,70
0....16 m
4,73
293,7
296,0
2 4,6 4,7
3 4,7 4,8
4 4,8 4,7
5 4,8 4,7
6 4,7 4,8
7 4,7 4,6
8 4,3 5,0 14...26,1 m
3,81 238,5
9 4,4 5,2 16...26,1 m
5,60
350,0
10 3,8 5,6
11 3,6 5,9
12 3,4 5,7
13 3,4 5,6
14 3,2 5,7 26,1...50 m
3,40
20...30 m
5,69 212,5 355,7
15 3,4 5,8
16 3,5 5,7
17 3,3 5,7
18 3,4 5,6
19 3,4 5,7
20 3,3 5,6
21 3,6 5,8
22 3,5 5,7
23 3,3 5,6
24 3,5 5,7
25 3,4 5,7
gm1=3,97 gm2=5,34 Nm1=248,1
l( kg/ha)
Nm2=333,7
l( kg/ha)
279
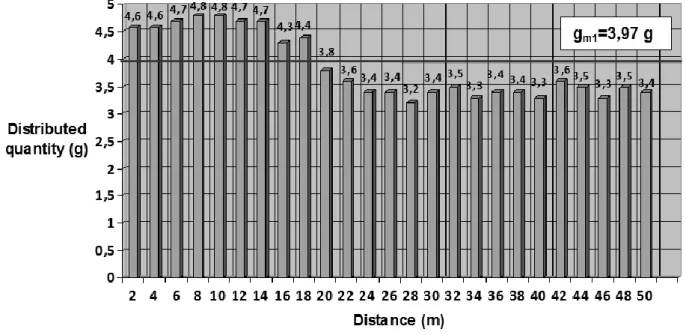
The dependences of the amount of solution distributed on the treated surface and
distance (for test I and II) are represented in the graph on figures 3 and 4.
Fig. 3. The dependence of the amount of solution distributed on the treated surface and distance (for test I).
Fig. 4. The dependence of the amount of solution distributed on the treated surface and distance (for test II).
From the above date base it can be observed the following;
- for the test I, the uniformity of the longitudinal distribution (Udl) of the sprayer
(not fitted with automatic adjusting system) is in this case of 84,77 % and does not fit within the limits of acceptability; the coefficient of variability CV=15,23 % indicates an unacceptable distribution; it should be noted that the error of treatment is high and does not
fit under the basic requirements; the stability of the liquid rate is calculated by obtaining the instant rules Ni , resulting SN =84,77 %; aloso,
it should be noted that the error of treatment is high and it does not fit under the basic technical requirements.
- in case of test II (also the sprayer is not fitted with automatic adjusting system), the uniformity of the longitudinal distribution (Udl)
280
variability CV=8,53 % indicates an acceptable distribution; the stability of the liquid rate has value of 91,47 %; even if Udl value is
acceptable, in this case, it should be taken into account of the fact that the errors for the
application of the treatment on the working intervals 2 and 3 are very high and it is not ensured the prescribed average quantity of the solution on the treated surface;
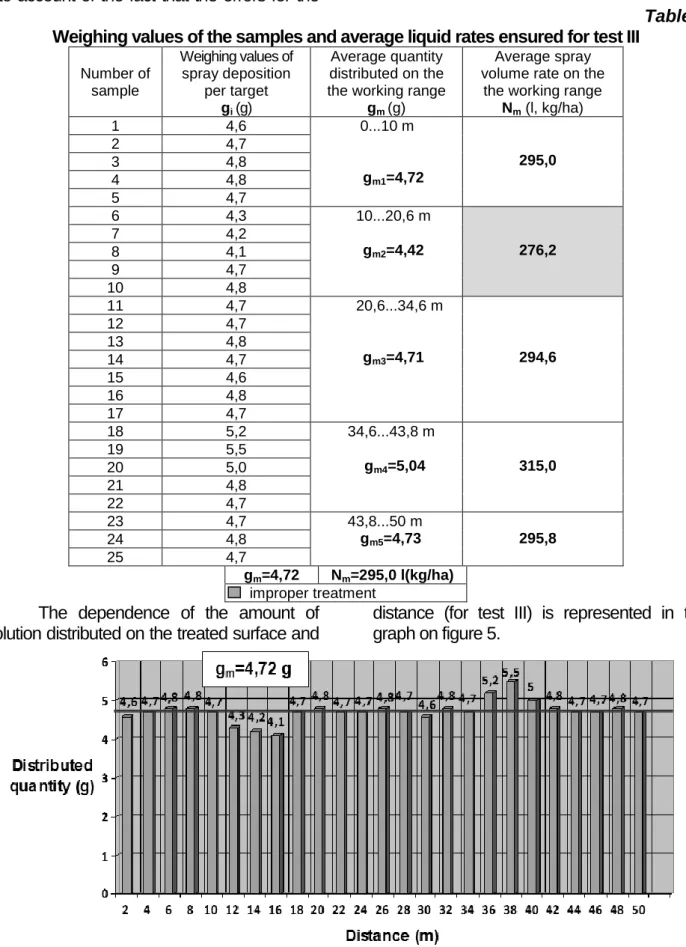
Table 3
Weighing values of the samples and average liquid rates ensured for test III
Number of sample
Weighing values of spray deposition
per target
gi(g)
Average quantity distributed on the the working range
gm(g)
Average spray volume rate on the
the working range
Nm (l, kg/ha)
1 4,6 0...10 m
gm1=4,72
295,0
2 4,7
3 4,8
4 4,8
5 4,7
6 4,3 10...20,6 m
gm2=4,42
276,2
7 4,2
8 4,1
9 4,7
10 4,8
11 4,7 20,6...34,6 m
gm3=4,71 294,6
12 4,7
13 4,8
14 4,7
15 4,6
16 4,8
17 4,7
18 5,2 34,6...43,8 m
gm4=5,04 315,0
19 5,5
20 5,0
21 4,8
22 4,7
23 4,7 43,8...50 m
gm5=4,73 295,8
24 4,8
25 4,7
gm=4,72 Nm=295,0 l(kg/ha)
improper treatment
The dependence of the amount of solution distributed on the treated surface and
distance (for test III) is represented in the graph on figure 5.
281
Analysis of the data obtained show that:
- for the test III (the sprayer is equipped with automatic adjusting system), the uniformity of the longitudinal distribution (Udl) has value of
98,43 %;
- the coefficient of variability CV=1,57 % indicates a good distribution;
- the stability of the liquid rate has value of 98,43 %;
- the error for the application of the treatment has very low values and fit under the basic technical requirements.
CONCLUSIONS 1. Comparative study carried out
highlights the need of equipping of the sprayers with automatic adjustment
systems of working parameters
(especially with electronic type regulators), which ensures a superior adjustment process, imposed by the technical requirements and orders in force;
2. Equipping the sprayers with evolved adjusting systems of the work parameters of the thing show the following:
- the effectiveness of the chemical tratments ensured by the sprayers which are equipped with automatic adjusting systems is indicated by increasing the longitudinal uniformity of distribution (Udl)
and the stability of the standard per hectare (SN), from 84,7% to 98,4%;
- also the effectiveness of the chemical tratments ensured by this category of
sprayers is indicated by subtracting the value of the coefficient of variability (CV) of the distribution on the direction of travel (CV) from 15,23 % to 1,57 %;
- the data obtained confirm in this case, that
the errors of the application of the
treatment have low values and fit
under
the
basic
technical
requirements.
3. The advantages of an economic nature (increasing productivity; reduce the consumption of the active substance; the reduction of production costs), technical nature (increase the qualitative indices of the work carried out), and last but not least, the protection of the environment are aspects which pleads in favor of the use of these types of automatic adjustment systems.
BIBLIOGRAPHY
Glodeanu M., Vasile C, Alexandru T., 2016, Experimental researches concerning the performances of electronic adjustment systems that equips sprinkling machines, SGEM 2016 Conference Proceedings, Book3 Vol. 2, pp. 119-126.
Glodeanu M., Alexandru T., Boruz S., Sărăcin I., 2015, Agricultural and horticultural machines-Representative
types, adjustments, SITECH
Publishing House, Craiova.
Glodeanu M., Alexandru T., Boruz S., Popescu S., 2011, Experimental research on electronic system for automatic adjustment of working flow and moving velocity in agricultural
spraying machines, 10th International Scientific Conference Engineering for Rural Development, Jeglava.
Glodeanu M., Alexandru T., 2010,
Establishing the consequences of the liquid rate error aplication at treatments ensured by spinkling machines equipped with electronic adjusting system of work quality index, Annals of University of Craiova, Agriculture, Montanology, Cadastre series, Vol. 40(2).
Nagiu Livia, 2008, Horticultural
machinery and equipment,
282
Popescu S.,Ghinea T., 1986,
Automatization of machines and installations used in agriculture, SCRISUL ROMÂNESC Publishing House, Craiova.
Popescu C., 2009, Ecopedologic, UNIVERSITARIA Publishing House,
Craiova, ISBN 978-973-742-984-1. Stahli W., Bungescu T., 2006,
Apparatus, equipment and machinery for plant protection, AGROPRINT Publishing House, Timișoara.
Stahli W., 2003, Machines for the application of the plant protection treatments and foliar fertilization of vegetable crops, AGROPRINT Publishing House, Timișoara.
Vasile C., Glodeanu M., Alexandru T., 2016, Automation of grinding equipments used in the process of obtaining the compound feed in order to respect the European norms for environment pollution, SGEM 2016 Conference Proceedings, Book5 Vol. 1, pp. 97-104.