ROMANIAN SUGAR RESERVES IN WORLD AND REGIONAL CONTEXT
(2009 - 2011)
PÂNZARU R.L., MEDELETE D.M. Faculty of Agronomy, University of Craiova
Key words: sugar, total food available, annual availability / person, availability with a day / person daily food availability / person
ABSTRACT
Annually, are produced almost 175 million tons of crystallized sugar in the world today, the majority (80%) coming from sugar cane. This amount, relative to more than 7.2 billion inhabitants of the planet, show that for every man are produced almost 24.3 kilograms. This amount would be so small, but in some countries Sugar consumption per capita goes 60 kg / year, while in others consumption is almost negligible. And if we compare the consumption of sugar townsman and sugar consumption of the rural population, we find that in many areas around the globe are populations who rarely get to taste the sweetness of sugar.
The first plant which has provided human raw material for crystal sugar was cane sugar, from which more than 1800 years ago, could be obtained by populations on Indian Territory a substance sweet, half-hardened color brown so appearing shortly the crystallized sugar.
Like sugarcane, beet was cultivated due to the sweet taste of the leaves, petioles and roots and this happened to 3500 - 4000 years ago.
Sugar from beet was discovered long before our era, sweet red beet juice is recommended in medicine instead of honey.
INTRODUCTION
Sugar cane has expanded in culture in Brazil and other countries in South and Central America, Australia, Asia (China, Philippines and Indonesia) and several African countries. This plant is perennial plantation may be exploited 5-7 years.
In Cuba sugarcane vegetation found good conditions today as 150 years ago. This country in 1980 stood at the front positions in the world in production of sugar cane. In 1970 the country's sugar production was 7.5 million tons, and in 1974, 6 million tons in the year is surpassed only by Brazil, which produced nearly 8 million tons. In Cuba, 252 cane sugar factories extract. Annual sugar production per capita is 660 kg Cuba (1990). Currently, Cuba is the fourth global force in the production of sugar cane, along with Brazil, India and Mexico. Sugar cane belongs to the grass family called scientific Saccharum officinarum, grow of 2-4 m high and in bone stem contains about 14% sugar.
Sugar cane is a plant of warm regions, tropical and subtropical, where there is no winter, and the average annual temperature does not fall below 16 ° C. For high yields required a large amount of rainfall.
Across the globe, sugar beet (Beta vulgaris saccharifera) is grown on about 8.5 million hectares, of which in Russia, are cultivated 3.5 million hectares and in the rest of Europe 3 million hectares. Compared to the average of the years 1948 - 1953, the area planted with sugar beet Russia (and CIS) amounts to almost 12 million ha.
The average yields per hectare, is given in France are produced about 85 t in Spain 78 t, UK 68 t in Germany 63 t. If we think that from 100 kg of roots are obtained about 14 kg of crystal sugar, we deduce from production of beet roots per hectare is obtained 9000-10000 kg sugar.
METHOD AND MATERIAL
In order to perform the work was used a system of indicators specifically for the balance sheet of agricultural products, system used and recommended by the United Nations Food and Agriculture Organization - FAO.
Working with specific indicators is based on the aspects relating to establishment of availability for any product – availability of total food (t) annual availability / person (kg / person / year), daily availability / person (g / person / day), availability daily food / person (kcal / person / day) daily protein availability / person (g / person / day) and daily availability of fat (g / person / day).
In the case of raw sugar, information is found for the first four indicators.
Referring to the total food available, taking into consideration its components and their participation in setting the general level of the indicator, the percentage structure was formed, while for the rest of indicators was used the percentage report beside registered global level.
The paper presents the indicators aforementioned worldwide, continental (Africa, America - totaled all components, Asia, Europe and Oceania), but also for the European Union and Romania.
RESULTS AND DISCUSSIONS
Table 1. Contains the total food availability for the period 2009-2011.
Table 1. Sugar - The total food availability (tons)
Spec.
YEAR Average of the
period
2009 2010 2011
Effective* Str.**% Effective* Str.**
% Effective
* Str.**% Effective** Str.**%
Africa 13603395 10,22 14515573 10,83 14646502 10,63 14255156,56 10,56 America 32644257 24,53 31897155 23,79 32654588 23,68 32398666,78 23,99 Asia 59227296 44,49 60088839 44,82 62577891 45,38 60631342,17 44,91 Europe 26495494 19,91 26459630 19,73 26894376 19,50 26616499,78 19,71 Oceania 1129893 0,85 1113921 0,83 1117485 0,81 1120433,16 0,83
World 133100335,5 100 134075118,46 100 137890841,38 100 135022098,45 100 EU 17084013 12,83 16784064 12,52 16876144 12,24 16914740,29 12,53 Romania 609137,37 0,46 513940,27 0,38 507618,34 0,37 543565,33 0,40
*http://faostat3.fao.org/download/FB/CC/F(10.05.2015) **own calculation
The year 2009 is characterized by a total of 133100335.5 disposable t, on which each continent has contributed with: Oceania 0.85% 1129893 t, 10.22% African -13603395 t, 19.91% Europe - 26495494 t, 24.53% America - 32644257 44.49% t and Asia - 59227296 t. European Union held a total of 17084013 t disposable and Romania 609137.37 t - values that are 12.83 and 0.46 respectively % of total global availability.
shares of 0.38 and respectively 12.52% in the global level of the indicator (513940.27 and 16784064 t).
For 2011 it is found that, availability worldwide has reached a total 137890841.38 t, of which Oceania achieved 1117485 t - 0.81% 14646502 t Africa - 10.63%, Europe 26894376 t - 19.50 %, America 32654588t - 23.68%, and Asia 62577891 t - 45.38%. In these circumstances the EU and Romania have registered worldwide with availability of 16876144 and 507618.34 t (12.24 and respectively 0.37%).
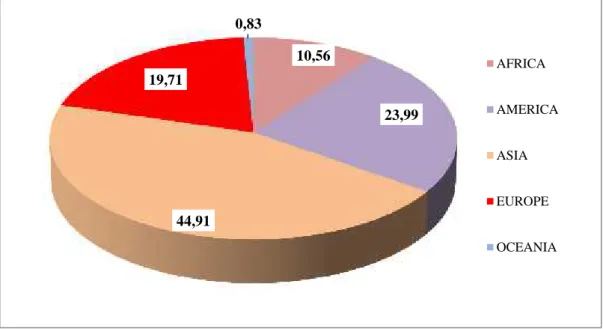
The average period resulting from the above time sequences are characterized by a disposable total of 135022098.45 t, on which the continents contributed as follows (Fig. 1): 44.91% Asia 60631342.17 t; 23.99% America 32398666.78 t; 19.71% Europe -26616499.78 t; 10.56% Africa - 14255156.56 t; Oceania 0.83% - 1120433.16 t.
Fig. 1. SUGAR. World total availability - structure, period average (%)
Regarding the specific situation for the EU and Romania are found the average shares - worldwide - 12.53 and 0.40% respectively (543565.33 and 16914740.26 t).
Data related to annual availabilities per capita are given in Table 2.
In 2009 is found a global level of 19.89 kg / person, with limits of variation by 14.94 kg / person in Africa (-24.89%) and 39.30 kg / person for Oceania (+97,59%). For the rest of the continents, except Asia (14.49 kg / person - 72.85% compared to the global situation), the indicator exceeded the global situation as follows: 76.92% America (35.19 kg / person), 80.29% Europe (35.86 kg / person). Regarding EU and Romania situations, there are exceeding of 1.70 and 1.39 times of the reporting level (global situation), reaching value of 33.87 and 27.80 kg / person.
If we analyze the specific situation of 2010, the limits of variation observed raged from 14.55 kg / person in Asia, up to 38.16 kg / person for Oceania, the global level of the indicator reached 19.80 kg / person. In those circumstances, beside the general situation of the world we are discussing about subunit levels for Asia and Africa (73.48 and 78.59% - 15.56 kg / person for the second continent) and situations above par for America (171.82 % - 34.02 kg / person), Europe (180.56% - 35.75 kg / person), Oceania (192.73%), EU (167.53% - 33.17 kg / person) and Romania (118.74% - 23.51 kg / person).
10,56
23,99
44,91 19,71
0,83
AFRICA
AMERICA
ASIA
EUROPE
Table 2. Sugar - Food availability per year (kg / person)
Specif.
YEAR
Period average
2009 2010 2011
Effective*
% beside
world level**
Effective*
% beside
world level**
Effective*
% beside
world level**
Effective*
% beside
world level**
Africa 14,94 75,11 15,56 78,59 15,33 76,12 15,27 76,58 America 35,19 176,92 34,02 171,82 34,48 171,20 34,56 173,32
Asia 14,49 72,85 14,55 73,48 14,99 74,43 14,67 73,57 Europe 35,86 180,29 35,75 180,56 36,29 180,19 35,97 180,39 Oceania 39,30 197,59 38,16 192,73 37,74 187,39 38,40 192,58
World 19,89 100 19,80 100 20,14 100 19,94 100
EU 33,87 170,29 33,17 167,53 33,26 165,14 33,43 167,65 Romania 27,80 139,77 23,51 118,74 23,58 117,08 22,47 112,69
*http://faostat3.fao.org/download/FB/CC/F(10.05.2015) **own calculation
The year 2011 is characterized by a global indicator level of 20.14 kg / person, with variation limits from 14.99 kg / person in the case of Asian continent (-25.57%) up to 37.74 kg / person for Oceania (+ 87.39%). Romania presents an annual disposable of 23.58 kg / person (+ 17.08%) and the European Union recorded 33.26 kg / person (+ 65.14%). If we analyze the situation for other continents are observed, compared to the global situation, just a sub unitary level in Africa (15.33 kg / person, 23.87%) the overruns being 71.20% in America (34, 48 kg / person) and 80.19% in Europe (36.29%).
The average period under review, shows a global level for the indicator of 19.94 kg / person, to which the components analyzed, are as follows (Fig. 2): 73.57% Asia (14.67 kg / person); 76.58% Africa (15.27 kg / person); Romania 112.69% (22.47 kg / person); EU 167.65% (33.43 kg / person); 173.32% America (34.56 kg / person); 180.39% Europe (35.97 kg / person); Oceania 192.58% (38.40 kg / person).
Africa
America Asia
Europe
Oceania
World
EU
Romania 15,27 34,56
14,67
35,97 38,4
19,94 33,43
22,47 76,58
173,32
73,57
180,39 192,58
100
167,65
112,69
The daily sugar availability / capita (g / day / person) is shown in the Table 3.
Table 3. Sugar - The daily food availability (g/day/pers)
Specif.
ANUL Average of
The period
2009 2010 2011
Effective*
% Beside
world level**
Effective*
% Beside
world level**
Effective*
% Beside
world level**
Effective**
% Beside
world level**
Africa 40,93 75,13 42,62 78,56 42,01 76,15 41,85 76,61 America 96,41 176,96 93,22 171,83 94,46 171,22 94,69 173,33
Asia 39,70 72,87 39,85 73,46 41,07 74,44 40,21 73,60 Europe 98,26 180,36 97,96 180,57 99,44 180,24 98,55 180,40 Oceania 107,68 197,65 104,54 192,70 103,4 187,42 105,21 192,59
World 54,48 100 54,25 100 55,17 100 54,63 100
EU 92,78 170,30 90,87 167,50 91,12 165,16 91,59 167,66 Romania 76,16 139,79 64,41 118,73 63,77 115,58 68,11 124,68
*http://faostat3.fao.org/download/FB/CC/F(10.05.2015) **own calculation
In 2009, there is a daily availability world per capita of 54.48 g / person, to which can be found both above par and sub unitary levels. So, the comparison term is exceeded by 39.79% in Romania (76.16 g / person), 70.30% by the EU (92.78 g / person), 76.96% of America (96.41 g / person) and 80.36% for Europe (98.26 g / person). Levels sub unitary appear in case of African continent - 75.13% (40.93 g / person) and Asia - 72.87% (39.70 g / person).
If we analyze the specific situation of 2010 variation limits are found for the indicator, from 39.85 g / person for Asia (-26.54%) to 104.54 g / person in the case of Oceania (+ 92.70%) in while the world has reached 54.25 g / person. Only Africa are below the global level (-21.44%, 42.62 g / person), the remaining units surpassing it as follows: + 18.73% Romania (64.41 g / person), 67 50% EU (90.87 g / person), + 71.83% America (93.22 g / person) and + 80.57% Europe (97.96 g / person).
Compared to the situation of 2011 is noticed a global level of 55.17 g / person for indicator, against which, the areas analyzed records 25.56% Asia (41.07 g / person) -23.85% Africa (42.01 g / person), + 15.58% Romania (63.77 g / person), + 65.16% EU (91.12 g / person), + 71.22% America (94.46 g / person), + 80.24% Europe (99.44 g / person) and + 87.42% Oceania (103.44 g / person).
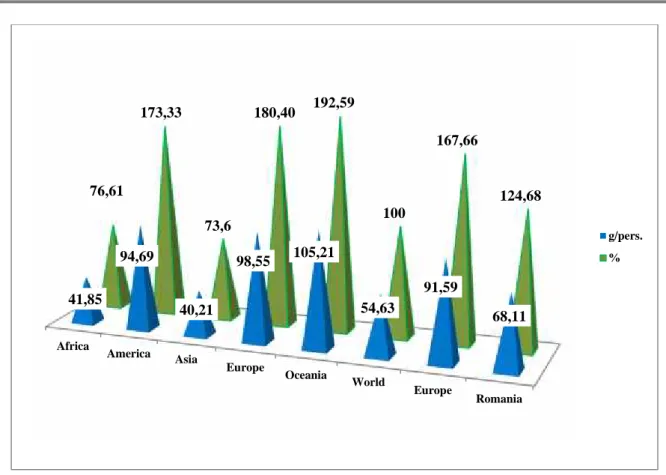
Average of period under review (2009-2011), is characterized by a daily food disposable from 54.63 g / person compared to it, for analyzed areas, there are the following state of affairs (fig. 3): 73.60% Asia (40.21 g / person); 76.61% Africa (41,85 g / person); Romania 124.68% (68.11 g / person); EU 167.66% (91.59 g / person); 173.33% America (94.69 g / person); 180.40% Europe (98.55 g / person); Oceania 192.59% (105.21 g / person).
Fig. 3. SUGAR.
The daily alimentary availability, period average (g/pers., %)
Table 4. Sugar - Daily caloric availability (kcal/zi/pers)
Specif.
YEAR
Period average
2009 2010 2011
Effective*
% Beside
world level**
Effective*
% Beside
world level**
Effective*
% Beside
world level**
Effective**
% Beside
world level**
Africa 145 74,74 151 78,24 148 75,51 148,00 76,16 America 348 179,38 336 174,09 341 173,98 341,67 175,82
Asia 141 72,68 141 73,06 146 74,49 142,67 73,42 Europe 347 178,86 345 178,76 350 178,57 347,33 178,73 Oceania 393 202,58 381 197,41 377 192,35 383,67 197,43
World 194 100 193 100 196 100 194,33 100
EU 330 170,10 323 167,36 324 165,31 325,67 167,59 Romania 268 138,14 226 117,10 223 113,78 239,00 122,99
*http://faostat3.fao.org/download/FB/CC/F(10.05.2015) **own calculation
The year 2010 is characterized by a global indicator level of 193 kcal / person, which is based on sequential level: 141 kcal / person for Asia (-26.94%), 151 kcal / person in Africa (-21.76 %), 226 kcal / person in Romania (+ 17.10%), 323 kcal / person in the EU (+ 67.36%), 336 kcal / person for America (+ 74.09%), 345 kcal / person Europe (+ 78.76%) and 381 kcal / person for Oceania (+ 97.41%).
If we analyze the specific situation of 2011 may notice a global level Indicator 196 kcal / person, which is not achieved in Asia and Africa (146 and 148 kcal / person - 74.49
Africa
America Asia
Europe
Oceania
World
Europe
Romania 41,85
94,69
40,21
98,55 105,21
54,63
91,59
68,11 76,61
173,33
73,6
180,40 192,59
100
167,66
124,68
(324 kcal / person), + 73.98% America (341 kcal / person), + 78.57% Europe (350 kcal / person) and + 92.35% Oceania (377 kcal / person).
Based on the data above, was determined the period average, which reached worldwide 194.33 kcal / person, to which the units analyzed were positioned (fig. 4): 73.42% Asia (142, 67 kcal / person); 76.16% Africa (148.0 kcal / person); Romania 122.99% (239.0 kcal / person); EU 167.59% (325.67 kcal / person); 175.82% America (341.67 kcal / person); 178.73% Europe (347.33 kcal / person); Oceania 197.43% (383.67 kcal / person).
Fig. 4. SUGAR
Daily caloric availability. Period average (kcal/pers., %)
CONCLUSIONS
In terms of total alimentary availability, is noted that the strictly upward over time evolution of the indicator, global situation imitated by Africa and Asia. In the case of America, Europe, Oceania and European Union the dynamics is uneven. Romania is the only entity that evolves strictly indicator downward.
Annual alimentary availability is characterized by an uneven trend for the period 2009-2011, with the exception of Asia and Europe where progress is upward, but also to Oceania which has a downward trend.
Regarding daily feed availabilities, there is an uneven development of the indicator (Africa, America, Europe, the EU and worldwide), but there are downward trends (Oceania and Romania) and one ascending trend (Asia).
Daily availability calorie per person (kcal / day / person) shows uneven developments, exception by Asia (upward trend) and Oceania and Romania (downward trend).
Africa
America Asia
Europe
Oceania
World
Europe
Romania 76,16
175,82
73,42
178,43 197,43
100 167,59 122,99 148
341,67
142,67
347,33
383,67
194,33
325,67
239,0
BIBLIOGRAPHY
1. Barbu C., Pânzaru R.L., 2000, Agrarian Economy, Hyperion Publishing House, Craiova
2. Constantin M., şi colab., 2009, "Marketing of agricultural
production"Editura Agro Tehnica, București.
3. Pânzaru R.L., 1999. Marketing agrifood, Universitatea din Craiova.
4. Pânzaru R. L., Medelete D. M., Ștefan G., 2007, "Elements of management and marketing in agriculture", Universitaria, Craiova.
5. Pânzaru R. L., Medelete D. M., Ștefan G., 2009, "The economy crop production", Universitaria, Craiova.
6. http://faostat3.fao.org/download/FB/CC/F