212
VARIATIONS OF CLIMATE PARAMETERS AND THEIR IMPACT ON
CABERNET SAUVIGNON AND SAUVIGNON BLANC PHENOLOGY IN
CONDITIONS OF CENTRAL SERBIA
PRŽIĆ ZORAN1,MARKOVIĆ, N.1
, RUML, M.1, VUKOVIĆ, A.1, VUJADINOVIĆ, M.1,
RANKOVIĆ-VASIĆ, Z.1
1Belgrade University, FacultyofAgriculture Department for horticulture,
Nemanjina6,11080Belgrade, Serbia (e-mail: [email protected])
Key words: Cabernet suvignon, Sauvignon blanc, climat parameters, phenology
ABSTRACT
Research carried out in vineyard of King Peter I Karadjordjevic-Royal Winery at Oplenac-Topola municipality, on Sauvignon blanc and Cabernet sauvignon. Vineyard planted with Sauvignon blanc is geographically positioned at GPS coordinates N 44° 14' 4" and E 20° 41' 15" and Cabernet sauvignon is geographically positioned at GPS coordinates N 44° 14' 35" and E 20° 41' 22". Climat parameters (series from 1982-2011 year) included following parameters: mean monthly, vegetation (april-october) and annual temperature, active and effective temperature, precipitation distribution (annual and vegetation) and wind direction. Phenological observation included beginning and end of following phenophases: bleeding, budbreakt, shoot growing, flowering, berry development and ripening. The greatest variation Sauvignon blanc manifested in duration of grape ripening which is in 2010. lasted 46 days while in 2011. lasted 34 days. Cabernet sauvignon in 2011. had a lower number of days that have passed from bleeding to full maturity (209 days) compared to 2010., when it passed 217 days.
INTRODUCTION
Annual biological vine cycle occurs in cycles and can be divided into smaller periods-growth stages, with specific morphological and anatomical changes. Phenological order is genetically conditioned and influenced by meteorological factors, variety, rootstocks etc. Depending on these factors, length of flowering is variable and can be different year by year (Nakalamić and Marković, 2009; Jones, 2010; Ladanyi et al., 2010 Schwab and Maaß, 2010).
Temperature change and variations during winter can influence budburst. With warmer winter ending can affect earlier budburst predominantly in hierarchy observed apical buds that during its development can inhibits buds that are lower in a position and reflects negatively on development during the growing season. For normal phonological stage most favorable is temperature conditions with out of big variation (Tomasi et al., 2005).
213
MATERIALS AND METHODS
Vineyard with Sauvignon blanc is planted in 2004, geographically positioned at GPS coordinates N 44° 14' 4" and E 20° 41' 15", Cabernet Sauvignon vineyard is planted in 2006. and geographically positioned at GPS coordinates N 44° 14 '35" and E 20° 41' 22". In both vineyards is presented row spacing of 2.70 m and 1.0 m spacing between vines in row. Training system is characterized with height of 90 cm on which is used Guyot pruning. All experimental vines was uniformly pruned where was left one arc with eight buds and spur with two buds. Data for analysis of climatic site conditions were obtained from climate station and are presented multi-year series from 1982-2011. year. In paper was analyzed following parameters: temperature (mean monthly, vegetation and annual temperature, monthly mean maximum, vegetation and annual temperature, average minimum monthly, vegetation and annual temperature, absolute maximum and minimum temperature, sum of active and effective temperature), precipitation (precipitation distribution: annual and vegetation), wind (direction and speed).
Phenological observational included beginning and end of: bleeding, bud burst, shoot growth, flowering, berry development and ripening. For testing was used BBCH identification key (Biologiche Bundesantalt Bundessorten amt and Chemical industry). Observations were carried out on the 10 experimental vines.
RESULTS
1. Climatic conditions 1.1. Temperature
The average annual temperature for the period 1982-2011 to Oplenac was 11.3°C, while mean vegetation temperature was 16.8°C. During experimental years (2010-2011) observed variation of average monthly, annual and vegetation temperature. During 2010. average monthly temperature varied in range of 0.0-21.9°C, in 2011. the variation ranged from 0.6-22.5°C.
Compared with period from the beginning of the measurements in this climate station (1982-2011.), june (21.5°C) and august (21.9°C) in 2010. can be considered as very hot months (table 1). Average annual temperature was in range of multi-year average for 1982-2011. period, while the average vegetation temperature was slightly lower (16.3°C).
In 2011. summer months (june with 20.0°C, july with 21.7°C and august with 22.5°C) and december (4.2°C) was very warm and november (3.8°C) was very cold compared to observations from 1965-2011. period (graph 1). Average monthly temperature in september (20.6°C) was the highest ever measured in this month at this station. In 2011., mean annual (11.6°C) and vegetation temperature (17.5°C) was higher than long-term average (11.3°C and 16.8°C).
Table 1 Average month temperature (°C) for 1982-2011. period and 2010. and 2011. years
tav (°C) I II III IV V VI VII VIII IX X XI XII YEA VEG
1982-2011 1,1 2,3 6,3 11,2 16,0 19,0 21,1 21,2 16,8 12,0 6,4 2,1 11,3 16,8 2010 0,0 2,7 6,8 11,4 15,7 18,8 21,5 21,9 16,0 8,7 11,4 1,8 11,4 16,3
2011 1,2 0,6 6,6 11,8 15,2 20,0 21,7 22,5 20,6 10,5 3,8 4,2 11,6 17,5
214
2011, sum of effective temperature was 1791°C, and was significantly higher than in 2010 (1529°C) in relation to 1982-2011 average of sum of effective temperatures (1636°C).
Graph 1. Mean monthly temperature for period 1982-2011
Mean maximum annual temperature for period 1982-2011 was 15.6°C, while mean vegetation temperature had value of 21.7°C (table 2). Mean vegetation maximum temperature in 2010 was lower (20.9°C) compared to average multi-year temperatures, while in 2011 had a higher value (22.5°C). Absolute maximums are shown in table 3.
Table 2 Maximum air temperature (°C) for period 1982-2011.
tmax (°C) I II III IV V VI VII VIII IX X XI XII YEA VEG
1982-2011 4,2 5,7 10,5 15,8 20,9 23,9 26,5 26,6 21,8 16,3 10,0 5,0 15,6 21,7 2010 3,1 5,9 10,8 15,8 20,0 23,3 26,6 27,2 21,1 12,3 16,0 6,1 15,7 20,9
2011 4,3 3,7 10,5 16,4 20,1 24,5 27,3 28,2 25,9 15,0 7,8 7,4 15,9 22,5
Table 3 Absolute maximum (°C) for period 1982-2011.
MAXIMUMI Tav Date Tmin Date Tmax Date
1982-2011 35,1 24.07.2007. 25,2 16.07.2010. 43,2 24.07.2007.
2010 29,7 27.08.2010. 25,2 16.07.2010. 35,0 27.08.2010.
2011 30,8 24.08.2011. 20,4 15.07.2011. 37,4 24.08.2011.
Minimum annual temperature for period from 1982-2011 was 6.8°C, while mean minimum vegetation temperature was 11.6°C. During 2010, average annual minimum was 7.3°C, while average vegetation minimum was 11.9°C. In 2011 was recorded lower value of average annual minimum (7.0°C) compared to 2010. Mean minimum vegetation temperature of 2011 was higher than mean minimum vegetation temperature in 2010 and for period 1982-2011 (table 4). In table 5 showed absolute minimum.
215
Minimal air temperature (°C) for period 1982-2011.
tmin (°C) I II III IV V VI VII VIII IX X XI XII YEA VEG
1982-2011 -2,0 -1,2 2,2 6,4 11,0 13,7 15,3 15,3 11,8 7,6 2,7 -1,0 6,8 11,6 2010 -2,7 -0,5 2,8 7,3 11,4 14,7 16,7 16,4 11,2 5,5 7,3 -2,1 7,3 11,9
2011 -2,0 -2,3 2,7 6,9 10,7 14,6 15,6 16,2 14,6 6,4 0,1 0,9 7,0 12,1
Table 5 Absolute minimum (°C) for period 1982-2011
1.2. Precipitation
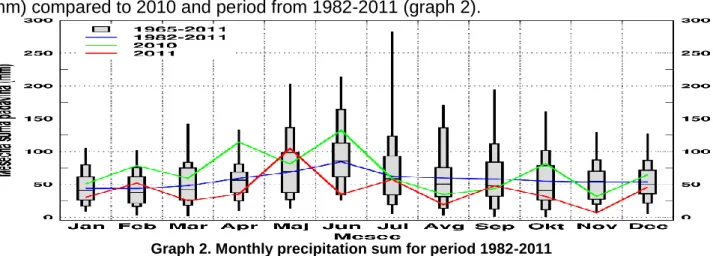
During period from 1982-2011 average annual precipitation was 691.3 mm, which is during growing season fell 447.8 mm of precipitation. On the basis of average precipitation for 2010 can be said that this year has been significantly rainy period of several years and since 2011. In 2010, average amount of precipitation per annum amounted to 832.1 mm, while during the growing season precipitation was 546.8 mm. In 2011, during annual period, but also during the growing season, fell less precipitation (491.2 mm and 330.8 mm) compared to 2010 and period from 1982-2011 (graph 2).
Graph 2. Monthly precipitation sum for period 1982-2011
1.4. Winds
In Oplenac, based on weather data for period 1982-2011, the most common is wind blowing from North West. Wind was with frequency of 92 days. Immediately after following winds with high frequency was wind from southwest with 70 days, 48 days from southeast, west-northwest with 41 day and west-southwest with frequency of 40 days.
Graph 3. Wind frequency and direction for period 1982-2011.
Mean wind speed varied between 1,5-2,4 m/s. The strongest wind was blowing from the south-east and south-southeast direction with speed of 2.4 m/s, while a wind
MINIMUM Tav Date Tmin Date Tmax Date
1982-2011 -13,6 24.01.2006. -19,4 25.01.2006. -10,2 08.01.1985
2010 -10,1 30.12.2010. -15 31.12.2010. -5 27.01.2010.
216
from west-southwest blew the weakest with intensity of 1.5 m/s (graph 3). Number of days without wind was 458.
2. Phenological observation
Blinding of Sauvignon blanc in 2010, it started earlier (3 days) compared to 2011. Blinding in 2010 lasted 15, while in 2011 lasted 16 days. It is noticeable before start of blinding during 2010 compared to 2011 when it began later. Bud burst were registered in both years, an average of 2-3 days after blinding termination. In 2010 burst lasted 9, while in 2011 lasted 8 days (table 6).
Flowering in 2010 was started on 6.6., while in 2011 it started a day earlier and lasted a shorter (8 days). During flowering in 2010. June is marked as a month with extremely lot precipitation which had effect on fertilization and in 2011 June was draught month with favorable temperature for fertilizing (20°C).
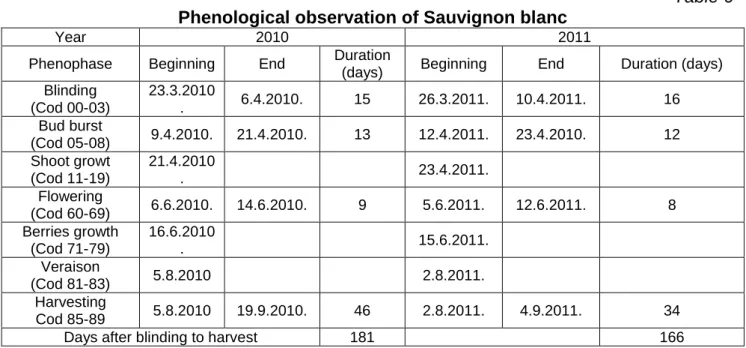
Start of ripening is marked with veraison which began in 2010 on 5.8., full grapes maturity in 2010 performed on 19.9.2010, while in 2011 on 4.9.2011.. Looking phenological observation for both years can be conclude that largest variation expressed in length of grapes maturation. Ripening in 2010, lasted 46 days, until, in 2011, lasted 34 days. Looking at the period from beginning of blinding up the harvest at full maturity, there have been significant variations. This period was in 2010 lasted 181 days, while in 2011 same period lasted significantly shorter 166-days what is difference of 15 days. Reason for shorter period is necessary to look at the weather conditions that prevailed during 2011 (upper mean vegetation temperature-17.5°C and less rainfall during the growing period-330.8 mm).
Table 6 Phenological observation of Sauvignon blanc
Year 2010 2011
Phenophase Beginning End Duration
(days) Beginning End Duration (days)
Blinding (Cod 00-03)
23.3.2010
. 6.4.2010. 15 26.3.2011. 10.4.2011. 16
Bud burst
(Cod 05-08) 9.4.2010. 21.4.2010. 13 12.4.2011. 23.4.2010. 12
Shoot growt (Cod 11-19)
21.4.2010
. 23.4.2011.
Flowering
(Cod 60-69) 6.6.2010. 14.6.2010. 9 5.6.2011. 12.6.2011. 8
Berries growth (Cod 71-79)
16.6.2010
. 15.6.2011.
Veraison
(Cod 81-83) 5.8.2010 2.8.2011.
Harvesting
Cod 85-89 5.8.2010 19.9.2010. 46 2.8.2011. 4.9.2011. 34
Days after blinding to harvest 181 166
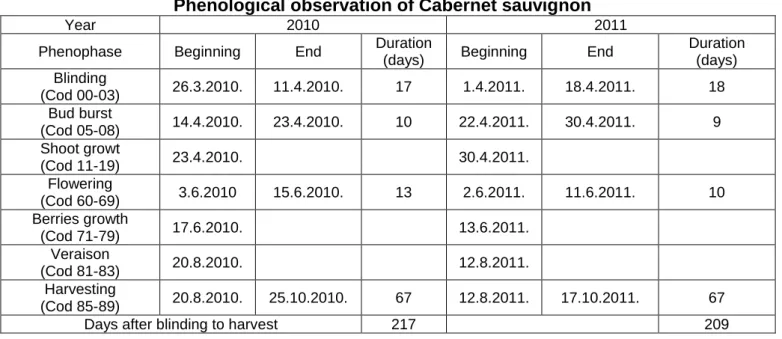
In 2010, blinding of Cabernet Sauvignon began earlier than in 2011 (4 days). Bud burst occurred in 2010, eight days earlier and lasted one day longer than in 2011.
Flowering both years occurred in June (2 and 3.6.). Veraison in 2010 starred on 20.8.2010. year, which is 8 days earlier than in 2011. Harvest in 2010 appeared significantly later than in 2011 (table 7).
217
temperatures during August, September and October, which evaluated as very warm and extremely hot months. During August, September and October in 2010 showed significantly lower temperatures which was lower than in 2011 and 1982-2011 period. October with a temperature of 8.7°C was extremely cold month in relation to 1982-2011 average. Low mean monthly temperature had a great influence on period length from blinding to ripening.
Table 7 Phenological observation of Cabernet sauvignon
Year 2010 2011
Phenophase Beginning End Duration
(days) Beginning End
Duration (days) Blinding
(Cod 00-03) 26.3.2010. 11.4.2010. 17 1.4.2011. 18.4.2011. 18
Bud burst
(Cod 05-08) 14.4.2010. 23.4.2010. 10 22.4.2011. 30.4.2011. 9
Shoot growt
(Cod 11-19) 23.4.2010. 30.4.2011.
Flowering
(Cod 60-69) 3.6.2010 15.6.2010. 13 2.6.2011. 11.6.2011. 10
Berries growth
(Cod 71-79) 17.6.2010. 13.6.2011.
Veraison
(Cod 81-83) 20.8.2010. 12.8.2011.
Harvesting
(Cod 85-89) 20.8.2010. 25.10.2010. 67 12.8.2011. 17.10.2011. 67
Days after blinding to harvest 217 209
ACKNOWLEDGEMENT
This paper was realized as a part of the project "Studying climate change and its influence on the environment: impacts, adaptation and mitigation" (43007) financed by the Ministry of Education and Science of the Republic of Serbia within the framework of integrated and interdisciplinary research for the period 2011-2014.
CONCLUSIONS
Based on results can be make following conclusions:
Agroecological conditions of Oplenac are favorable for growing vines. Mean annual temperature for period 1982-2011 at Oplenac was 11.3°C, while mean vegetation temperature was 16.8°C. In 2010, average monthly temperature varied in the range of 0.0-21.9°C, while during the 2011 variation ranged from 0.6-22.5°C.
Average annual precipitation was 691.3 mm, which is during growing season fell 447.8 mm of precipitation.
The most frequent was wind that blows from the North West direction with frequency of 92 days. This wind was followed by winds from the southwest, southeast, west-southwest and west-west-southwest diractions.
Blinding of Sauvignon blanc during 2010, started 3 days earlier than in 2011. In 2010, bud burst lasted 9, while in 2011 lasted eight days. Flowering in 2010 was started 6.6., and in 2011 began a day earlier. Veraison in 2010 started 5.8., three days later than in 2011. The full maturity in 2010 performed 19.9.2010 year, while in 2011 full maturity occurred 4.9.2011.
218
passed since blinding to full maturity (209 days) compared to 2010 when lasted 217 days.
BIBLIOGRAPHY
Bonnardot, V., Carey, V., Madelin, M., Cautenet, S., Coetzee, Z., Quenol, H. 2010 - Using atmospheric and statistical models to understand local climate and assess spatial temperature variability at fine scale over the stellbosh wine district, South Africa. VIII International terroir congress. Soave, Italy. Proceedings, vol. 1 pp. 14-19.
Fila, G., Belvini, P., Meggio, F., Pitacco, A. 2010 - Validation of phenological models for
grapevine in the Veneto region. VIII International terroir congress. Soave, Italy. Proceedings, vol. 1 pp. 124-128.
Jones, G. V. 2010 - Climate, Grape, and Wine: Structure and Suitability in a Changing Climate. Acta Horticultujrae. No. 931:19-28.
Ladanyi, M., Hlaszny, E., Pernesz, Gy., Bistray, G. 2010 - Climate change impact study
based on grapevine phenology moddelling. VIII International terroir congress. Soave, Italy. Proceedings, vol. 1(3) pp. 65-71.
Nakalamić, A., Marković, N.2009 - Opšte vinogradarstvo. Poljoprivredni fakultet,
Zadužbina svetog manastira Hilandar. Beograd.
Pierot, I., Rochard, J. 2013 - Adaptation to climate change. 36th World Congress of Vine
and Wine. Romania, Bucharest. Proceedings. ISBN: 979-10-91799-15-7.
Schwab , A., Maaß, U. 2010 - Climate change-variety change?. VIII International terroir congress. Soave, Italy. Proceedings, vol. 1(3) pp.62-64.
Tomasi, D., Pascarella, G., Sivilotti, P., Pitacco, A. 2005 - Grape Bud Burst: Thermal Heat Requirement and Bud Antagonism. Acta Horticulturae 754. pp. 205-211.
Van Leeuwen, C., Bois, B., De Resseguier, L., Pernet, D., Roby, J. P. 2010 - New methods and technologies to describe the environment in terroir studies. VIII International terroir congress. Soave, Italy. Proceedings, vol. 1 pp. 3-13.
Vuković, A., Vujadinović, M., Đujrđević, V., Ranković-Vasić, Z., Marković, N., Atanacković, Z., Sivčev, B., Petrović, N. 2010 - Appliance of climatic projections for climate change study in Serbian vineyard regions. VIII International terroir congress. Soave, Italy. Proceedings, vol. 1(3) pp. 36-41.