144
THEORETICAL ASPECTS ON OPTIMIZING THE QUALITY INDICES
OF MACHINES FOR APPLYING PHYTOSANITARY TREATMENTS
IN THE FIELD
NIŢU (ROŞU) M.1), VLĂDUT V.1), MATACHE M.1), MANEA D.1)
BUNGESCU S.2), CUJBESCU D.1), POPA V.1), BORUZ S.3),MITU M.1)
1)INMA Bucharest; 2) USAMVB Timişoara; University of Craiova
Keywords:solution, nozzles, equipments, soil
ABSTRACT
The correct application of phytosanitary treatments depends on several parameters influencing the quality indexes when applying phyto-sanitary treatments in a culture. The paper presents a few aspects regarding the quality indices of plant protection equipment treatments applied which directly influence the uniformity of the field distribution
INTRODUCTION
For applying phytosanitary treatments successfully, the paths on which the active substance moves and the ways the biological effect is carried out must be know.
In this sense, the notion of agro-availability was defined, representing the quantity of the dose (proportion, percentage) of product applied in an agrocenosis that gets on/in the harmful organisms and produces the biological effect or the combating effect. [1]
Depending on the applying mode, agro-availability can be classified thus:
the substance gets directly on the harmful organism;
the substance is taken by the harmful organism through the surface of the plant or soil, through ingestion or contact;
the substance in taken by the harmful organism indirectly through the sap of the grown plants. [4]
After the analyses in the lab it resulted that, compared to the dose applied with phytosanitary substances, the agro-available dose is only a small portion namely 0.01…0.001% of the recommended combating dose. The rest 99.9…99.99% is lost on the plants, on the soil, in the air, representing waste and a source of contaminating the environment.
The modern method of applying phytosanitary treatments is characterized by the fact that the drops are distributed directed towards the plants, leading to a growth in agro-availability of almost 2 times compared to usual sprayings, resulting the possibility to reduce the dose with 30…50%, ensuring an efficiency resembling to applying the whole dose in normal sprayings. [2]
In our country, losses in production due to harmful organisms can reach, in some cases, 35%, the reduction of specific losses and energy consumption being able to be reached, mainly by reducing the liquid dose per hectare.
145
MATERIAL AND METHOD
Following research (where average values of the parameter were considered), it results that, on reduced liquid doses, the losses on the soil are smaller (table 1).
Table 1 Liquid losses depending on the dose
Value of the liquid dose [l/ha]
Share from the dose retained by the leaves [%]
Liquid losses by leaks on the soil [%]
200 70 30
500 68 32
750 65 35
1000 61 39
1500 50 50
2400 30 70
These leaks represent, in fact, losses of active substance that influences the treatment costs on one hand, and on the other, is a polluting factor. [3]
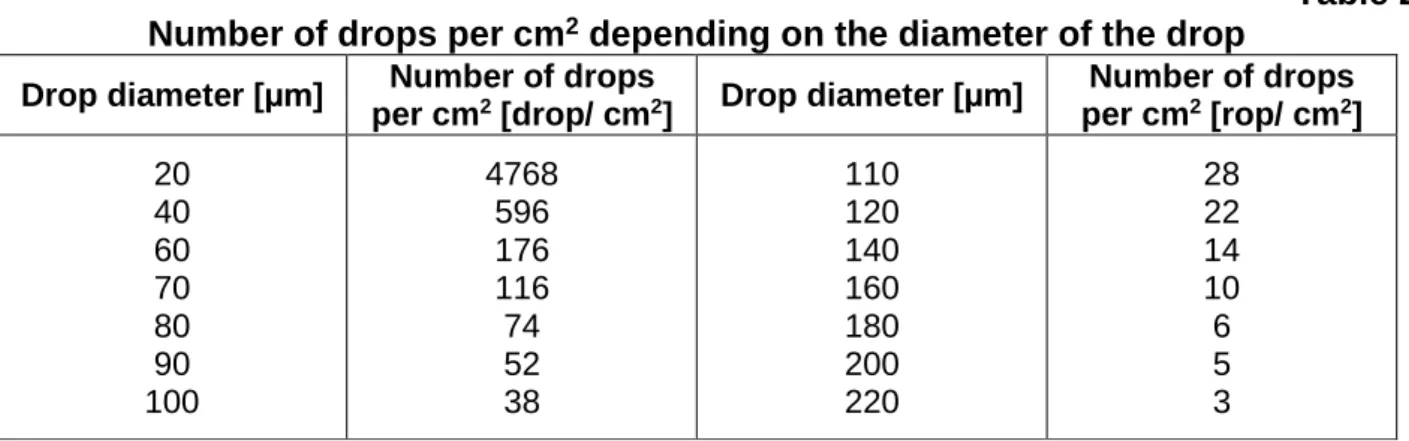
When applying phytosanitary treatments, the main objective is to distribute the active product on the surface of the plant or soil. This requirement is still hard to meet, the active substance has to be distributed on all the surface of the plant so that the losses will be as small as possible. If the substance spread could be pulverized in uniform drops of a given dimension, the theoretical drop density could be calculated. Table 2 shows the coverage that can be achieved with uniform drops, when the treatment is made using a 2l/ha dose.
Table 2 Number of drops per cm2 depending on the diameter of the drop
Drop diameter [µm] Number of drops
per cm2 [drop/ cm2] Drop diameter [µm]
Number of drops per cm2 [rop/ cm2]
20 40 60 70 80 90 100
4768 596 176 116 74 52 38
110 120 140 160 180 200 220
28 22 14 10 6 5 3
146
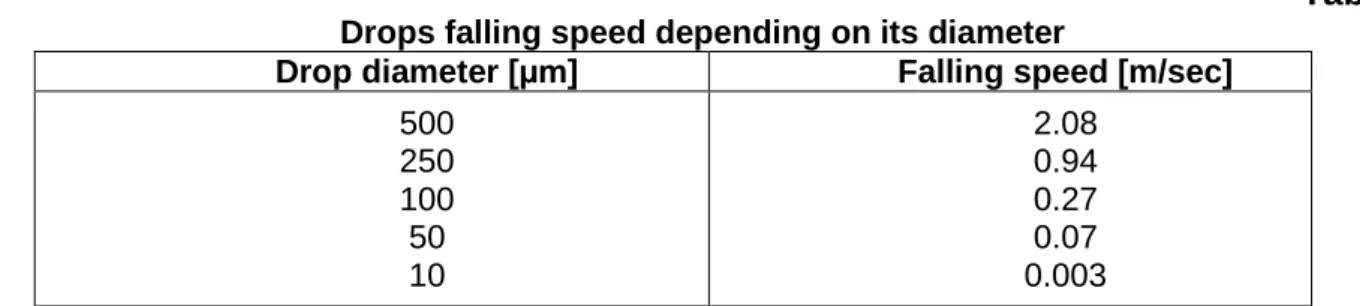
Table 3 Drops falling speed depending on its diameter
Drop diameter [µm] Falling speed [m/sec]
500 250 100 50 10
2.08 0.94 0.27 0.07 0.003
It results that drops smaller than 50 μm are carried for a longer period of time by the air. This phenomenon is called “drift” and is undesired because the drops do not reach the target objects.
Figure 1 shows the way the moving distance varies on horizontal for drops pulverized from a height of 3 m, without initial speed in a not turbulent air, at a wind speed of 1.4 m/sec.
Fig. 1 - Variation of floating distance of drops in the air depending on the diameter [3]
The reduction of liquid volume is made on the basis of increasing the spraying degree. There is an inferior limit for the size of the drops under which a high number of drops will have an insufficient impact on the plant and tend to be carried away by the wind. Within experimental research resulted that on machines for applying phytosanitary treatments by spraying, one of the most important elements are the spraying ends that, depending on the purpose of the work, have a specific construction and are based on working principles, also specific.
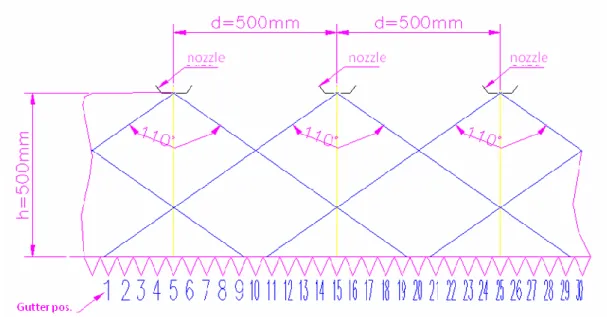
For phytosanitary treatments by spraying, the nozzle fabrication, but also their position on the boom, the adjustments of the distance from the soil or the surface of target objects and other working parameters, must be inscribed in severe exigency conditions.
RESULTS AND DISCUSSIONS
Theoretical research on nozzles most frequently used, namely nozzles with a fan type spray with an angle of 110°. [5]
147
theoretical deviations in applying spraying liquid, which are inscribed in the in the requirements of the quality standards, under 5%.
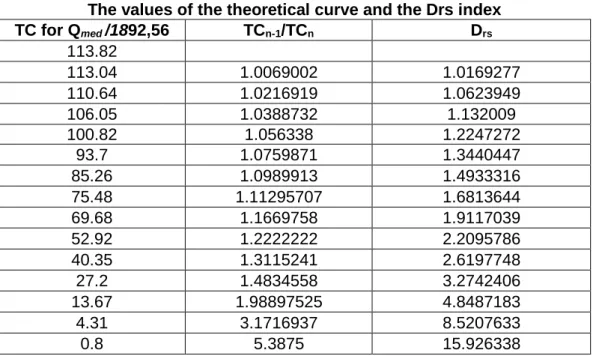
The theoretical curve was generated on the computer for a specific nozzle flow, a flow that was determined as an average of at least five tests of the same type and in the same conditions, its value being 1892.56 l/min for a nozzle of the type Albuz Tifone – ISO 11005 at a pressure of 0.31 MPa.
Among other indices, the value of the respective curve appears like it is shown in table 4.
Table 4 The values of the theoretical curve and the Drs index
TC for Qmed /1892,56 TCn-1/TCn Drs
113.82
113.04 1.0069002 1.0169277
110.64 1.0216919 1.0623949
106.05 1.0388732 1.132009
100.82 1.056338 1.2247272
93.7 1.0759871 1.3440447
85.26 1.0989913 1.4933316
75.48 1.11295707 1.6813644
69.68 1.1669758 1.9117039
52.92 1.2222222 2.2095786
40.35 1.3115241 2.6197748
27.2 1.4834558 3.2742406
13.67 1.98897525 4.8487183
4.31 3.1716937 8.5207633
0.8 5.3875 15.926338
The sequential distribution index (Drs) represented a first calculation step in the theoretical research for observing the degree of significance of the specific deviation, which emerges from comparing real values obtained on stand during tests to the theoretical values for a single nozzle. It was chosen to determine the maximum deviation values inscribed in the ± 5% range out of the total distribution from overlapping the sprays because there are situations in practice when, by fitting the nozzles on the boom, the positive deviations in the nozzle’s spray asymmetry can compensate the negative deviations of close asymmetry values of the neighboring nozzle.
CT n
1 n
I CT
CT
(1)
where:
CTn= sequential value of the theoretical curve.
CTn-1= anterior sequential value of the theoretical curve.
ICT = differentiation index for the distribution of fragmentation in the theoretical curve
and: Drs=ICT Idrs (2)
where:
Drs= differentiation value of the sequential distribution.
Idrs= differentiation index for the sequential distribution of depending on the value of
arctg (centesimal).
148
Fig. 2 – Schematic representation of the angles delimited between the nozzles
slit and the gutter’s edges [5]
From the idea mentioned above, the Idrs index was calculated with the following relation:
1 n n
0 drs
I
(3)
The values presented in table 5 help calculate the Drs index (table 4).
Table 5 Calculation mode for the index of differentiation of sequential distribution (Idrs)
Angle Idrs
0
-
1
1.0099880
2
1.03983897
3
1.08965082
4
1.15940853
5
1.24912720
6
1.35882035
7
1.48849861
8
1.63816937
9
1.80783714
10
1.99750416
11
2.20717109
12
2.43683756
13
2.68650259
14
149
In practice, the nozzles mounted on the boom at a 50 cm distance, at a height from the ground of also 50 cm, overlap their sprays double or triple as shown in figure 3.
Fig. 3 – Sprays overlapping from neighboring nozzles
The calculation formula (that we propose as a substantive theoretical contribution) for the maximum lateral sequential deviation values specific to a nozzle is the following:
] ml [ 100
D CT CT
V n rs
n aa
, (4)
where:
Vaa = allowable deviation values
Applying these deviation values in sequential distributions resulted from overlapping sprays as shown in figure 3, the results from table 6 are obtained:
Table 6 Theoretical inscribing of the value Vaa (all positive) in the maximum deviation of 5%
of the average flow for the nozzle Albuz Tifone 11005
Stand pos.
Partial theoretical flows for three neighboring
nozzles
Summed theoretic
al Q
Theoretical Vaa
for each nozzle
Cumulated Vaa
Q summed +
Vaa
cumulated
5 40.35 40.35 113.82 194.52 1.06 1.06 - 2.12 196.64
6 52.92 27.2 113.04 193.16 1.17 0.9 1.15 3.22 196.38
7 69.68 13.6 110.64 193.92 1.33 0.67 1.18 3.18 197.1
8 75.74 4.31 106.05 186.1 1.27 0.37 1.2 2.84 188.94
9 85.26 0.2 100.82 186.88 1.27 0.14 1.23 2.64 189.52
10 93.7 - 93.7 187.4 1.26 1.26 2.49 189.89
11 100.82 0.8 85.26 186.88 1.23 0.14 1.27 2.64 189.52
12 106.05 4.31 75.74 186.1 1.2 0.37 1.27 2.84 188.94
13 110.64 13.67 69.68 193.92 1.18 0.67 1.33 3.18 197.1
14 113.04 27.2 52.92 193.16 1.15 0.9 1.17 3.22 196.38
Q med. 190.2
Q med + 5% 199.71
where:
150
It was found from table 2.6 that the values Vaa (all positive) in Qsummed its sequantial values are smaller than Qmed + 5%.
In practices, positive or negative deviations are made on certain segments of the distribution width of the fragmentation specific to the nozzle and the calculated values for Vaa have a coefficient increasing as we depart from the spray’s median, a fact that occurs because the values of the theoretical curve decrease scaled in a similar way. For the values of the theoretical curve from the center of the fan, positive or negative deviations can be taken into consideration, but not more than ± 1.5%, otherwise the specific maximum ± 5% deviation can be exceeded due to the overlapping of sprays.
In practices, even if we equip a machine for applying phytosanitary treatments with a set of new nozzles, we do not have the guarantee that the fragmentation distribution is an acceptable one, reason for which every nozzle in the set must tested individually.
The maximum sequential deviation values determined on stand, compared to the values from the specific theoretical curve, cannot exceed the values calculated for Vaa taken positively or negatively. [5]
CONCLUSIONS
- Researches on plant protection and on mechanizing plant protection works must lead to the elaboration of new principles of applying chemical and microbiological products, in such a manner that especially the harmful organisms are treated, and less the plant and the soil. This is a task for the future, hard to resolve, but necessary for the plant and environment protection.
- Herbicides have the largest share compared to insecticides and fungicides. In a modern agriculture, the value invested in herbicides is double compared to the one invested in insecticides and 3÷4 times bigger than the one for fungicides.
- A condition for manufacturing machines for plant protection is the reduction of pesticide and water consumption. The benefic implications are: economic efficiency and reduced environment pollution.
- Throughout conducting the treatment will be followed permanently the values of the wind speed and direction, as well as the level of air temperature, the maximum values of the respective parameters being of 3 m/s for the wind speed and 30° C for the air temperature.
- In the case of spraying, depending on the type of machine, different ranges of drops are achieved. Thus, in the case of machines equipped with pneumatic spraying ends, the range is from 10…20 μm to 800…1000 μm. The drop range is smaller for hydraulic high pressure spraying ends namely between 100…500 μm.
- The industry manufacturing machines for plant protection tries to obtain machines that reduce to a minimum the losses of pesticides. This is made by limiting the drops specter, by reducing to a minimum the number of drops that are to small (20…30 μm) that lead to losses by exodrift (they drift outside the treatment area) and the number of drops that to big causing losses by endodrift (leaks in the soil where the treatment is made).
- Worldwide, the evolution of quality parameters of the spraying process conducted by spraying machines is very fast, due to the large progresses in the chemical industry and in the agricultural research, as well to the current acute necessities to reduce the specific consumption of fuel, pesticides, work force and environment pollution.
BIBLIOGRAPHY
151
2. Baicu T., 1977 - Pesticide movement in harmful organisms and in the environment,
CMDPA, Bucharest;
3. Brătucu Gh., Pădureanu V., 2002 - Researches regarding the environmental pollution
reduction in agriculture by recovering the losses in phyto-sanitary substances, Bulletin of
the Conference "Energy efficiency and agricultural engineering", Ruse, Bulgaria, vol. 2;
4. Diaconu N., 2001 - Contribuţions on improving the work process of equipments for
applying phytosanitary products, by recovering losses, Doctoral Thesis, Transilvania
University, Braşov;
3. Popescu M., 2007 - Research on optimizing the work quality indices of machines for
![Fig. 2 – Schematic representation of the angles delimited between the nozzles slit and the gutter’s edges [5]](https://thumb-us.123doks.com/thumbv2/123dok_us/8072858.2138587/5.892.218.682.88.418/fig-schematic-representation-angles-delimited-nozzles-gutter-edges.webp)